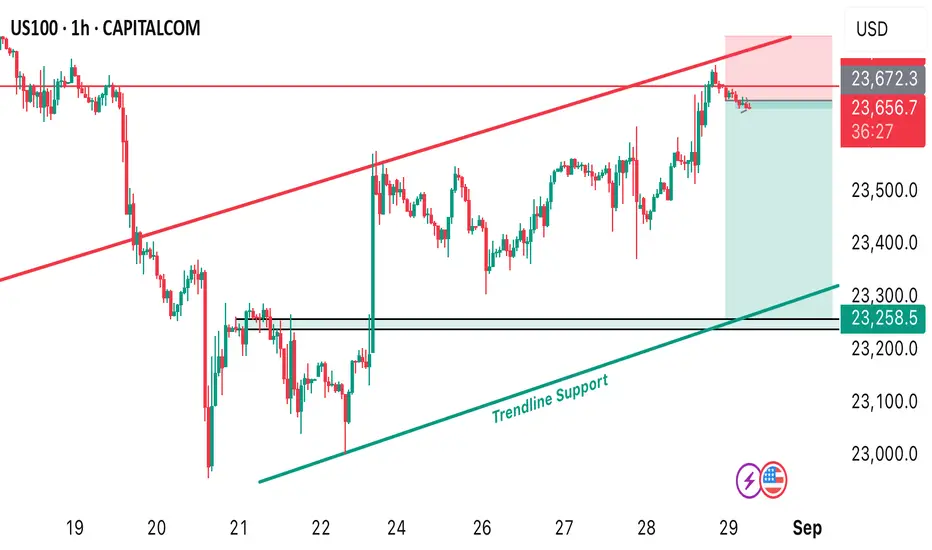
US100-POTENTIAL SELL IDEAThe long awaited sell opportunity that we envisaged on US100 is confirmed today and we’re ready to ride the sell from the current market price. Our first take profit level is at 23258.5 our stop loss is at 23699
USTECH100CFD trade ideas
Trendline Pullback BreakThe price made a pullback after a bearish move and now it has broken the pullback trendline, followed by a small pullback and now it looks to make a bearish move
WE ONLY TRADE PULLBACKS
Comment your thoughts

NASDAQ (US100) | Bullish Bias - Continuation in Play🔹 HTF (4H): Structure is bullish and respected. Momentum is strong to the upside, and higher lows remain intact — bullish intent confirmed.
🔹 MTF (30M): Refined structure shows price slashed through the recent internal OB but held — structure remains intact. A deeper sweep into an internal OB refined the order block further.
🔹 LTF (5M): Price switched character from bearish to bullish. Previous week we caught a bullish move, now looking for a second continuation setup toward highs this week.
🔹 Execution Plan: Waiting for price to mitigate the OB zone. Once tapped, we’ll attend bullish longs with precision.
🔹 Mindset Note: Patience is the edge — let smart money reveal itself before taking the next position.

NAS100 H4 | Bearish Reversal off Pullback Resistance"NAS100 is rising towards the sell entry at 23,679.28, which is a pullback resistance and could reverse from this level ot the take profit.
Stop loss is at 23,939.64, which is a swing high resistance.
Take profit is at 23,292.38, which is a pullback support that alignss with the 50% Fibonacci retracement.
High Risk Investment Warning
Trading Forex/CFDs on margin carries a high level of risk and may not be suitable for all investors. Leverage can work against you.
Stratos Markets Limited (tradu.com ):
CFDs are complex instruments and come with a high risk of losing money rapidly due to leverage. 65% of retail investor accounts lose money when trading CFDs with this provider. You should consider whether you understand how CFDs work and whether you can afford to take the high risk of losing your money.
Stratos Europe Ltd (tradu.com ):
CFDs are complex instruments and come with a high risk of losing money rapidly due to leverage. 66% of retail investor accounts lose money when trading CFDs with this provider. You should consider whether you understand how CFDs work and whether you can afford to take the high risk of losing your money.
Stratos Global LLC (tradu.com ):
Losses can exceed deposits.
Please be advised that the information presented on TradingView is provided to Tradu (‘Company’, ‘we’) by a third-party provider (‘TFA Global Pte Ltd’). Please be reminded that you are solely responsible for the trading decisions on your account. There is a very high degree of risk involved in trading. Any information and/or content is intended entirely for research, educational and informational purposes only and does not constitute investment or consultation advice or investment strategy. The information is not tailored to the investment needs of any specific person and therefore does not involve a consideration of any of the investment objectives, financial situation or needs of any viewer that may receive it. Kindly also note that past performance is not a reliable indicator of future results. Actual results may differ materially from those anticipated in forward-looking or past performance statements. We assume no liability as to the accuracy or completeness of any of the information and/or content provided herein and the Company cannot be held responsible for any omission, mistake nor for any loss or damage including without limitation to any loss of profit which may arise from reliance on any information supplied by TFA Global Pte Ltd.
The speaker(s) is neither an employee, agent nor representative of Tradu and is therefore acting independently. The opinions given are their own, constitute general market commentary, and do not constitute the opinion or advice of Tradu or any form of personal or investment advice. Tradu neither endorses nor guarantees offerings of third-party speakers, nor is Tradu responsible for the content, veracity or opinions of third-party speakers, presenters or participants.

NAS100 - BullishNAS100 is at the support of the ascending parallel channel. It has printed a hidden divergence as well.
Both of these observations indicate a Bullish signal. Hence NAS100 can be bought at Current Market Price with a stop loss at last swing low.

Nas100 Trade Set Up Sep 3 2025FX:NAS100
www.tradingview.com
Price is within a LH and LL range so i would like to see LH or PDH swept as liquidity before a continuation back down towards SSL

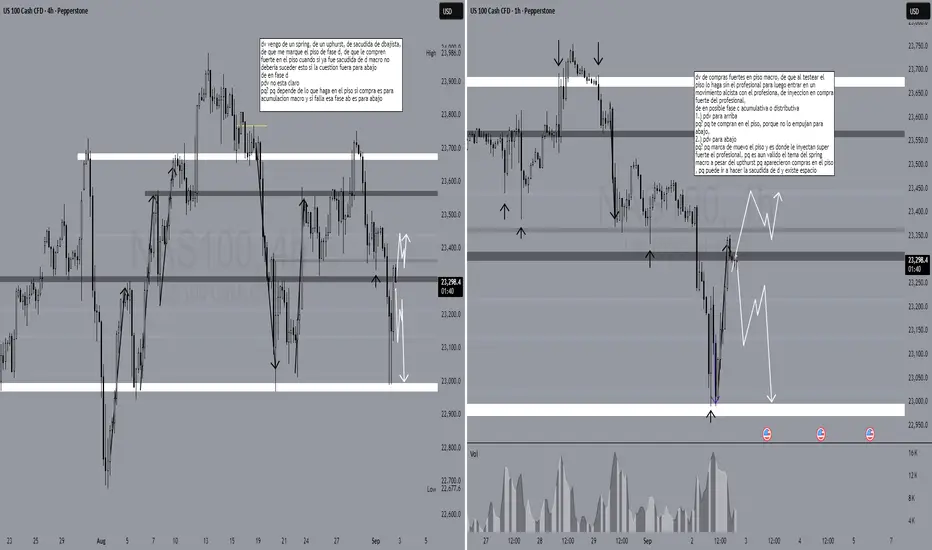
key levels for the nqIf the nq breaks 23362 we have enough information to wait for a shakeout and then enter. if it breaks 23210.7 we got to wait for a retracement and then a shakeout to sell. But, be aware that for sales the target should be more aggressive which means to cover on 23k, and just in case, we can leave a small portion of the position open but cover more than 70% because it might be the macro shakeout.
Nas100 Trade Set Up Sep 2025FX:NAS100
www.tradingview.com
Price broke PDL and approaching daily SSL while making LH/LL so i want to see a slight pull back before continuing lower

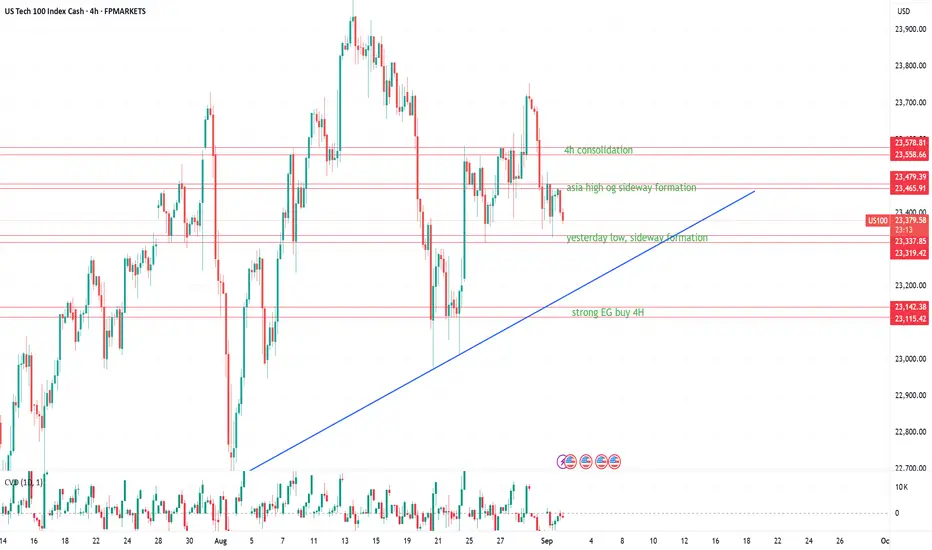
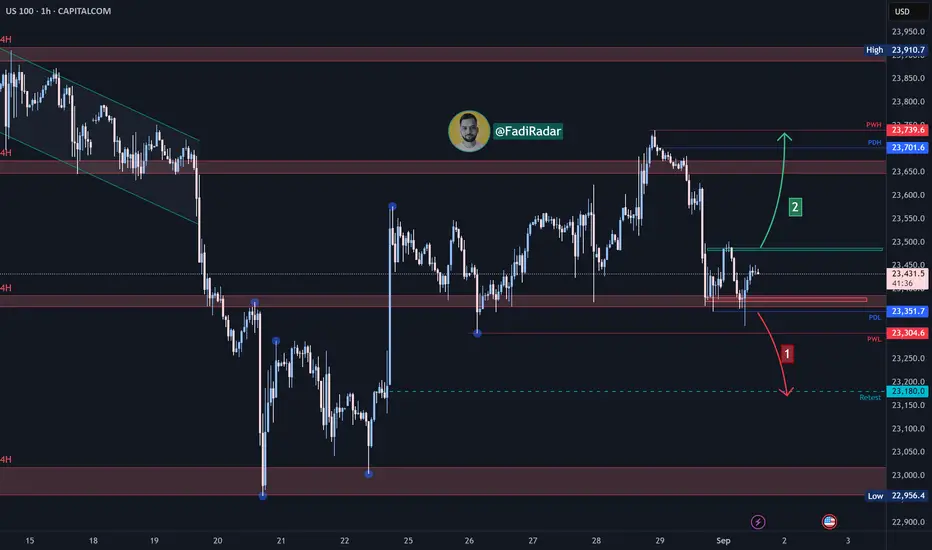
US100 – London Session Trade LevelsMarket Context
The Nasdaq-100 is currently trading within a consolidation pattern after being rejected around ~23,700. Momentum has slowed, and the market is searching for direction. During the London session, the focus is on intraday reactions around key levels. These zones may act as catalysts for either continuation or short-term reversals, depending on price action.
Sell Zones
23,465–23,480 (Asia high / sideways formation)
This zone represents the top of the Asian range and extends from a sideways structure.
A retest during London hours may trigger short-term selling momentum, especially if volume fades compared to Asian trading.
23,558–23,579 (4H consolidation)
A clear resistance area from the latest 4H consolidation, where several bullish attempts were previously absorbed.
If price fails to break this area with strong momentum, it is likely to act as a solid supply zone.
Buy Zones
23,320–23,338 (Yesterday’s low / sideways formation)
Represents yesterday’s low and a key intraday balance point.
If price dips into this area during London hours and shows absorption (e.g., long wicks / stronger CVD on the bid), it may serve as a springboard for a bounce.
23,115–23,140 (Strong 4H demand)
The strongest buy zone on the chart, aligning with both a structural support level and a prior reaction zone on 4H.
A test of this zone may indicate a “capitulation move,” where stronger buyers could be waiting.
Market Update and Sentiment Analysis
Overall Assessment
The Nasdaq-100 (US100) currently finds itself in uncertain territory. The technology sector, historically the driving force behind the index’s performance, faced headwinds toward the end of August. Rotation into small-cap equities, rising uncertainty ahead of key macroeconomic data and the Federal Reserve’s rate decision, as well as weak technical signals, are all contributing to a mixed sentiment picture.
Market Developments
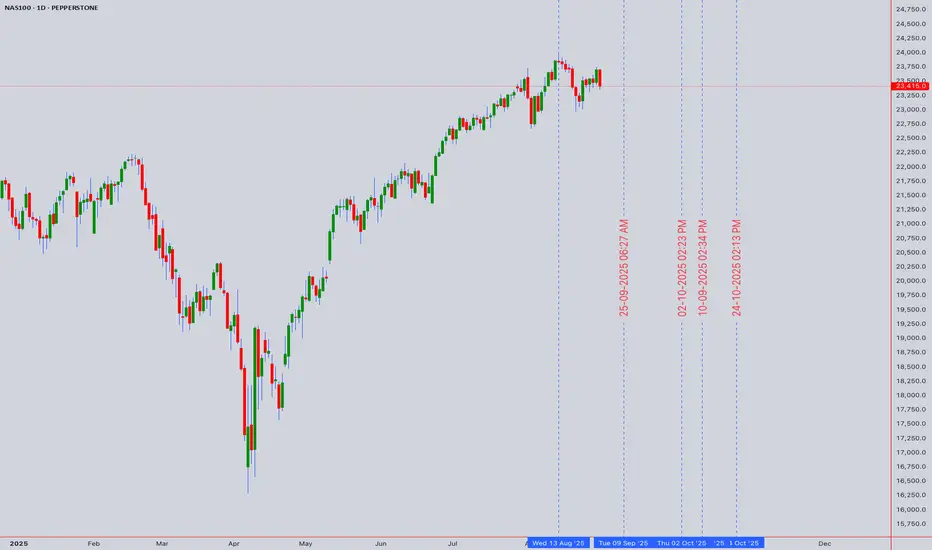
End of August: The Nasdaq-100 closed the month down approximately –1.2%, bringing the index to around 23,415. Despite the pullback, year-to-date performance remains up by roughly 10–11%.
Sector Rotation: The small-cap segment (Russell 2000) gained 7.3% in August, significantly outperforming the Nasdaq-100. The shift away from technology reflects both concerns about AI profitability and expectations of future rate cuts, which traditionally favor smaller companies.
Earnings Pressure: Weak earnings from companies such as Dell, Nvidia, and Marvell Technology disappointed the market. Margin pressure within the tech sector has raised concerns about growth prospects.
Macroeconomic Context
Data Sensitivity: The market is displaying extreme sensitivity to employment and inflation data. Even minor deviations in key figures can trigger significant price movements.
Federal Reserve: Investor attention is focused on the Fed’s upcoming rate decision. Expectations of a rate cut later in the year serve as a supportive factor, though uncertainty remains elevated.
Historical Pattern: September has traditionally been the weakest month for the Nasdaq index. This increases the risk of additional volatility in the weeks ahead.
For the London session, the focus is on short intraday moves around well-defined supply and demand zones. Given the broader negative bias in the market, traders should be extra cautious with longs — confirmation and strong absorption signals are key before entering buys.

Change in State of delivery When you look at your daily tf the last closed candle which is Friday's candle has closed bellow the Thursday's candle, which is a signature that the
bullishness is loosing strength, therefore in the coming week we should be looking for sell setups, unless there's no rejection at those two marked gold levels.

NAS100 ShortElite Analysis
Executed off a 3m True OB
All confirmations met.
Targeting lower liquidity

NAS100 SELL 15 MINUTE TIMEFRAMESTRONG SUPPLY ZONE Fair value gaps to fill Amazing Range 3:1 Risk Reward, Let's See!

US100 Consolidating? With raection around 2300 area level, its clear to see that bulls are not ready to let go yet. This purely based of technicals. I'm expecting a bit of a pull to get an entry @ 23211 hopefuly the market will be in our favour.

NAS100 LongThis is now oversold on all timeframes, showing sellers exhaustion
There is a deep crab pattern on H4 and H1 displaying a potential reversal zone
There is great support at this level as daily trend is also pointing up
Double bottom on M15 showing divergence
Stoploss of 150 pips

NASDAQ Index Analysis (US100 / NASDAQ)At today’s market open, the NASDAQ index started to decline and is currently heading to test the key support level at 23,000.
🔻 Bearish Scenario:
If the price breaks below 23,000 and holds, it is likely to move lower towards the next support level at 22,700.
🔺 Bullish Scenario:
If the price rebounds and breaks above 23,260, holding above it may support further upside toward 23,350.
Nasdaq long Looking for longs .
Entered a small size at 23200. Sl just under the lows .
Let us see what this brings on.

Nasdaq Under Pressure as Rally StallsThe Nasdaq is showing signs of weakness after its recent surge toward record highs. Profit-taking, especially at the end of the month, has weighed on tech stocks, while the broader market digests Powell’s dovish signals from Jackson Hole.
Despite optimism around potential rate cuts, valuations in the Nasdaq remain stretched, leaving the index vulnerable to corrections. Rising bond yields, even if off their peaks, are still creating headwinds for high-growth sectors.
Geopolitical concerns and renewed tariff discussions add another layer of uncertainty. At the same time, several heavyweight tech names have already reported earnings, removing a key driver of recent upside momentum.
Technically, the index is testing short-term support. If this level fails, a retracement toward 21,500 or even the 50-day moving average could follow. The daily chart has started to print rejection candles, hinting that buying pressure is fading.
While the long-term trend remains intact, short-term risks are building. Unless the Nasdaq can reclaim its highs quickly, a pullback looks increasingly likely as markets rebalance and investors take a more cautious stance.

US100 Expected Growth! BUY!
My dear subscribers,
This is my opinion on the USOIL next move:
The instrument tests an important psychological level 23405
Bias - Bullish
Technical Indicators: Supper Trend gives a precise Bullish signal, while Pivot Point HL predicts price changes and potential reversals in the market.
Target - 23590
About Used Indicators:
On the subsequent day, trading above the pivot point is thought to indicate ongoing bullish sentiment, while trading below the pivot point indicates bearish sentiment.
Disclosure: I am part of Trade Nation's Influencer program and receive a monthly fee for using their TradingView charts in my analysis.
———————————
WISH YOU ALL LUCK

NAS100 Bullish OutlookHi there,
The NAS100 on the H2 chart appears bullish, following the (B) sequence to HH (C), then potentially pulling back up to 24,431, with two price targets. Price is stretched and unstable. Volatility seems thin but bullish over the H4 and the daily timeframes.
There will need to be monitoring.
Happy Trading,
K.

NAS100 Technical Analysis Report - NASDAQ & US Market# NAS100 Technical Analysis: NASDAQ Comprehensive Multi-Timeframe Trading Strategy
Executive Summary
Current Price: 23,415.0 (August 30, 2025, 12:54 AM UTC+4)
Market Sentiment: Cautiously Bullish with Rate Cut Optimism
Primary Trend: Uptrend with consolidation characteristics
Key Catalyst: Fed Chair Powell's Jackson Hole speech signaling potential September rate cut
The NASDAQ-100 continues to demonstrate resilience following Fed Chair Jerome Powell's dovish signals at Jackson Hole, with markets pricing in high probability of September rate cuts. The index benefits from renewed optimism in technology sectors and artificial intelligence themes, though elevated valuations warrant selective positioning.
Market Context & Fundamental Backdrop
Federal Reserve Policy Outlook
Following Powell's Jackson Hole speech, markets have significantly increased bets on a September rate cut. The Fed Chair indicated that "conditions may warrant" interest rate cuts, with the balance of risks to employment and inflation shifting. Current federal funds rate remains at 4.25%-4.50%, but CME FedWatch Tool shows high probability of cuts beginning in September 2025.
Economic Environment
The US economy has shown resilience despite policy uncertainties, with the dual mandate of the Fed becoming more balanced. Labor market data shows some "unusual" behavior that could become concerning, supporting the case for monetary policy adjustment.
Technology Sector Dynamics
The artificial intelligence boom remains robust, providing fundamental support for NASDAQ constituents. However, chipmaker volatility has created intermittent pressure on the index, requiring careful sector rotation analysis.
Market Performance Context
Recent trading sessions have shown volatility, with the NASDAQ experiencing both significant gains and pullbacks. The index closed at 21,449.29 in late August trading sessions, demonstrating the current consolidation phase around elevated levels.
Technical Analysis Framework
Japanese Candlestick Analysis
Weekly Pattern: Long-legged doji formation indicating indecision at current levels
Daily Pattern: Inside bar sequences suggesting consolidation before next major move
Intraday Patterns: Morning star and evening star formations frequent in 4H timeframe
Volume Analysis: Average volume during recent consolidation phase
Elliott Wave Analysis
Primary Wave Structure:
Major Degree: Wave 5 of secular bull market potentially in final stages
Intermediate Degree: Subwave 5 of major Wave 5 showing extension characteristics
Minor Degree: Currently in subwave 4 correction within intermediate Wave 5
Wave Count Analysis:
Impulse Wave: Completed from 2020 lows to recent highs
Corrective Phase: Current consolidation representing Wave 4 of larger structure
Target Projection: Wave 5 completion targeting 25,000-26,000 zone
Critical Levels: Wave 4 support at 22,800-23,200 maintains bullish count
Harmonic Pattern Recognition
Active Harmonic Structures:
Bullish Cypher Pattern: Potential completion at 22,900-23,100 zone
ABCD Extension: Current formation targeting 24,200-24,500
Potential Bearish Gartley: Formation risk above 24,800 indicating reversal
Fibonacci Confluence Analysis:
- 61.8% retracement of major swing: 23,150
- 50% retracement level: 23,400 (current area of interest)
- 38.2% retracement: 23,650
- 1.618 extension target: 24,300-24,500
Wyckoff Method Analysis
Phase Assessment: Accumulation Phase D - Testing resistance
Market Structure:
- Sign of Strength (SOS) evident on rate cut optimism
- Last Point of Support (LPS) established around 23,000
- Backup to Edge of Creek (BUE) tests showing institutional accumulation
- Spring action potentially completed in August lows
Composite Operator Activity: Evidence of large player accumulation during recent weakness
W.D. Gann Technical Analysis
# Square of 9 Application
Current Position: 23,415.0 = 152.98° on the Gann wheel
Critical Resistance Levels:
- 23,409 (153°) - immediate geometric resistance
- 23,716 (154°) - intermediate resistance zone
- 24,025 (155°) - major resistance confluence
Key Support Levels:
- 23,104 (152°) - immediate geometric support
- 22,801 (151°) - strong support zone
- 22,500 (150°) - major psychological and geometric support
# Time Theory Application
Critical Time Cycles:
- September 3-6: 90-degree time angle from recent high
- September 21: Autumn equinox - natural market turning point
- October 12-15: 144-degree time cycle completion
- November 2-8: 180-degree cycle from major low
# Price and Time Squaring Analysis
Square Root of Price: √23,415.0 = 152.98
Next Significant Square Levels:
- 154² = 23,716 (key resistance zone)
- 155² = 24,025 (intermediate target)
- 156² = 24,336 (extended resistance)
- 160² = 25,600 (long-term target)
Support Square Levels:
- 152² = 23,104 (immediate support)
- 151² = 22,801 (strong support)
- 150² = 22,500 (major support)
# Gann Angle Analysis
Primary Angles from Major Low:
- 1x1 Angle: Providing dynamic support around 23,200
- 2x1 Angle: Resistance trend line near 23,800
- 1x2 Angle: Long-term support at 22,600
Ichimoku Kinko Hyo Analysis
Cloud Configuration:
Tenkan-sen (9): 23,425 - Price slightly below, neutral bias
Kijun-sen (26): 23,380 - Price above, mild bullish confirmation
Senkou Span A: 23,402 (cloud top)
Senkou Span B: 23,150 (cloud bottom)
Chikou Span: Above price action 26 periods ago (bullish)
Assessment: Price trading at cloud top resistance with mixed signals requiring breakout confirmation for directional clarity.
Multi-Timeframe Technical Indicator Analysis
5-Minute Chart (Scalping Focus)
RSI(14): 51.3 - Neutral territory with slight bullish bias
VWAP: 23,408 - Price oscillating around VWAP equilibrium
Bollinger Bands: Middle band at 23,410, bands contracting (low volatility environment)
Stochastic: 48.2 in neutral zone
Volume: Below average, typical for consolidation phase
Key Scalping Levels:
Micro Resistance: 23,435, 23,460, 23,485
Micro Support: 23,390, 23,365, 23,340
15-Minute Chart (Scalping Focus)
MACD: Histogram near zero line, momentum neutral
Williams %R: -52% indicating no extreme conditions
Moving Averages: EMA(20) converging with SMA(20) around 23,400
Volume Profile: High volume node at 23,380-23,430
Scalping Strategy Levels:
Long Bias Zone: 23,385-23,405
Short Bias Zone: 23,445-23,465
Breakout Alerts: Above 23,480 (bullish) / Below 23,360 (bearish)
1-Hour Chart (Day Trading)
RSI(14): 54.7 - Slight bullish momentum without overbought conditions
VWAP: 23,395 providing dynamic support
ADX(14): 28.3 indicating moderate trend strength
Parabolic SAR: Below price at 23,350 (bullish signal)
Day Trading Framework:
Primary Resistance: 23,500-23,550
Secondary Resistance: 23,650-23,700
Primary Support: 23,250-23,300
Secondary Support: 23,100-23,150
4-Hour Chart (Swing Trading)
RSI(14): 58.9 in bullish territory but not overbought
MACD: Positive momentum with slight bullish divergence forming
Bollinger Bands: Price near upper band, expansion needed for continuation
Ichimoku: Price at cloud resistance requiring break for bullish confirmation
Swing Trading Levels:
Key Resistance Zone: 23,700-23,800
Breakout Target: 24,000-24,200 on sustained break
Support Structure: 23,200-23,300
Stop Loss Consideration: Below 23,100 invalidates bullish structure
Daily Chart (Position Trading)
RSI(14): 61.4 showing healthy bullish momentum
MACD: Positive with momentum building
Volume: Consolidation pattern with average participation
Moving Averages: All major MAs (20, 50, 100, 200) aligned bullishly
Position Trading Analysis:
Triangle Pattern: Ascending triangle formation approaching apex
Breakout Targets: 24,500-25,000 on upside resolution
Support Defense: 23,000-23,200 critical for trend continuation
Time Factor: Resolution expected within 2-3 weeks
Weekly Chart (Long-term Analysis)
RSI(14): 65.8 approaching overbought but sustainable
MACD: Strong positive momentum with room for extension
Long-term Trend: Powerful uptrend since 2020 lows intact
Major Resistance: 25,000-25,500 psychological zone
Monthly Chart (Strategic View)
RSI(14): 71.2 significantly overbought (caution warranted)
Long-term Structure: Multi-year cup and handle completion
Secular Target: 28,000-30,000 based on pattern measurement
Major Support: 20,000-21,000 long-term trend support
Comprehensive Support and Resistance Analysis
Primary Support Structure
1. 23,380-23,420: Kijun-sen and VWAP confluence (immediate)
2. 23,300-23,350: Previous consolidation zone with volume
3. 23,200-23,250: Triangle support and trend line confluence
4. 23,100-23,150: Cloud bottom and Fibonacci support
5. 23,000-23,050: Major psychological level and institutional interest
6. 22,800-22,900: Elliott Wave 4 support and harmonic completion
7. 22,500-22,600: Extended support and Gann square level
Primary Resistance Structure
1. 23,450-23,480: Immediate intraday resistance
2. 23,550-23,600: Short-term resistance and previous reaction high
3. 23,700-23,750: Triangle resistance and Gann confluence
4. 23,900-24,000: Intermediate resistance and psychological level
5. 24,200-24,300: Major resistance zone and measured targets
6. 24,500-24,700: Extended targets and harmonic projections
7. 25,000-25,200: Major psychological resistance and long-term targets
Weekly Trading Strategy (September 2-6, 2025)
Monday, September 2, 2025 (Labor Day - US Markets Closed)
Market Environment: Limited trading due to US holiday
Strategy Focus: Pre-positioning for Tuesday's resumed activity
International Markets: Monitor for any overnight developments
Pre-Market Analysis:
Gap Scenarios: Assess any gap formation from Friday's close
Global Sentiment: Monitor Asian and European markets for cues
News Flow: Fed speakers or economic data releases
Tuesday, September 3, 2025
Market Environment: Resumption of full trading after holiday
Primary Strategy: Range trading with breakout preparation
Volatility Expectation: Above average due to holiday catch-up
Intraday Trading Strategy:
Opening Range: 23,350-23,480 expected
Long Setup: 23,380-23,400
- Stop Loss: 23,350
- Target 1: 23,450 (1:2 R/R)
- Target 2: 23,500 (1:3.5 R/R)
Short Setup: 23,460-23,480
- Stop Loss: 23,510
- Target 1: 23,400 (1:1.2 R/R)
- Target 2: 23,350 (1:2.2 R/R)
Key Levels to Watch:
Breakout Above: 23,500 targets 23,600-23,650
Breakdown Below: 23,320 targets 23,250-23,200
Wednesday, September 4, 2025
Market Environment: Mid-week momentum potential
Primary Strategy: Trend following with momentum confirmation
Focus: Economic data and Fed speakers impact
Trading Approach:
Bullish Scenario: Break above 23,500 with volume
- Entry: 23,510-23,530
- Stop: 23,450
- Targets: 23,600, 23,700, 23,800
Bearish Scenario: Break below 23,300 with momentum
- Entry: 23,290-23,270
- Stop: 23,330
- Targets: 23,200, 23,100, 23,000
Risk Management: Reduce position sizes by 30% if range-bound continues
Thursday, September 5, 2025
Market Environment: Potential high-volatility day
Primary Strategy: Breakout trading with volume confirmation
Critical Factor: Triangle pattern resolution expected
Triangle Breakout Strategy:
Upside Breakout: Above 23,650
- Volume Requirement: 150% of 20-day average
- Initial Target: 23,800-23,850
- Extended Target: 24,000-24,200
- Stop Loss: 23,550
Downside Breakdown: Below 23,200
- Volume Requirement: 130% of 20-day average
- Initial Target: 23,000-22,950
- Extended Target: 22,800-22,700
- Stop Loss: 23,280
Position Management:
- Scale into positions on confirmed breakouts
- Trail stops aggressively after first target achieved
- Monitor sector rotation for continuation signals
Friday, September 6, 2025
Market Environment: Week-end positioning and profit-taking
Primary Strategy: Consolidation trading and weekly close analysis
Focus: Jobs data potential and weekly settlement
End-of-Week Strategy:
Weekly Close Bullish: Above 23,500 sets up next week advance
Weekly Close Neutral: 23,300-23,500 maintains current pattern
Weekly Close Bearish: Below 23,300 suggests pattern failure
Day Trading Approach:
Morning Session: Follow Thursday's breakout direction
Midday: Range trading within established boundaries
Final Hour: Position adjustments for weekend risk
Non-Farm Payrolls Impact:
Strong Data: Could delay Fed cuts, potential market negative
Weak Data: Supports Fed cut narrative, likely market positive
In-Line Data: Maintains current rate cut expectations
Advanced Risk Management Framework
Position Sizing Matrix
Risk Allocation by Timeframe:
5M Scalping: 0.25-0.5% of capital per trade
15M Scalping: 0.5-0.75% of capital per trade
1H Day Trading: 1-1.5% of capital per trade
4H Swing Trading: 1.5-2.5% of capital per trade
Daily Position Trading: 2.5-3.5% of capital per trade
Dynamic Stop Loss Framework
Volatility-Adjusted Stops:
Low Volatility (<1% ATR): Stops at 0.75% of entry
Medium Volatility (1-2% ATR): Stops at 1.25% of entry
High Volatility (>2% ATR): Stops at 2% of entry
Timeframe-Specific Stops:
5-Minute Charts: 40-60 points maximum
15-Minute Charts: 80-120 points maximum
1-Hour Charts: 150-250 points maximum
4-Hour Charts: 300-450 points maximum
Daily Charts: 600-900 points maximum
Profit-Taking Methodology
Systematic Profit Realization:
First Target (40%): 1:1.5 Risk/Reward ratio
Second Target (35%): 1:2.5 Risk/Reward ratio
Third Target (25%): 1:4+ Risk/Reward ratio
Trailing Implementation: After second target achievement
Maximum Exposure Limits
Daily Risk Limits:
Total Portfolio: Maximum 5% risk across all positions
Single Strategy: Maximum 3% risk concentration
Sector Concentration: Maximum 40% in tech-related trades
Emergency Stop: -2% daily account drawdown triggers cessation
Geopolitical and Economic Risk Assessment
Federal Reserve Policy Impact
September FOMC Meeting: High probability of 25bp rate cut based on recent communications
Policy Path: Markets pricing 2-3 cuts through end of 2025
Communication Risk: Any hawkish surprises could trigger sharp correction
Independence Concerns: Political pressure on Fed policy creates uncertainty
Economic Data Dependencies
Labor Market: "Unusual" behavior noted by Powell requires monitoring
Inflation Trends: Sticky services inflation remains concern
GDP Growth: Resilience continues but tariff impacts uncertain
Consumer Spending: Holiday season performance critical for Q4
Geopolitical Considerations
Trade Policy: Tariff implementation timeline and magnitude
China Relations: Technology sector exposure to policy changes
Energy Security: Minimal direct impact on NASDAQ constituents
Dollar Dynamics: Strength/weakness affecting multinational earnings
Technology Sector Risks
AI Regulation: Potential oversight affecting major constituents
Semiconductor Cycle: Global chip demand and supply chain risks
Cybersecurity: Increasing threat landscape affecting valuations
Competition: Antitrust scrutiny on major tech platforms
Sectoral Analysis and Rotation Themes
NASDAQ 100 Sector Breakdown
Technology (45%): Apple, Microsoft, NVIDIA, Meta driving performance
Communication Services (15%): Google, Netflix, streaming platforms
Consumer Discretionary (12%): Amazon, Tesla leading components
Healthcare (8%): Biotech and medical device innovation
Other Sectors (20%): Diversified exposure across growth themes
Current Outperformers
1. Artificial Intelligence: NVIDIA, Microsoft, Google benefiting from AI boom
2. Cloud Computing: Amazon Web Services, Microsoft Azure expansion
3. Digital Advertising: Meta, Google capturing online spending shift
4. Electric Vehicles: Tesla maintaining technological leadership
Underperforming Areas
1. Traditional Software: Legacy platforms facing cloud migration pressure
2. Hardware Manufacturers: Margin pressure from supply chain costs
3. Streaming Services: Subscriber growth saturation concerns
4. Biotech: Regulatory approval timelines creating uncertainty
Rotation Indicators
Growth vs Value: Quality growth at reasonable prices favored
Large Cap vs Small Cap: Mega-cap technology leadership maintained
Secular vs Cyclical: Long-term secular themes outperforming cycles
Advanced Pattern Recognition and Trading Setups
Ichimoku-Based Strategies
Cloud Breakout Setup:
Bullish Signal: Price above cloud with Tenkan above Kijun
Entry: Break above 23,450 with volume confirmation
Stop: Below cloud at 23,150
Target: Measured move to 24,200-24,500
Kijun-sen Bounce:
Setup: Price return to Kijun-sen (23,380) with support
Entry: Bounce confirmation above 23,400
Stop: Below 23,350
Target: Previous high resistance at 23,650
Gann-Based Trading Approaches
Square of 9 Methodology:
Long Trades: Buy at 152° (23,104) targeting 154° (23,716)
Short Trades: Sell at 154° (23,716) targeting 152° (23,104)
Breakout Trades: Above 154° targets 155° (24,025)
Time Cycle Trading:
Major Turns: September 21 equinox reversal window
Minor Cycles: 90-degree angles creating intraweek pivots
Momentum Confirmation: Volume spikes during cycle completions
Wyckoff Accumulation/Distribution
Phase D Characteristics:
Testing Supply: Price probing resistance without heavy volume
Institutional Activity: Large lot accumulation on weakness
Markup Preparation: Successful tests lead to significant advances
Distribution Warning Signs:
Climactic Volume: Heavy selling on any approach to 25,000
Weakness Signs: Unable to hold gains on good news
Phase A Risk: Sharp reversal from resistance levels
Market Microstructure and Execution Considerations
High-Frequency Trading Impact
Algorithm Activity Zones:
23,000 Level: Heavy HFT support algorithm activity
23,500 Level: Resistance algorithm concentration
24,000 Level: Major psychological algorithm participation
Optimal Execution Windows:
9:30-10:00 EST: Maximum volatility and opportunity
11:00-11:30 EST: Mid-morning momentum continuation
14:30-15:00 EST: European close overlap activity
15:30-16:00 EST: Final hour positioning
Liquidity Considerations
High Liquidity Zones: 23,300-23,500 range with tight spreads
Reduced Liquidity: Above 24,000 and below 23,000 requiring careful sizing
After-Hours Trading: Limited liquidity requiring smaller position sizes
Order Flow Analysis
Institutional Patterns:
Accumulation: Evidence of large block buying 23,200-23,400
Distribution Zones: Monitor for heavy selling above 23,700
Momentum Algorithms: Active participation on breakout moves
Technology Integration and Trading Tools
Essential Trading Platforms
1. TradingView: Comprehensive charting with advanced indicators
2. Think or Swim: Professional-grade execution and analysis
3. Interactive Brokers: Direct market access and low commissions
4. Bloomberg Terminal: Institutional-grade data and news flow
Critical Alert Systems
Price-Based Alerts:
- Triangle breakout: 23,650 (bullish) / 23,200 (bearish)
- Psychological levels: 23,500, 24,000, 24,500
- Gann squares: 23,104, 23,716, 24,025
Volume-Based Alerts:
- Unusual volume spikes (>200% of 20-day average)
- Block trade notifications (>$10M trades)
- Dark pool activity indicators
News and Event Alerts:
- Fed speaker comments and policy communications
- Economic data releases (employment, inflation, GDP)
- Earnings announcements from major NASDAQ constituents
- Geopolitical developments affecting technology sector
Advanced Analysis Tools
Options Flow: Monitor unusual options activity for directional clues
Futures Positioning: Track institutional positioning in NQ futures
Sector Rotation: Monitor NASDAQ sector ETF performance relative to index
International Correlation: Track correlation with technology indices globally
Seasonal and Calendar Considerations
September Seasonality
Historical data shows September as traditionally weak month for equities, though technology sectors often show resilience. Current rate cut optimism may override seasonal weakness.
Federal Reserve Calendar
September 17-18: FOMC Meeting (high probability of rate cut)
October 29-30: Next FOMC Meeting
December 17-18: Final 2025 FOMC Meeting
Earnings Season Timeline
Q3 2025 Reporting: October-November period critical for NASDAQ constituents
Key Companies: Apple, Microsoft, NVIDIA, Google, Amazon reporting impact
Guidance Focus: AI spending, cloud growth, consumer demand trends
Holiday Impact Calendar
Labor Day (Sep 2): US markets closed
Columbus Day (Oct 14): Bond markets closed, equities open
Thanksgiving (Nov 27-28): Shortened trading sessions
Christmas/New Year: Year-end positioning effects
Conclusion and Strategic Outlook
The NASDAQ-100 stands at a critical inflection point, benefiting from Fed Chair Powell's dovish pivot while facing elevated valuation concerns and seasonal headwinds. The technical picture presents a compelling consolidation pattern with multiple breakout scenarios, requiring careful risk management and tactical positioning.
Key Investment Themes for September:
1. Fed Policy Pivot: Rate cut cycle beginning supports risk assets and growth stocks
2. AI Revolution Continuation: Technology leadership themes remain intact
3. Triangle Resolution: Current consolidation pattern approaching decision point
4. Seasonal Navigation: September weakness vs. Fed optimism dynamic
Tactical Trading Priorities:
Range Trading: Capitalize on 23,300-23,650 range until breakout
Breakout Preparation: Position for triangle resolution with volume confirmation
Risk Management: Elevated levels require disciplined position sizing
Sector Selection: Focus on AI beneficiaries and Fed-sensitive growth names
Medium-Term Outlook (1-3 Months):
The combination of Fed policy accommodation, robust AI/technology themes, and strong corporate fundamentals provides a constructive backdrop for NASDAQ advancement. Technical analysis suggests potential for significant upside toward 24,500-25,000 on successful breakout, though any hawkish Fed surprise or geopolitical shock could trigger sharp corrections.
Risk Scenario Analysis:
Bull Case: Fed cuts + AI momentum = targets 25,000-26,000
Base Case: Consolidation 23,000-24,000 through October
Bear Case: Fed disappointment + valuation concerns = correction to 21,500-22,000
Strategic Positioning Recommendations:
1. Maintain tactical long bias with disciplined risk management
2. Focus on high-quality technology leaders with AI exposure
3. Prepare for increased volatility around Fed meetings and earnings
4. Monitor triangle pattern resolution for significant directional moves
The multi-timeframe technical analysis framework presented provides robust tools for navigating the current market environment. Success will depend on maintaining discipline around the identified support/resistance levels while adapting to the evolving Fed policy landscape and technology sector dynamics.
Traders should remain flexible and prepared for both continuation and reversal scenarios, with particular attention to volume confirmation on any major breakout attempts. The convergence of technical patterns, fundamental catalysts, and seasonal factors creates a complex but opportunity-rich environment for skilled practitioners.
---
*This comprehensive analysis integrates multiple technical methodologies with current market fundamentals. All trading recommendations should be implemented within individual risk tolerance parameters and adapted to evolving market conditions. The technology-focused nature of the NASDAQ requires particular attention to sector-specific developments and regulatory considerations.*
---
For individuals seeking to enhance their trading abilities based on the analyses provided, I recommend exploring the mentoring program offered by Shunya Trade. (Website: shunya dot trade)
I would appreciate your feedback on this analysis, as it will serve as a valuable resource for future endeavors.
Sincerely,
Shunya.Trade
Website: shunya dot trade
---
Disclaimer: This post is intended solely for educational purposes and does not constitute investment advice, financial advice, or trading recommendations. The views expressed herein are derived from technical analysis and are shared for informational purposes only. The stock market inherently carries risks, including the potential for capital loss. Therefore, readers are strongly advised to exercise prudent judgment before making any investment decisions. We assume no liability for any actions taken based on this content. For personalized guidance, it is recommended to consult a certified financial advisor.
NASDAQ Index Analysis (US100 / NASDAQ)At today’s market open, the index tested the 23,320 support level, with a higher probability of retesting the 23,180 area before bouncing upward.
🔻 Bearish Scenario:
If the price breaks below 23,320 and holds beneath it, the index is likely to test 23,180.
🔺 Bullish Scenario:
If the price rebounds and breaks above 23,500, holding higher, this could support a continuation towards 23,620 as an initial target, followed by 23,700.
NAS100 - Trade Setup📊 NAS100USD – Multi-Timeframe Outlook
🔎 Monthly (1M)
Price moving inside a bullish wedge structure, with resistance tested near 25,200.
Support trendline holding firm, confirming strong macro bullish pressure.
Larger structure suggests Wave (5) still has room to expand toward 26,000+ if demand zones continue to hold.
🕰 Weekly (1W)
Elliott count clear: (1) → (2) → (3) extended, now correcting into (4).
Demand/FVG zones around 20,400 – 21,000 remain the critical swing support.
Next wave (5) projection aims at 25,000 – 26,000.
⏱ Daily (1D)
Structure consolidating within daily support, reacting from demand.
Breakout above 23,900 – 24,000 reactivates bullish impulse.
Invalidation lies below 22,950, where daily demand would fail.
⏳ 4H
Clear corrective retracement into daily demand (23,200 zone).
Long setup forming:
Entry: 23,222
Stop: 22,942
Target: 23,989
R:R ≈ 2.75
Short-term price action likely resolves higher into Wave (5) unless invalidation breaks.
🎯 Trade Plan
Bias: Bullish continuation into Wave (5)
Entry Zone: 23,200 – 23,300 (daily demand)
Targets: 23,989 (short-term), 25,200 – 26,000 (swing)
Invalidation: Daily close below 22,950
