NAS100 SELL 15 MINUTE TIMEFRAMESTRONG SUPPLY ZONE Fair value gaps to fill Amazing Range 3:1 Risk Reward, Let's See!
USTECH100CFD trade ideas

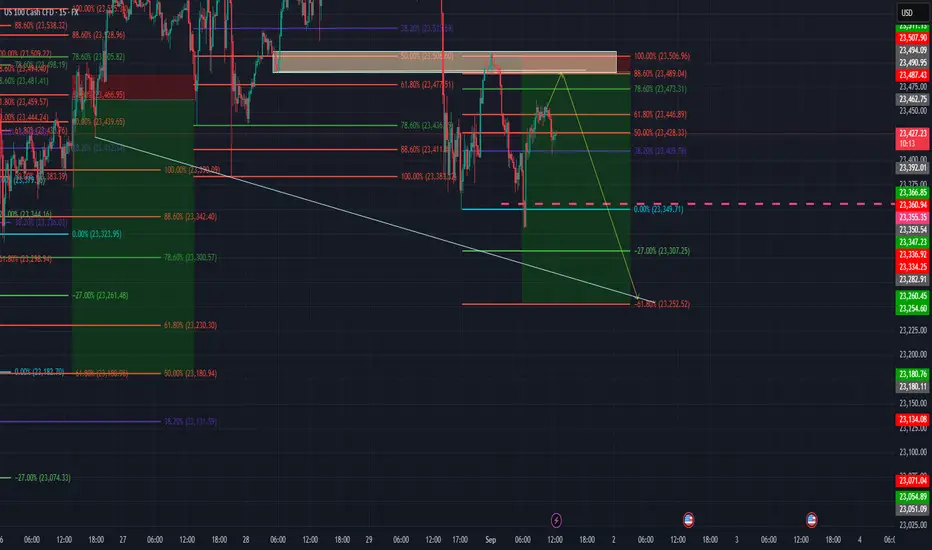
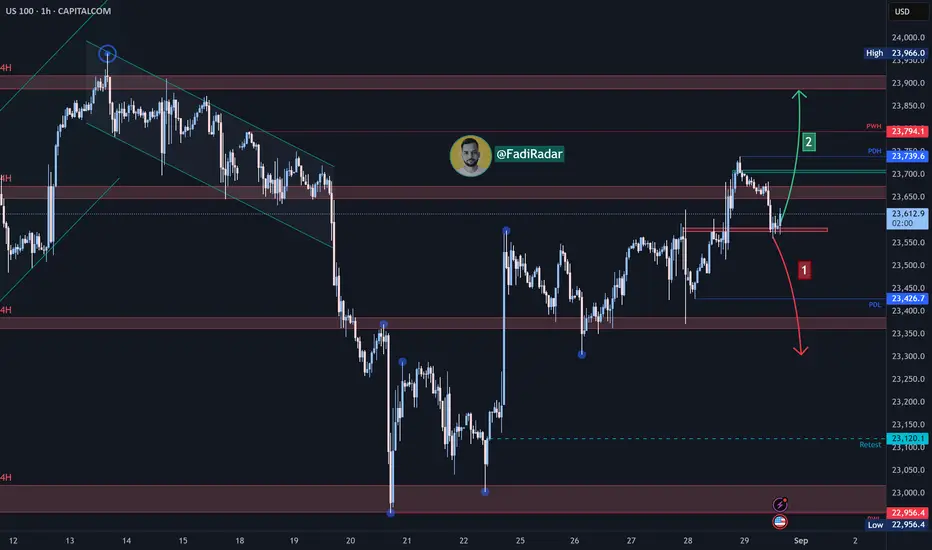
US 100 shortEntry: 23450
Stop Loss: above 1h Trendline: 23550
Target: just above 127 fibo level at 23208
Price clearly rejected from the 23,500 level.
Now I’m expecting a lower high (LH) followed by a lower low (LL) setup.

NAS100USD – Holding 23,350 Support, Eyeing 23,700The Nasdaq 100 found demand at the 23,350 support zone, holding the level after recent downside pressure. Price is now consolidating, with bulls looking for a potential push back toward the 23,700 resistance zone.
Support at: 23,350 / 23,100 🔽
Resistance at: 23,700 / 23,880 🔼
🔎 Bias:
🔼 Bullish: A sustained hold above 23,350 could fuel momentum toward 23,700.
🔽 Bearish: A breakdown below 23,350 exposes 23,100 as the next key support.
📛 Disclaimer: This is not financial advice. Trade at your own risk.

Nas100 Trade Set Up Sep 1 2025FX:NAS100
www.tradingview.com
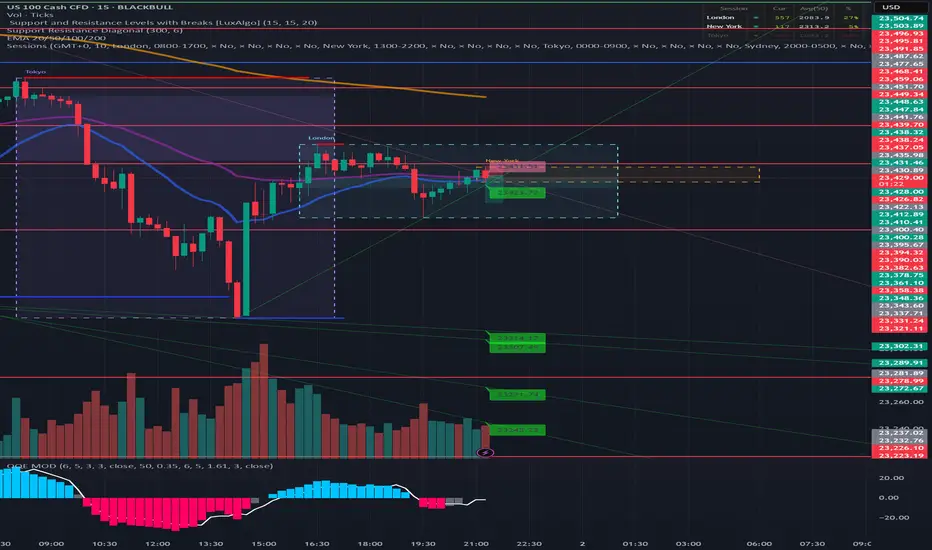
Price has made LH/LL and has respected a 1h FVG so id like to see price continue lower to take out SSL

scalping this. didn't break higher high, we usa just found a new high, likely will try to find a new low first.
Slight push up - before a drop on NAS100A point of confluence to first be re-tested, before she'll drop.
I'm pretty confident that we'll see this move play out today... let's see what she does.

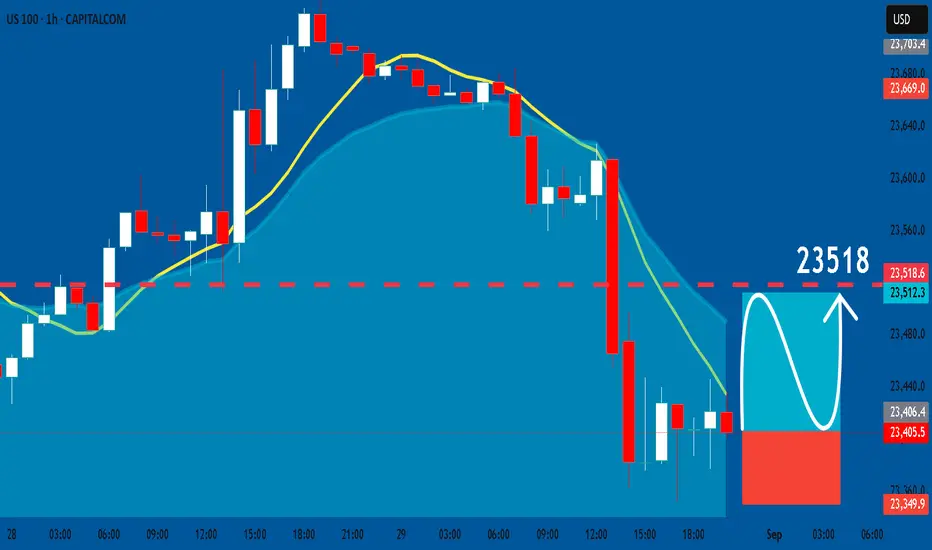
US100: Bullish Continuation & Long Trade
US100
- Classic bullish formation
- Our team expects growth
SUGGESTED TRADE:
Swing Trade
Buy US100
Entry Level - 23405
Sl - 23349
Tp - 23518
Our Risk - 1%
Start protection of your profits from lower levels
Disclosure: I am part of Trade Nation's Influencer program and receive a monthly fee for using their TradingView charts in my analysis.
❤️ Please, support our work with like & comment! ❤️
Technical and digital analysisWe notice the emergence of selling force while there is weakness in buying momentum and we notice the formation of a major correction to the decline.
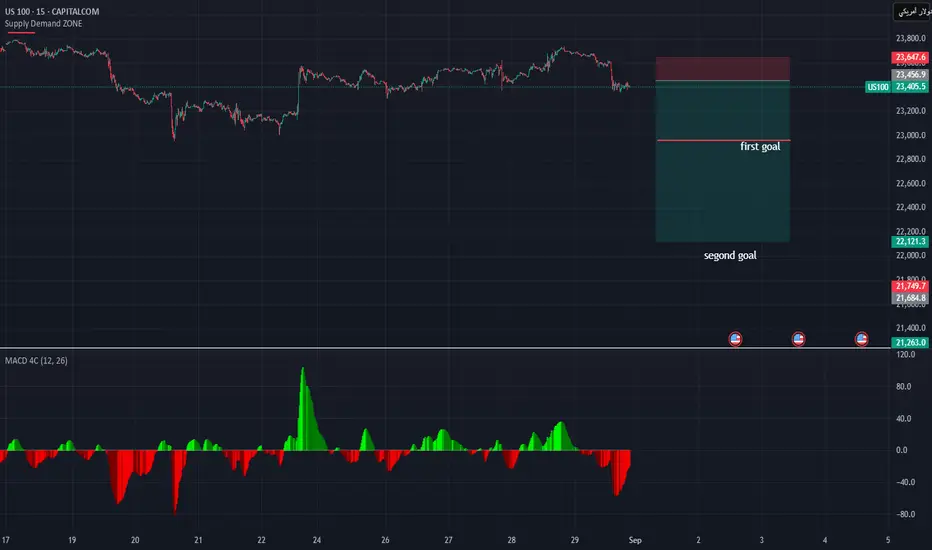
NAS100 4HTrading Outlook for Major Currency Pairs and Indices, Especially Gold and Silver, in the Upcoming Week
In this series of analyses, we have reviewed short-term trading perspectives and market outlooks.
As can be seen, each analysis highlights a key support or resistance area near the current price of the asset. The market’s reaction to or break of these levels will determine the subsequent price trend up to the next specified levels.
Important Note: The purpose of these trading outlooks is to identify key price levels and potential market reactions, and the analyses provided should not be considered as trading signals.

Nasdaq Pulls Back from Recent HighsToward the end of the week, the Nasdaq index began to retreat, posting a decline of at least 1.5% in the short term, as a new bearish bias has started to emerge strongly, preventing the index from reaching the historical highs again. For now, the momentum driven by expectations of lower interest rates has begun to fade in recent sessions, while corrections in stocks such as Nvidia—which represent a significant share of the index’s market capitalization—have limited buying pressure heading into the week’s close. Given this backdrop, as the market awaits key economic data, such as the upcoming U.S. employment report on Friday, uncertainty and sideways movements may continue to dominate trading sessions in the near term.
Short-Term Sideways Range
The lack of clear direction in recent movements has led to the formation of a sideways range in the Nasdaq, currently defined by resistance at 23,800 points and support at 22,800 points. As long as price action remains within these levels, neutrality will likely remain the prevailing scenario in the short term.
Technical Indicators
RSI: the RSI line is oscillating near the neutral 50 level, reflecting a consistent balance between buying and selling pressure over the past 14 sessions. This suggests that the neutral bias has begun to dominate short-term movements in the index.
MACD: the MACD histogram also hovers close to the 0 line, showing that short-term moving averages maintain a neutral bias. As long as this condition holds, the current sideways range is likely to remain relevant in upcoming sessions.
Key Levels to Watch:
23,800 points – Main Resistance: corresponds to recent highs in the Nasdaq. A sustained breakout above this level could open the door to a more consistent bullish trend in the short term.
22,800 points – Near-Term Support: aligns with the Ichimoku cloud and stands as the most important barrier for containing short-term downward corrections.
22,200 points – Critical Support: coincides with neutral price areas observed on the chart in February of this year and is also converging with the 200-period moving average. If this level comes under consistent pressure, it could pave the way for a more dominant bearish bias.
Written by Julian Pineda, CFA – Market Analyst

Nas100 1500 Pips SecuredFX:NAS100
www.tradingview.com
price retested 4h IFVG, formed 1m and 5m FVG after 9:30, target PDL


Nas100 Trade Set Up Aug 29 2025FX:NAS100
www.tradingview.com
Price has inverted a 4h fvg and swept a daily BSL yesterday so i will be looking for sells once internal buy side liquidity on the 15m is swept followed by a 1m IFVG to target SSL and PDL

NASDAQ Index Analysis (US100 / NASDAQ)The index is testing the 23,550 level as a key support, with the overall trend remaining bullish, including on the hourly timeframe.
🔻 Bearish Scenario:
If the price breaks below 23,550 and holds, it is likely to move toward 23,350.
🔺 Bullish Scenario:
If the price rebounds from 23,550 and holds above it, this could support further upside toward 23,700 as an initial target, followed by 23,850.
Bullish momentum to extend?US100 is falling towards the support level, which is an overlap support that aligns with the 23.6% Fibonacci retracement and could bounce from this level to pir tale prpft.
Entry: 23,546.52
Why we like it:
There is an overlap support level which aligns with the 23.6% Fibonacci retracement.
Stop loss: 23,300.44
Why we like it:
There is a pullback support that lines up with the 61.8% Fibonacci retracement.
Take profit: 23,938.06
Why we like it:
There is a swing high resistance.
Enjoying your TradingView experience? Review us!
Please be advised that the information presented on TradingView is provided to Vantage (‘Vantage Global Limited’, ‘we’) by a third-party provider (‘Everest Fortune Group’). Please be reminded that you are solely responsible for the trading decisions on your account. There is a very high degree of risk involved in trading. Any information and/or content is intended entirely for research, educational and informational purposes only and does not constitute investment or consultation advice or investment strategy. The information is not tailored to the investment needs of any specific person and therefore does not involve a consideration of any of the investment objectives, financial situation or needs of any viewer that may receive it. Kindly also note that past performance is not a reliable indicator of future results. Actual results may differ materially from those anticipated in forward-looking or past performance statements. We assume no liability as to the accuracy or completeness of any of the information and/or content provided herein and the Company cannot be held responsible for any omission, mistake nor for any loss or damage including without limitation to any loss of profit which may arise from reliance on any information supplied by Everest Fortune Group.

NAS100 - 1D OutlookDear Friends in Trading,
## CORE PCE TODAY - Be safe!
Giant Bull Flag. - Will require a "Giant Break-Out".
Can yellow confluence area hold a correction test?
The green demand trajectory will be the first trend support.
Keynote:
We close three crucial candles today. 1D + 1W + 1M
I know I'm stating the obvious.
Let's see what September brings.
I sincerely hope my point of view offers a valued insight.
Thank you for taking the time study my analysis.

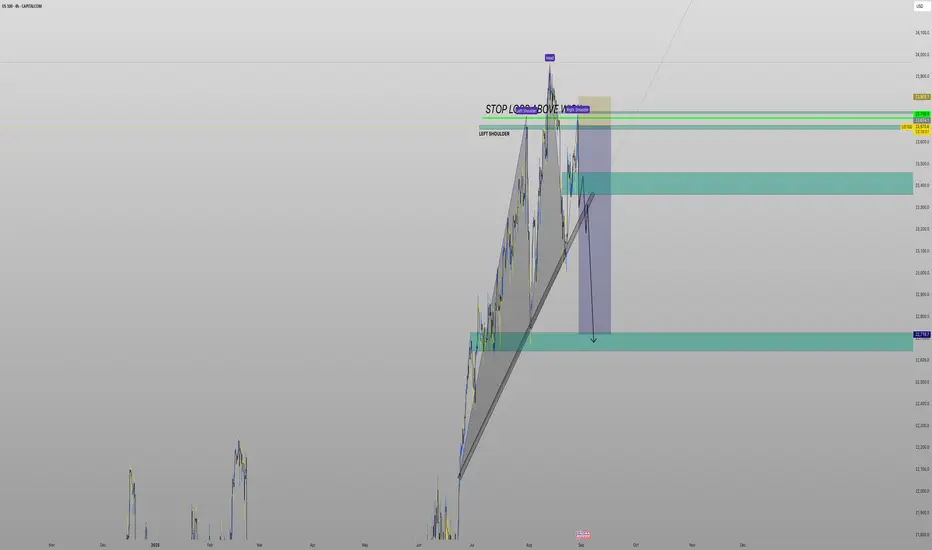
Possible ShortIm seeing Head & Shoulders on the 4hr time frame and I believe it has created a right shoulder to push to the downside
Nasdaq-100 Wave Analysis – 28 August 2025- Nasdaq-100 reversed from support zone
- Likely to rise to resistance level 24000.00
Nasdaq-100 index recently reversed from the support zone between the strong support level 23000.00 (which has been reversing the price from the middle of July), lower daily Bollinger Band and the 38.2% Fibonacci correction of the upward impulse from June.
The upward reversal from this support zone created the daily Japanese candlesticks reversal pattern Hammer – which started the active impulse wave (iii).
Given the strong daily uptrend, Nasdaq-100 index can be expected to rise to the next resistance level 24000.00 (which stopped the earlier impulse wave i).

NAS100 (15M) – Breakout & Continuation SetupThe NAS100 is showing strong bullish momentum on the 15-minute timeframe with Heikin Ashi candles confirming trend strength.
🔹 Structure:
After multiple consolidations and corrections, price formed higher lows (blue lines) and broke out of recent resistance (red zone).
A clean bullish structure with impulsive legs is visible (green trend lines).
🔹 Indicators:
The Alligator lines are opening upward, signaling trend continuation.
RSI is holding above 70, confirming bullish strength (but caution for potential pullback).
🔹 Setup:
Entry near 23,693 – 23,699.
Stop loss below 23,617.
Target around 23,841, giving a favorable risk-to-reward ratio.
📈 Bias: Bullish continuation towards 23,800+ as long as support holds.
📉 A break below 23,617 would invalidate the setup.

us100 on buy till 23810 to sell#US100 we await for breakout 23700 2 times breakout to buy or M30 closure above there.
Possible target 23810-23850, stop loss at 23614.
Above 23810-23850 holds bearish reversal, price will fall till 23584.

US100 – Breakout or a Classic Bull Trap?
The US100 (Nasdaq Index) has recently shown what looks like a breakout on the 4-hour timeframe after a phase of consolidation. On the surface, this can easily be perceived as a bullish continuation. However, a closer look reveals that the breakout might just be setting up for a classic bull trap.
I am currently positioned short on the index with a view that the current move could fail to sustain. The price has entered into my marked supply zone, an area where selling pressure historically outweighs demand. If this zone holds true to its nature, we can see a strong rejection from here.
• LTP (Last Traded Price): 23,690
• Supply Zone: Highlighted on chart
• Downside Target: Around 22,500
The broader structure still suggests that while short-term euphoria pulls prices higher, the underlying momentum may not support sustained gains. If the bulls lose control here, the downside could open up swiftly, validating this thesis.
I’ll be watching how price reacts in this zone closely. For now, I remain short-biased, anticipating a rejection and a move towards the 22,500 mark.

Head and shoulder, right shoulder buildingShorting here, nullifed if it closed above 23800 today.
tp: 22000
NVDIA earning done and selling off now.
Core CPI and PPI have been hot, PCE might come high.
Movement into small cap and spread.
Not financial advice.
