WALLSTREETCFD trade ideas

US30 Pullback Toward 44,600 Within Ongoing UptrendHey Traders, in today's trading session we are monitoring US30 for a buying opportunity around the 44,600 zone. Dow Jones (US30) is trading in an uptrend, with price currently correcting toward this key support/resistance level.
Structure: The broader bias remains bullish, but price is pulling back after recent highs.
Key level in focus: 44,600 — a significant area where buyers may look to step in and continue the upward trend.
Fundamentals: Market sentiment remains broadly supportive for equities, with risk appetite steady as investors weigh U.S. economic data and central bank policy outlook.
Trade safe,
Joe.

SMB - WEEK 2SUNDAY MARKET BREAKDOWN - WEEK 2 of September 2025
Hope you learn one or two. Do like, comment & follow for more content.

US30 - Potential Outcome This WeekDear Friends in Trading,
“I share only my perspective. In this industry, learning never ends, but progress comes when we learn from mistakes without repeating them.” - ANROC
1) BULL trend prevails.
2) Again, price is running towards the same supply liquidity area pre-CPI release.
3) Can it push though this time, supported by alternative fundamental factors?
4) Or will price sweep and fall to respect the supply level yet again?
Keynote:
All levels indicated are liquidity levels.
I sincerely hope my point of view offers a valued insight.
Thank you for taking the time study my analysis.

US30 ShortElite Analysis
I will be patient and wait for price to come back up to my OB (orange rectangle)
I will execute from that price point.
All confirmations have been met, now we wait for the market to come to us
Targeting lower liquidity pools

US30 UPDATE: Pre-Post Potential 4 NFPDear Friends in Trading,
1) NFP Today - Be safe.
2) TIP - Post NFP Mondays: (Applies to all instruments - Forex, Indices & Metals)
-----"ASIA + LONDON SESSION's PRICE ACTION IS BIG AND OPEN MOST OF THE TIME"-----
Keynote:
MARKET STRUCTURE = TREND = INTACT
I have highlighted a few possible support and resistance levels,
and potential targets.
Let me know if anything is unclear?
I sincerely hope my point of view offers a valued insight.
Thank you for taking the time study my analysis.
US30 The Target Is UP! BUY!
My dear followers,
This is my opinion on the US30 next move:
The asset is approaching an important pivot point 45417
Bias - Bullish
Safe Stop Loss - 45314
Technical Indicators: Supper Trend generates a clear long signal while Pivot Point HL is currently determining the overall Bullish trend of the market.
Goal - 45580
About Used Indicators:
For more efficient signals, super-trend is used in combination with other indicators like Pivot Points.
Disclosure: I am part of Trade Nation's Influencer program and receive a monthly fee for using their TradingView charts in my analysis.
———————————
WISH YOU ALL LUCK

US30 | Bearish IndicationsUS30 has formed falling wedge pattern alongwith double top as well as bearish divergence on RSI.These are all very strong indications of bearish reversal.

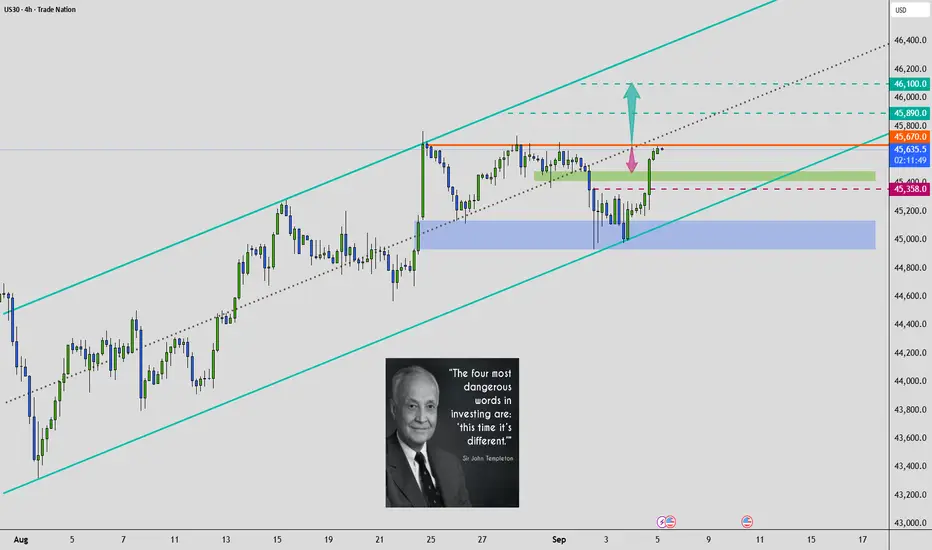
DOW JONES close to a Triangle break-out leading to 47500!Dow Jones (DJI) has been trading within a Channel Up pattern since April 24. Following the August 21 Low, it entered a short-term Ascending Triangle pattern, looking identical to May - June, which also started after a 4H MA50 (blue trend-line) test.
That pattern was a re-Accumulation phase, which after breaking upwards pushed the price just below its 2.5 Fibonacci extension.
With also similar 4H RSI sequences, we expect a similar reaction upon a Triangle break-out, targeting 47500 (Fib 2.5 extension).
-------------------------------------------------------------------------------
** Please LIKE 👍, FOLLOW ✅, SHARE 🙌 and COMMENT ✍ if you enjoy this idea! Also share your ideas and charts in the comments section below! This is best way to keep it relevant, support us, keep the content here free and allow the idea to reach as many people as possible. **
-------------------------------------------------------------------------------
💸💸💸💸💸💸
👇 👇 👇 👇 👇 👇

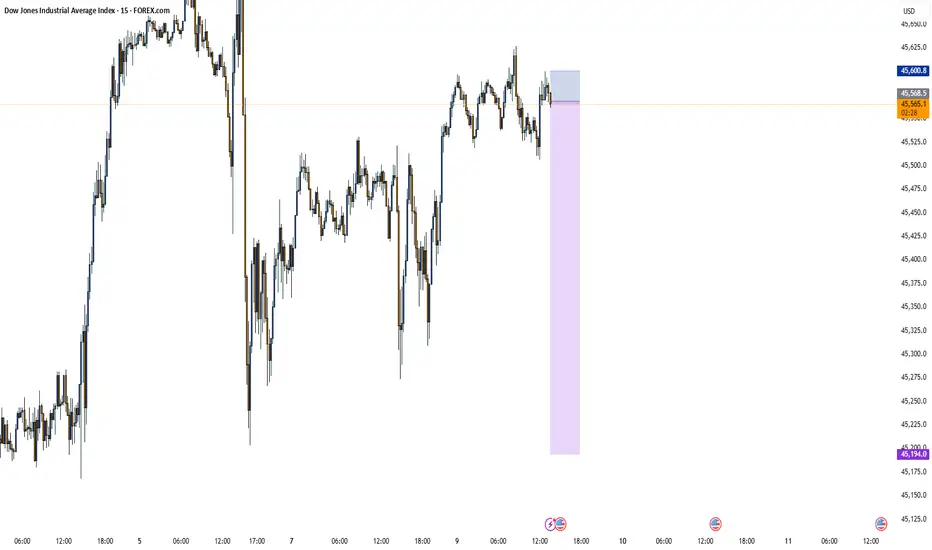
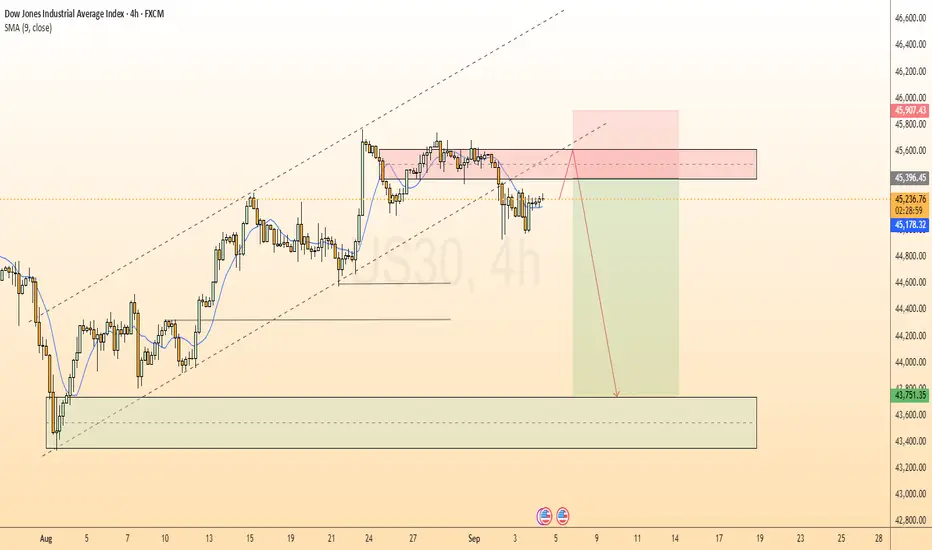
Dow Jones Overextended: Watching for an Institutional Unwind 📊 Dow Jones (US30) remains bullish 🟢, but in my view, it’s looking overextended 📈. Price has traded into a key level 🎯 where we could see a potential pullback, especially as we approach the end of the week 📅, when institutions and big money 💼 may begin unwinding positions.
👀 The play here is to watch for the high of the week/day ⏫ and look for a counter-trend reversal 🔄 that could drive price lower into the weekly close 📉.
⚠️ Keep in mind: Monday’s opening often creates a stop run 🛑 possibly offering a deeper pullback, giving us a double dose of liquidity grabs 💧. This sets the stage for a fairly deep retracement, which could present an opportunity to counter trend short if conditions align 🧩.
📌 My focus is on a break below the current range 🔓 as a trigger for potential entry.
⚠️ This is for educational purposes only and not financial advice 📚

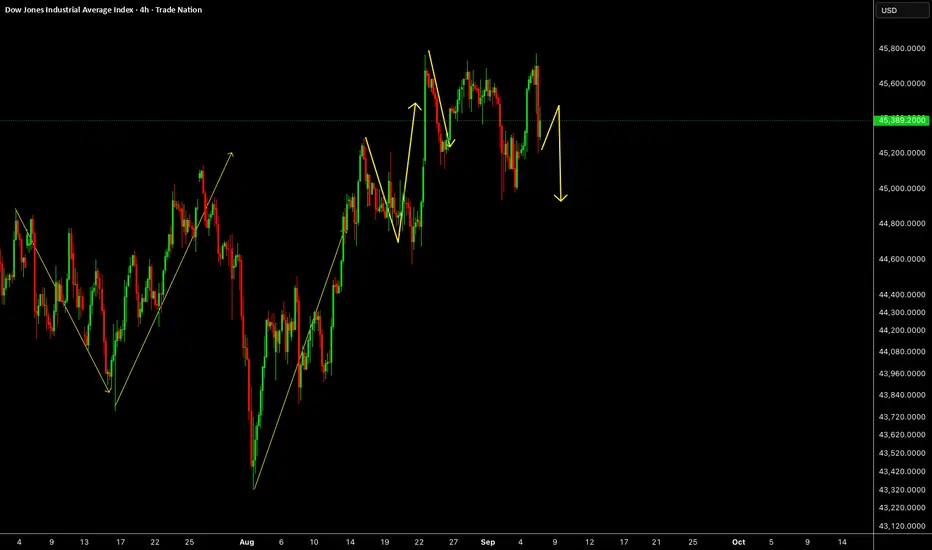
US30US30 has some more downside to complete this bigger correction before any upside.
Disclosure: We are part of Trade Nation's Influencer program and receive a monthly fee for using their TradingView charts in our analysis.
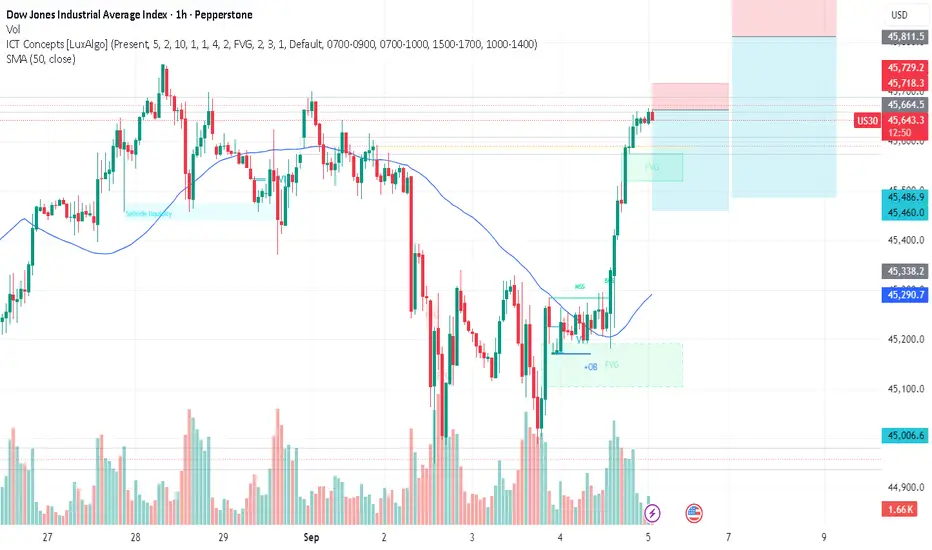
Dow Jones (DJI) – 1H Technical OutlookDow Jones (DJI) – 1H Technical Outlook
Bias: Bearish while below 45,450.
Key Resistance: 45,350 – 45,450 (failure to break above keeps sellers in control).
Immediate Supports:
45,100
44,980 – 44,860
Major support at 44,700
📉 Primary Scenario:
If price remains capped below 45,450, a downward move towards 44,700 is likely after a minor corrective bounce.
📈 Alternative Scenario:
A breakout and sustained close above 45,500 would invalidate the bearish view and open the door for a rally towards 45,800 – 46,000.

US30 H6 | Market OutlookPotential for a bearish pullback on the US30 H6 which could lead to a price movement towards the support level at 44.500. SELL levels from 45.520

DOW/US30 - BEST STRATEGY OF THE YEAR - LETS GOTeam, carefully plan for tonight on NON FARM PAYROLL
HERE IS THE DATA
Weekly jobless claims increase 8,000 to 237,000
Continuing claims fall 4,000 to 1.940 million
Private payrolls increase 54,000 in August
Trade deficit widens 32.5% to $78.3 billion in July
Last month, the same day, market drop for two days over 1000 points.
PLEASE CAREFULLY structure this - DO SMALL VOLUME FOR THIS ONLY
Short now at 45645-45655 - I think the market look EXHAUSTED
STOP LOSS tight at 45680 or give more room at 45720
Target 1 at 45525-45500 - take 60%-70% partial and bring stop loss to BE
Target 2 at 45425-45380
OR WAIT FOR THIS ZONE TO KILL THE MARKET - 45800-45900 - stop loss at 46050
Target 1 - 45650 -45620
Target 2 - 45550-45520
LETS GO
US30 Resistance Ahead!
HI,Traders !
#US30 keeps growing
In an uptrend but the
Index will soon hit the
Horizontal resistance
Of 45700.0 from where
We will be expecting a
Local bearish correction !
Comment and subscribe to help us grow !

Dow Jones Outlook: Bullish Above 45,465, Bears Eye 45,285US30 – Overview
The Dow Jones recorded a new ATH on Friday and has since retested and stabilized above 45,465.
Technical Outlook:
📈 As long as price holds above 45,465 (pivot), bullish momentum is expected to continue toward 45,680 → 45,860.
📉 A confirmed stabilization below 45,410 would shift momentum bearish, targeting 45,285 → 45,110.
Key Levels:
Pivot: 45,465
Resistance: 45,680 – 45,860
Support: 45,285 – 45,110

US30 UpdateNext move on the way, focus on proper risk management & stay disciplined. Wishing you successful trades...!
Confluences And Key Reason:
1. Price creates bullish channel.
2. Market price break bullish channel toward downside.
3. Fresh supply + order flow still in pending.
4. If this supply is valid than we see price further move downside.
This is not a financial advice take it with your own risk. In this case confirmation is very important. If price give confirmation than we open our trades. Let's see how it will work.
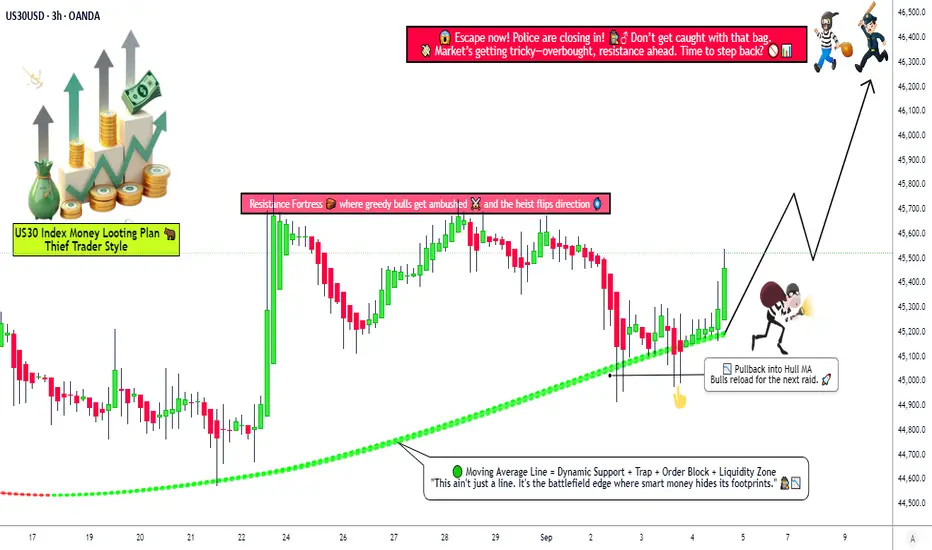
Dow Jones Bullish Strategy! Can the Market Break Higher?🚀 US30 Index Money-Making Plan (Swing / Day Trade) 📊
🧠 Trading Plan & Strategy (Thief Layer Style)
🚀 Approach: Bullish Hull Moving Average pullback plan — “bulls reloaded” for the next wave.
🎯 Entry (Layering Strategy): Multiple buy-limit layers → 45,200 • 45,300 • 45,400 • 45,500 (flexible to add more based on your own plan).
🛡️ Stop Loss: Reference point at 45,000. Adjust SL responsibly to match your personal risk tolerance & style.
💰 Target: Potential resistance zone (the “police barricade”) sits near 46,300. That’s where traders may consider taking profits.
📢 Note: This is an illustrative plan based on technicals — every trader should adapt TP/SL to their own strategy and risk appetite.
📊 US30 Market Report – September 4, 2025
📈 Current Price Snapshot
Trading near 45,000 points, up 0.05% today.
Strong monthly performance (+2.4%) and robust yearly gains (+17%).
Market showing resilience despite trade tensions.
😊 Retail Traders’ Sentiment
60% long vs 40% short → Tilted bullish.
Optimism driven by hopes for earnings growth & Fed rate cuts.
Caution remains due to tariff risks.
🏦 Institutional Traders’ Outlook
Cautiously bullish positioning.
Demand for equities continues, but with moderated exposure.
Buybacks + foreign inflows supporting price action.
🌡️ Overall Investor Mood
Neutral to positive tone.
Economic resilience balanced against policy uncertainty.
Healthy breadth across sectors, not just tech.
😨 Fear & Greed Index
Currently at 52 (Neutral).
Suggests balance — no extremes dominating.
Neutral setups often precede steady gains.
💹 Fundamental Score → 8/10
Strong corporate earnings (+12–13% growth projected next year).
Balance sheets remain solid.
AI & tech themes boosting key components.
Tariffs still a drag, but diversified exposure helps.
🌍 Macro Score → 7/10
US GDP growth cooling to 1.5%, but global rebound supports outlook.
Inflation ~2.9%; Fed rate cuts expected later.
Labor market stable, policy clarity could add upside.
🐂 Overall Market Outlook: Bullish Bias 📈
If support at 45,000 holds, potential move higher toward 46,000+.
Drivers: Strong earnings, Fed easing, broad rally.
Watch: Trade news headlines remain a key risk factor.
🔎 Why This Plan?
Hull MA pullback indicates momentum continuation.
Layered entries provide flexibility & better risk distribution.
Market sentiment + fundamentals align with bullish bias.
Resistance at 46,300 offers a clear take-profit zone.
📌 Related Pairs to Watch
CAPITALCOM:US30
FOREXCOM:SPX500
EIGHTCAP:NDQ100
TVC:VIX
TVC:DXY
✨ “If you find value in my analysis, a 👍 and 🚀 boost is much appreciated — it helps me share more setups with the community!”
#US30 #DowJones #Indices #SwingTrading #DayTrading #TechnicalAnalysis #StockMarket #TradingPlan #HullMA #LayeringStrategy
US30 Strategy: Sideways Range, Liquidity Run, and Entry Zones📊 Dow Jones (US30) Update 📊
The Dow Jones (US30) is currently bullish 🟢📈 and pushing higher on the 4H timeframe ⏰. We can see a value area forming 🏦, with price ranging sideways 🔄 and building liquidity above and below the range 💧.
My plan is to watch for a potential liquidity run above the range 🚀, followed by a deep pullback 🔽 that could present a high-probability entry opportunity 🎯.
⚠️ This outlook is for educational purposes only and not financial advice. 📚

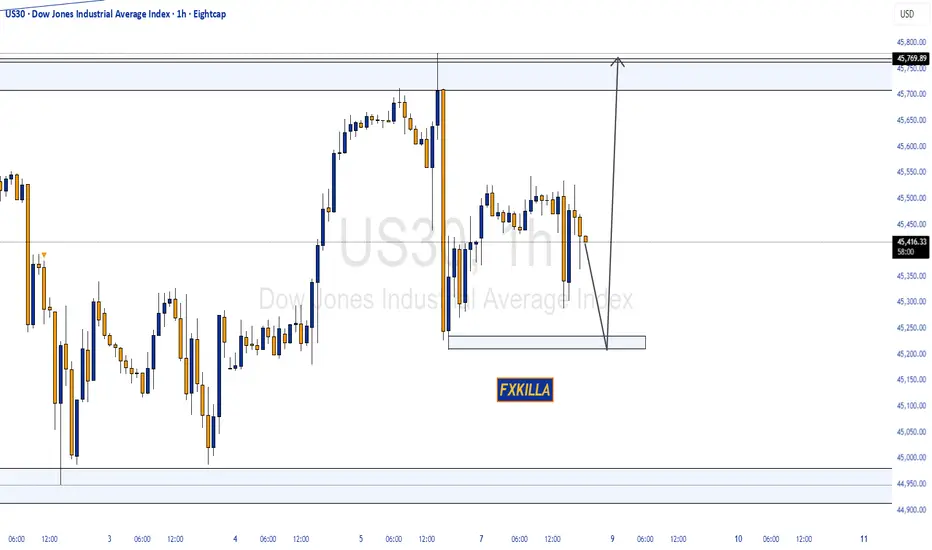
DOW JONES HIGH PROBABILITY SETUP SOON!!!🚨 US30 HIGH PROBABILITY SELL/BUY SETUP 🚨
* Here We Can See Clearly The Next Potential Moves For US30 Coming Hours/Days.
* Keep Your Eyes Close On Your Trading Positions.
* Happy PIP Hunting Traders.
FXKILLA.
DowJones Resistance retest at 45800Key Support and Resistance Levels
Resistance Level 1: 45800
Resistance Level 2: 46000
Resistance Level 3: 46200
Support Level 1: 45190
Support Level 2: 44960
Support Level 3: 44720
This communication is for informational purposes only and should not be viewed as any form of recommendation as to a particular course of action or as investment advice. It is not intended as an offer or solicitation for the purchase or sale of any financial instrument or as an official confirmation of any transaction. Opinions, estimates and assumptions expressed herein are made as of the date of this communication and are subject to change without notice. This communication has been prepared based upon information, including market prices, data and other information, believed to be reliable; however, Trade Nation does not warrant its completeness or accuracy. All market prices and market data contained in or attached to this communication are indicative and subject to change without notice.

US30 on bullish Us30 had confirmed high possibility of buy by supporting with a bullish engulfer and a double bottom on rsi with H4 timeframe
