WALLSTREETCFD trade ideas

US30 WE ARE DONE, WHAT'S NEXT!Hello Traders and everyone, I am Hadi Karaali, Known as SNIPERS_FX
If you like the idea, do not forget to support with a like and follow.
US30 WE ARE DONE, WHAT'S NEXT! 📚
👉As we mentioned in our previous analysis attached on the chart, Price rejected our massive rejection zone 40k and supply as well. Specially after breaking below the marked swing low.
👉Moreover, price is approaching a nice-looking support zone, lining up with our previous swing highs and lows, where we will be looking for new longs on lower time frame to confirm a new bullish movement, as the price is still overall bullish from a medium term perspective.
Unless price managed to break below our marked zone, then a movement lower would be expected, till the next demand zone, Where we will be again looking for new longs as well. 📚
If you like this kind of analysis don't forget to like and follow
and as usual follow your trading plan and manage your risk.
Be patient and good luck!

Bullish Dow JonesUS30 been bearish for bout 1 week and half, Price now reaching a bullish key level. We are goin to monitor price action on low timeframe and waiting for bulls to kick in.

NEW IDEA FOR DOWJONES The increase in the Dow Jones index due to the increase in profits from the income of companies
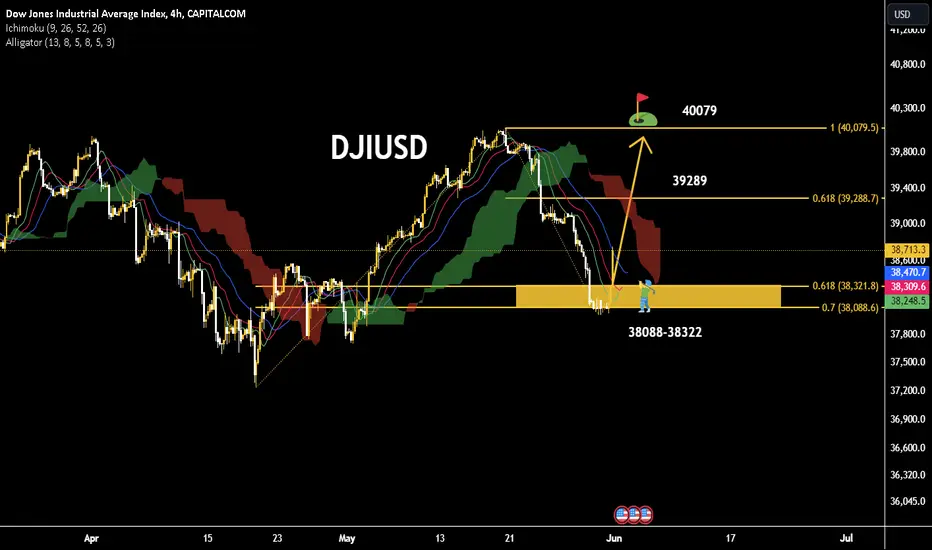
By examining the trend in the four-hour time frame, the Dow Jones index, having an important support interval in the range of 38,322-38,088, can increase to the previous ceiling resistance in the range of 40,079, in the meantime, the 61.8% Fibo resistance will be seen at 39,289.
Us30 long Us30 looking for correction buy momentum...still in bearish trend but correction needed at this moment... this long entry is important for trend continuation

$DJIA M pattern June 2024Dily chart is forming M pattern... A drop is due if the Neck Line is broken..

DJI will go up after a short correction to 36,000During the pandemic the DJIA has a big fall from 29,687 to about 18,200.
The Dow just hit 39,000 which is a key Fibonacci level, ( it is 61% above 29,687 when measuring from 18,200).
At this point the Dow will correct to about 36,000. This is about 61% below the a wave from the b wave.
From there the dow will go to about 43,000, completing a 5 wave structure in the monthly chart and a set up for a possible major correction in the coming months.

Good analysis and advice may make you moneyHello, guys
The increase in the Dow Jones index due to the increase in profits from the income of companies
By examining the trend in the four-hour time frame, the Dow Jones index, having an important support interval in the range of 38,322-38,088, can increase to the previous ceiling resistance in the range of 40,079, in the meantime, the 61.8% Fibo resistance will be seen at 39,289.

Today's analysis and strategies will help youHello traders
1. US30 on support level.
2. Chances are high for long from this level.
3. once its broken below short we can expect a short un till its long.
Daily sharing of reliable signals and advice can help you, follow me if needed


Hellena | DJI (4H): Short to the support area 37616.32.Dear colleagues, having reviewed the waves I assume that now the price is in a big correction and I expect that the price will continue downward movement to the support area 37616.32 (completion of the wave “C”). Before that a small correction to the resistance area 38978.81 is possible.
Manage your capital correctly and competently! Only enter trades based on reliable patterns!


US30 possible long for 38970accumulation phase around 38150-38800 in 1 hour time frame. demand zone for long 38150-38080, stop loss: 37990, target: 39970

Short from PremiumsDear Traders,
This is my bias for US30. As we can see that us30 is falling from the top forming double top around 40000 psychological number. I am sharing two ideas as per my analysis. shorting from premium or waiting till it grabs buy side liquidity at premium extreme and falling hard. Bearish momentum is still in consideration as monthly closing pushed market higher. i still think that it can fall up to 37500-37700 area. All the best. This is just an idea. Do not take this as any trading signal. Consider Risk management!!!!

US30, wave 5 should start now towards 42kLooking at US30 we have a high probability of turning into bullish again.
RSI long signal
Strong daily support
Bullish Engulfing candle
Possible wave 4 low
I expect new ATH to be build soon

US30 Bullish Outlook: Key Targets and Order Flow InsightsGreetings, Traders!
Brief Description🖊️:
At the moment, I am expecting a bullish switch in institutional order flow for US30, which will push the price upwards. The price originates from a daily bullish order block, and I am looking for this to support the price, leading to a bullish draw upon confirmation.
Things I Have Seen👀:
Bullish Support Zone📈: The price is currently supported by a daily bullish order block, indicating a potential upward movement. Price may also look to respect the rejection block and use that as a support to continue the bullish narrative.
Engineered Liquidity🔄: Along the way, my anticipation is to absorb all the engineered trendline liquidity that has been presented.
Bullish Targets📉:
H1 Bearish Order Block: The primary target for this bullish move.
What's Important Now❗
To confirm the anticipated bullish draw, we need to observe the price action and look for supportive signals at the daily bullish order block. Stay tuned for real-time developments and further insights.
Kind Regards,
The_Architect

US30 Short positionHigher timeframes are showing a bearish momentum. the 2H timeframe has been n consolidation.

US30 - MON 3 JUNE 24 - TRADE SETUPPrice manipulation to the downside.
The market is likely to deliver to the upside.
Business Data


Big Movements to the upside.After a bearish landslide of a week, DJ will be looking to correct itself. Expect the bulls to make a massive upclimb. Especially after the PDH has been crushed. I keep it simple, block out the noice. Trade my zones and watch the movement explore. Peace traders $

possibility of uptrend It is expected that the downward trend will end in the current support range and we will see the beginning of the upward trend.
According to the behavior of the indicator, possible scenarios have been identified

[Early Warning] Dow Jones showing weakness, will dip furtherTVC:DJI has formed 5 waves down in daily timeframe. Unless this 5 wave structure turn into a 7 or 11 wave (counter-trend) formation, this is likely a beginning of short term down-trend.
Now, this down trend could play out in different ways, 2 of the most likely options are highlighted in the chart. This 5 wave decline could be a larger ABC (or WXY/WXYXZ) which is highlighted in red color. Or worse, this could be beginning on a larger trend down and this is just minor wave i of larger 1. This is highlighted in blue color.
Both of these alternatives are bearish in nature. We can expect a bounce which might go around 61.8% (~39,500) though it doesn't need to be that much.
Just remember that for this scenario to play out, this 5 wave structure shouldn't change into a 7 or 11 wave structure as mentioned above.

Dow Jones - All time high and 20% rally?Hello Traders and Investors, today I will take a look at the Dow Jones .
--------
Explanation of my video analysis:
For more than a decade, the Dow Jones has been trading in a rising channel formation. We had the first retest of support and resistance back in 2011 and ever since this was a massively profitable channel pattern. With the recent breakout above the $35.000 resistance level, the Dow Jones clearly looks like the next target is once again the upper resistance of the channel.
--------
Keep your long term vision,
Philip (BasicTrading)
