going shorttoday we are looking at shorting opportunities on Us30 this is a very high risk trade given the trend sentiment
Trade ideas

Possible bearish outlookSeeing how Tuesdays candle closed below the previous hogh , would be watching a bearish drop to the downside

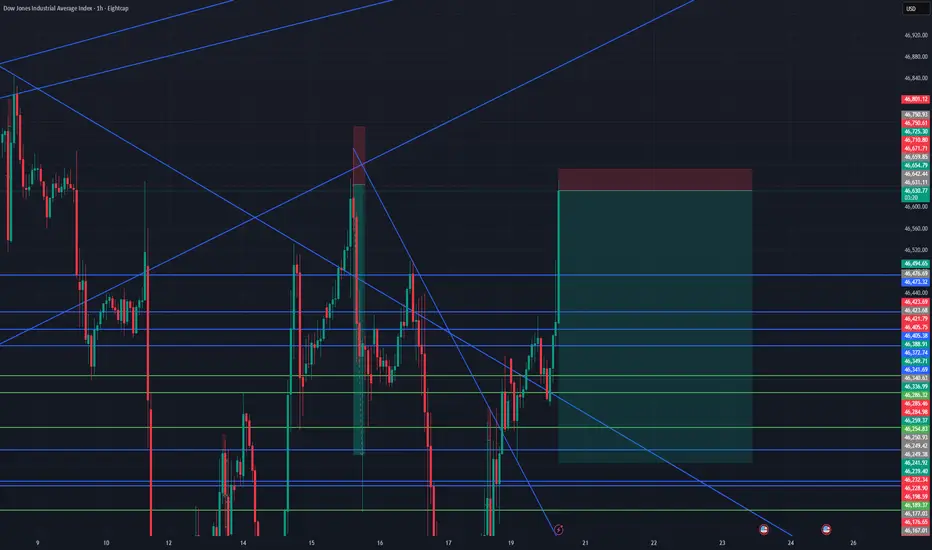
Us30 Trade Set Up Oct 21 2025Daily BSL have been swept and price is at a strong 4h resistance so if price sweeps PDL and closes under i will look for bearish structure on the 1m/5m forming IFVG/CISD to take sells to SSL or 50% of the 4h FVG but if price comes for SSL/London lows first i will look for short term buys to PDH

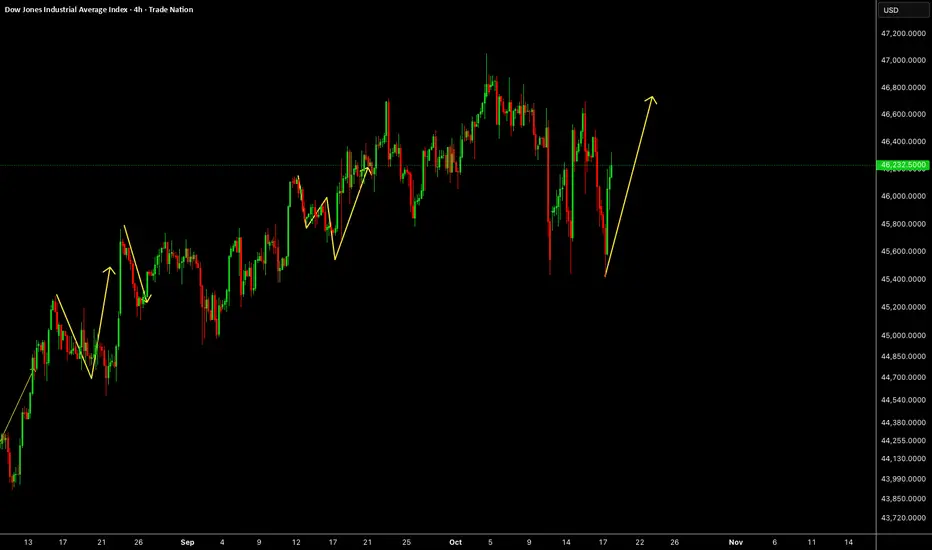
US30US30 still have some upside, correction and one more push up is possible in this week.
Disclosure: We are part of Trade Nation's Influencer program and receive a monthly fee for using their TradingView charts in our analysis.
Silver is now at its SUPER CRE line. Silver is now at its SUPER CRE line.
If this is truly the breakdown line where US equities enter a decade long slumber, then expect a reaction here.
Valid trend lines require 3 reactions.
It won't be pretty, but on the onset, we will have one of the greatest bull eras EVER!

US30: Bulls Are Winning! Long!
My dear friends,
Today we will analyse US30 together☺️
The recent price action suggests a shift in mid-term momentum. A break above the current local range around 46,809.99 will confirm the new direction upwards with the target being the next key level of 46,976.92 and a reconvened placement of a stop-loss beyond the range.
❤️Sending you lots of Love and Hugs❤️

US30 Massive Short! SELL!
My dear friends,
Please, find my technical outlook for US30 below:
The instrument tests an important psychological level 47206
Bias - Bearish
Technical Indicators: Supper Trend gives a precise Bearish signal, while Pivot Point HL predicts price changes and potential reversals in the market.
Target - 46982
Recommended Stop Loss - 47329
About Used Indicators:
Super-trend indicator is more useful in trending markets where there are clear uptrends and downtrends in price.
Disclosure: I am part of Trade Nation's Influencer program and receive a monthly fee for using their TradingView charts in my analysis.
———————————
WISH YOU ALL LUCK

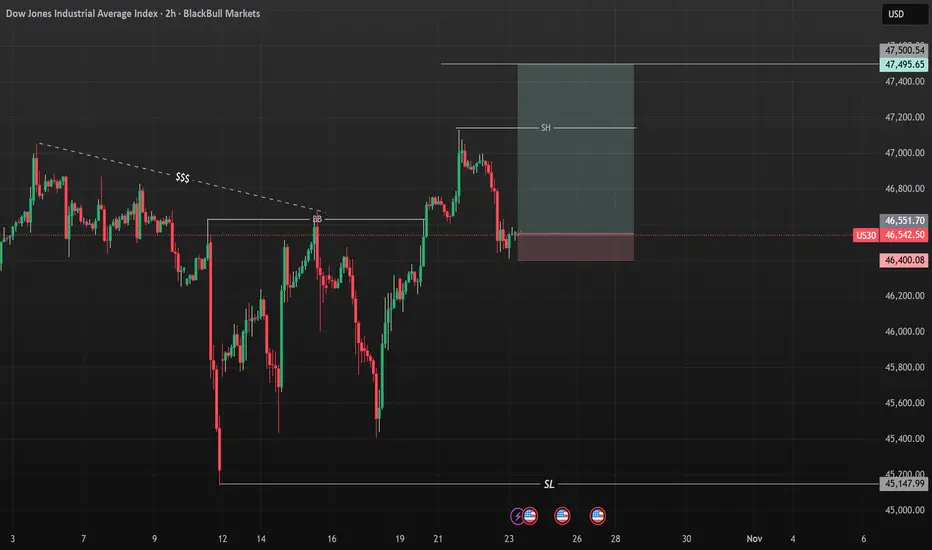
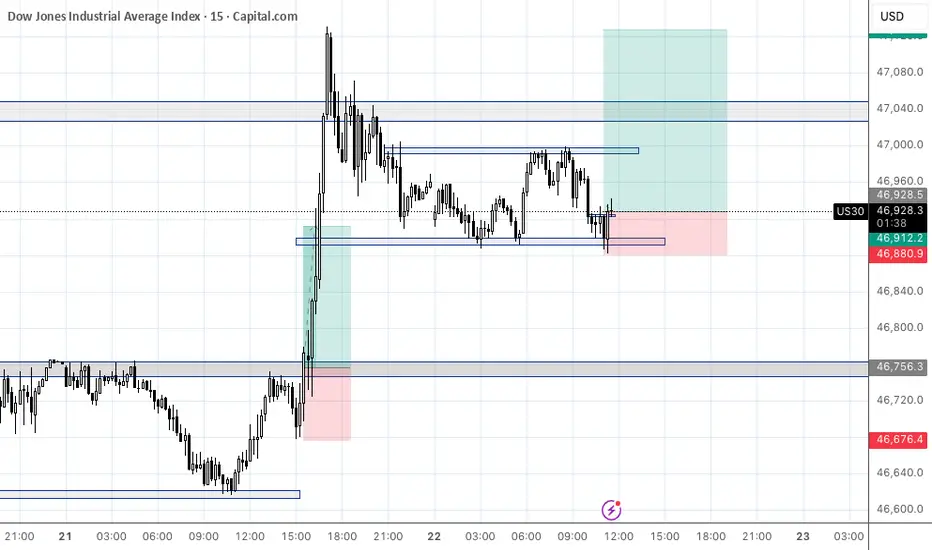
US30 Bearish Leg from $46,800Hi everyone,
Sharing a 15m US30 chart for you guys.
This morning, price traded above previous days high and then gave a bearish reaction.
On the shared chart I have the Asian Low (AL) marked out, which has not been swept or traded below yet.
So this could potentially be a good interim bearish target.
This current $46,800 price level could potentially act as a pivot point if the correct confluences form on the lower time frame such as the 5m chart.
Confluences @ $46,800:
- 61.8% FIB
- OB area
- 1h FVG area
Kind regards,
Aman

DowJones at pivotal 46450 levelKey Support and Resistance Levels
Resistance Level 1: 47156
Resistance Level 2: 47285
Resistance Level 3: 47413
Support Level 1: 46450
Support Level 2: 46270
Support Level 3: 46126
This communication is for informational purposes only and should not be viewed as any form of recommendation as to a particular course of action or as investment advice. It is not intended as an offer or solicitation for the purchase or sale of any financial instrument or as an official confirmation of any transaction. Opinions, estimates and assumptions expressed herein are made as of the date of this communication and are subject to change without notice. This communication has been prepared based upon information, including market prices, data and other information, believed to be reliable; however, Trade Nation does not warrant its completeness or accuracy. All market prices and market data contained in or attached to this communication are indicative and subject to change without notice.

Dow JonesUS 30 - DJI
- Completed " 12345 " Impulsive Waves and " AB " Impulsive Waves
- RSI - Divergence
- Bullish Channel as an corrective pattern in Short Time Frame
- Order Block
- Change of Characteristics

US30 (Dow Jones) Technical Breakdown – 10/24/2025📍 US30 (Dow Jones) Technical Breakdown – 10/24/2025
US30 bouncing strong off the 46,500 demand zone and reclaiming EMAs 📈 Bulls showing strength again, but price now pressing into a major resistance area near 46,830–46,900, where it’s been rejected multiple times 🔥
📊 Market Behavior:
🔹 EMAs flipped bullish after a clean higher low
🔹 Price retesting key structure at 46.8K
🔹 Buyers defending the 46.5K region aggressively
📌 Key Levels:
🔹 Resistance Zones:
46,830 → current intraday cap
46,900 → breakout confirmation
47,100 → bullish continuation target
🔹 Support Zones:
46,520 → local demand
46,300 → EMA retest zone
45,550 → major higher-timeframe support
🧠 Bias:
Bullish ⚡
➡️ Above 46,900 → bullish breakout toward 47,100+
⬅️ Below 46,500 → possible correction back to 46,300

uptrend Given the failure of the resistance area, the consolidation above the resistance area is expected to continue the upward trend to the specified resistance levels.

US30 BUY NOW!!!!!!!!US30 took out the internal structure high with a minor pull back indicating a buying bias am going in on a buy from this zone holding till price gets to 47k.
LETS SEE YOUR THOUGHTS ON US30...
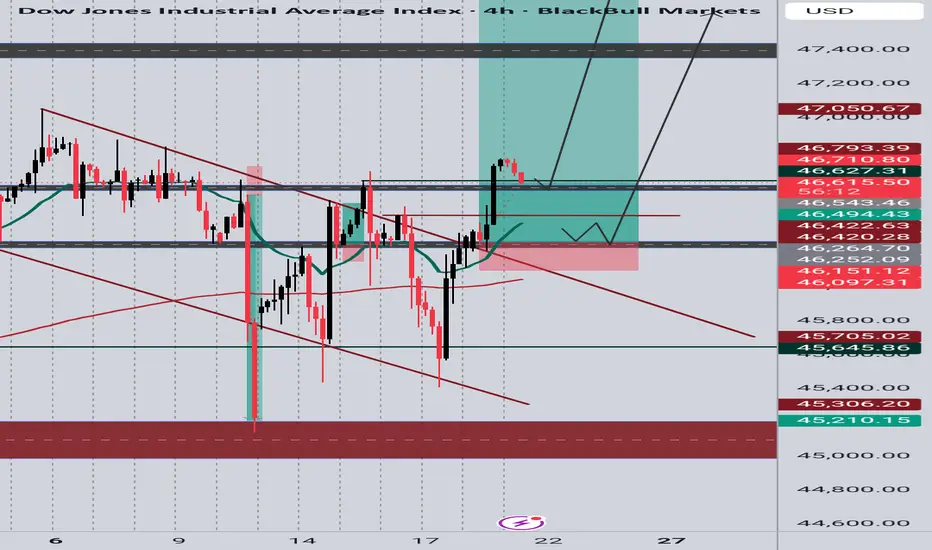
Us30 Idea - Monday 20-10-2025US30 ANALYSIS
Supply - Red areas
Demand - Green areas
LVN (Low volume nodes) - Grey areas
H1 TIME FRAME
We are currently ranging in a 1hr Bearish PD array with price currently in the premium area (selling)- We have also swept External BSL. On the 5min TF we have swept a triple top into a previous LVN 46262. On the 5 min we have double bottom at 45865 holding SSL. demand also lies below this internal SSL as well as a minor demand area (45814) below it. A low volume node for the current bullish leg also lies in the demand area. We can expect one of 3 Scenarios.
Scenario 1.
We inverse the current 1 hr bullish fvg and sell to the SSL (45870) further to the LVN 45781. Thereafter we buy.
Scenario 2.
We inverse the current 1 hr bullish fvg and sell to the SSL (45870) further to the LVN 45781 and even further to 45540.
Scenario 3.
We respect the 1 hr FVG. Claim the LVN 46265 for a bullish run to 46485.
MAJOR DEMAND - 45542
MAJOR SUPPLY - 46485
LTF IQUIDITY
45865 - SSL
Most Likely Scenario.
Considering Daily Po3. Friday closed bullish. We can expect the new candle to print bullish as well (OLHC). This means we can see London Manipulate into the demand area and LVN as in Scenario 2, to then target the supply area at 46485.
Trading a range can sometime be tricky, hence we have to monitor positions at lower TF key levels until we break through major supply or major demand.

US30 - Potential TargetsDear friends in trading,
As long as equities are making HH's it's going up...
The yellow line will serve as breakout support for the new ATH.
Keynote:
The government shutdown has the markets uneasy and unpredictable - BE SAFE
Thank you for taking the time to study my analysis.

US30 longI see great buying power coming.
sentiments are looking risk on and positive for US stocks as Us and china look to be interested in making a trade deal.
technicals show that at the current price levels buyers have come in to purchase driving price up
US30 (Dow Jones) 4H AnalysisPrice has broken out of the falling wedge pattern and is now approaching a key retest zone around 46,600–46,650 & 46 400. I’m watching for a bullish confirmation on the retest to enter long, targeting the next resistance zones.
✅ Entry: On confirmed retest of the breakout zone
🎯 First Target: 47,450
🎯 Final Target: 48,227
🛑 Stop Loss: Below the support area around 46,450
The recent break of structure combined with bullish momentum and neckline breakout signals potential continuation to the upside this week.
📅 Looking for bullish continuation into higher resistance levels if price holds above the breakout zone.
US30 UpdateNext move on the way, focus on proper risk management & stay disciplined. Wishing you successful trades..!
Key Reason:
1. BSL hunting still in pending.
2. Hidden OB formation.
3. When price tap this area and rejected this area along with strong volume. Then we'll see a upside move.
This is not a financial advise. Confirmation is most important. Let's see how it will work.
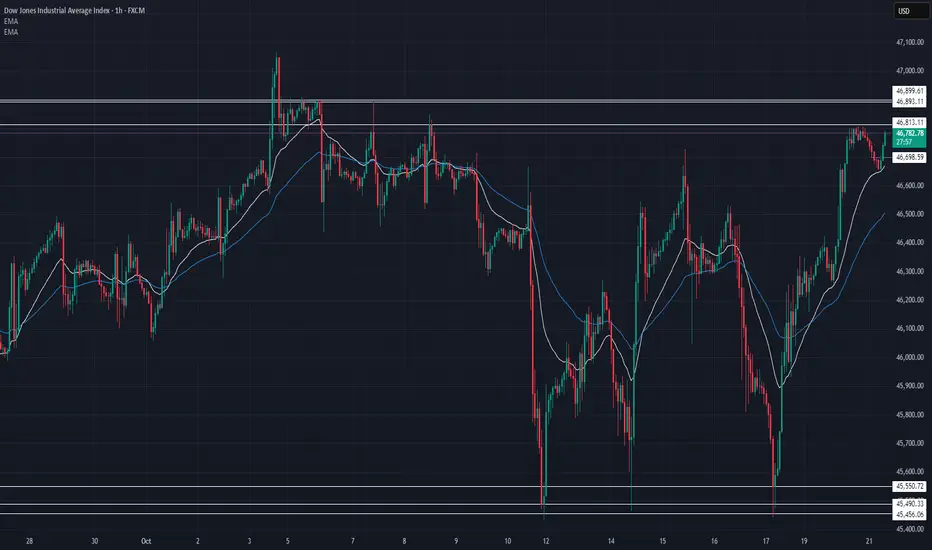
US30 Technical Breakdown – 10/21/2025📍 US30 Technical Breakdown – 10/21/2025
US30 showing strong bullish momentum after reclaiming the 46,600 zone 🚀. Buyers have stepped in aggressively, pushing price back toward key resistance — the market’s testing whether this is just a retracement or the start of a bigger breakout.
📊 Market Behavior:
🔹 Price broke above 46,500 structure zone
🔹 Now consolidating just under 46,800 resistance
🔹 EMAs fanning upward — short-term trend favoring bulls
📌 Key Levels:
🔹 Resistance Zones:
46,813 → intraday rejection zone
46,893 → major breakout target
46,900+ → bullish continuation potential
🔹 Support Zones:
46,700 → EMA short-term support
46,505 → key retest level
46,100 → lower structure support
45,550 → macro floor for bulls
🧠 Bias:
Bullish ⚡
➡️ Above 46,900 → continuation to 47,200 possible
⬅️ Below 46,500 → momentum weakens, 46,100 retest likely
DowJones bullish reaction to US 3% Inflation dataKey Support and Resistance Levels
Resistance Level 1: 47156
Resistance Level 2: 47285
Resistance Level 3: 47413
Support Level 1: 46450
Support Level 2: 46270
Support Level 3: 46126
This communication is for informational purposes only and should not be viewed as any form of recommendation as to a particular course of action or as investment advice. It is not intended as an offer or solicitation for the purchase or sale of any financial instrument or as an official confirmation of any transaction. Opinions, estimates and assumptions expressed herein are made as of the date of this communication and are subject to change without notice. This communication has been prepared based upon information, including market prices, data and other information, believed to be reliable; however, Trade Nation does not warrant its completeness or accuracy. All market prices and market data contained in or attached to this communication are indicative and subject to change without notice.

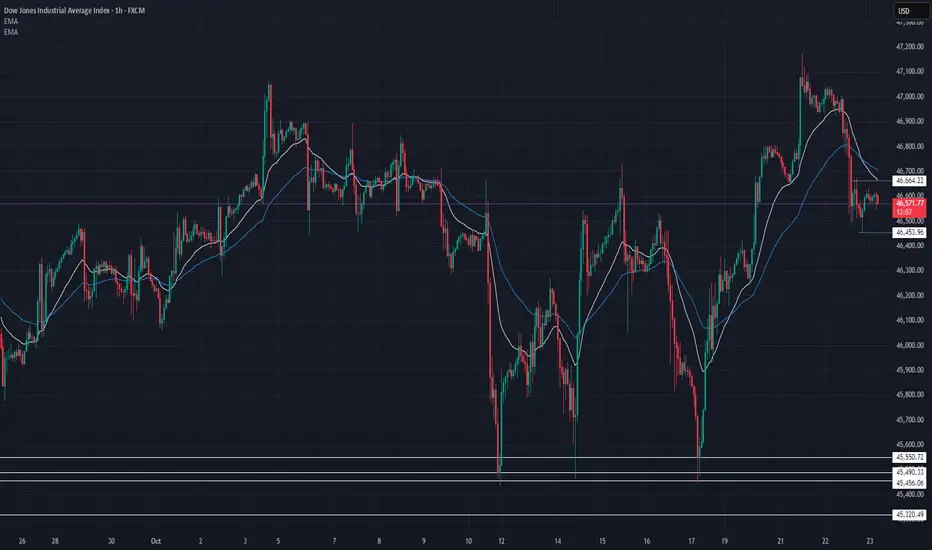
US30 Technical Breakdown – 10/23/2025📍 US30 Technical Breakdown – 10/23/2025
US30 seeing a sharp rejection from the 47,100 area, now consolidating around the 46,600 zone. Bears have regained short-term control as EMAs flip bearish — momentum slowing after recent upside pushes 😴📉
📊 Market Behavior:
🔹 Clean rejection off 47,000 resistance
🔹 EMAs crossing down, showing bearish pressure
🔹 Price ranging between 46,450 – 46,700
📌 Key Levels:
🔹 Resistance Zones:
46,664 → intraday resistance
46,850 → key supply zone
47,100 → breakout threshold
🔹 Support Zones:
46,450 → near-term demand
46,226 → structure support
45,550 → macro support for bulls
🧠 Bias:
Bearish ⚠️
➡️ Below 46,450 → sell momentum could push to 46,200
⬅️ Above 46,700 → bulls may try to retest 46,900
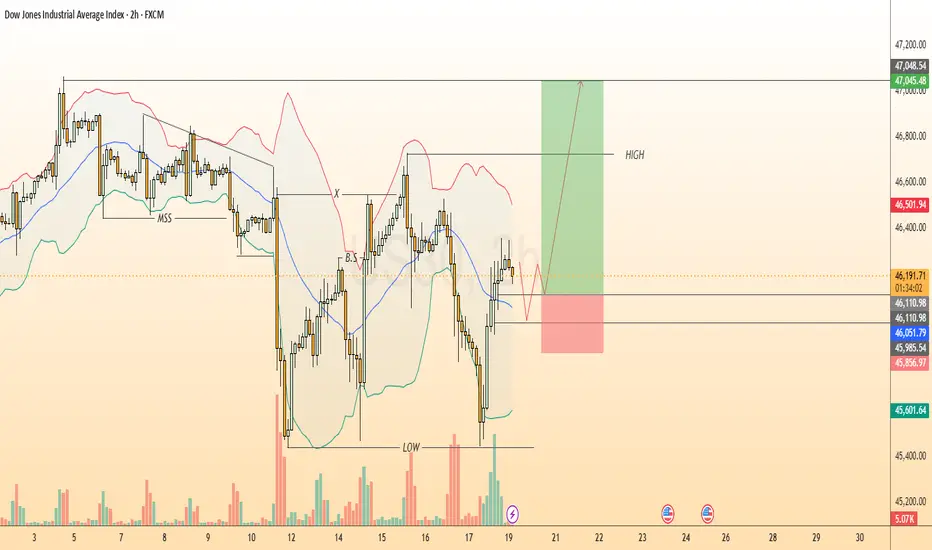
U30 Trade Set Up Oct 20 2025I want to see price sweep BSL/London highs to then look for internal bearish structure on the 1m-5m to take sells to internal SSL
