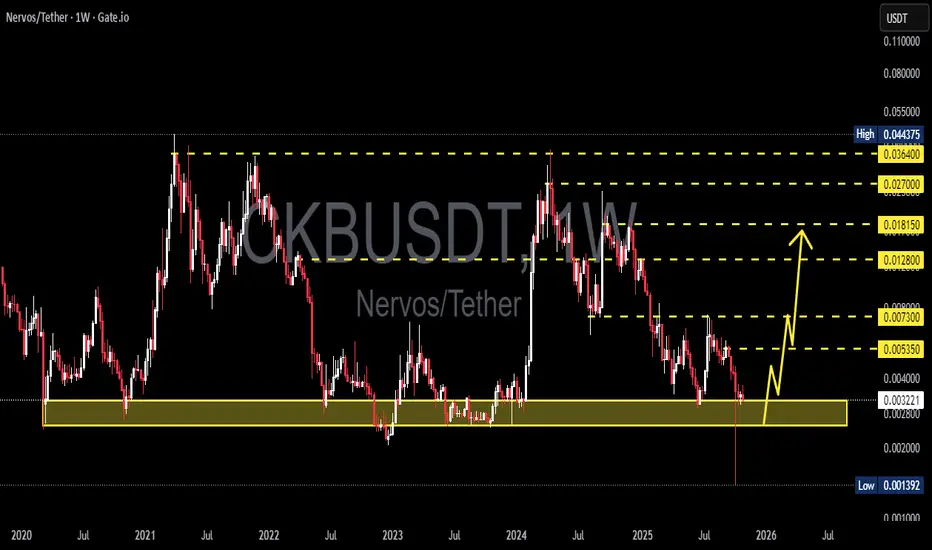
CKB/USDT - Major Support Before Potential Reversal or Breakdown?CKB/USDT on the Weekly timeframe remains in a long-term downtrend, characterized by a clear sequence of Lower Highs (LH) and Lower Lows (LL) since the 2021–2024 peak. Price is currently revisiting a major historical demand zone that has previously triggered strong market reactions.
The yellow zone
Related pairs

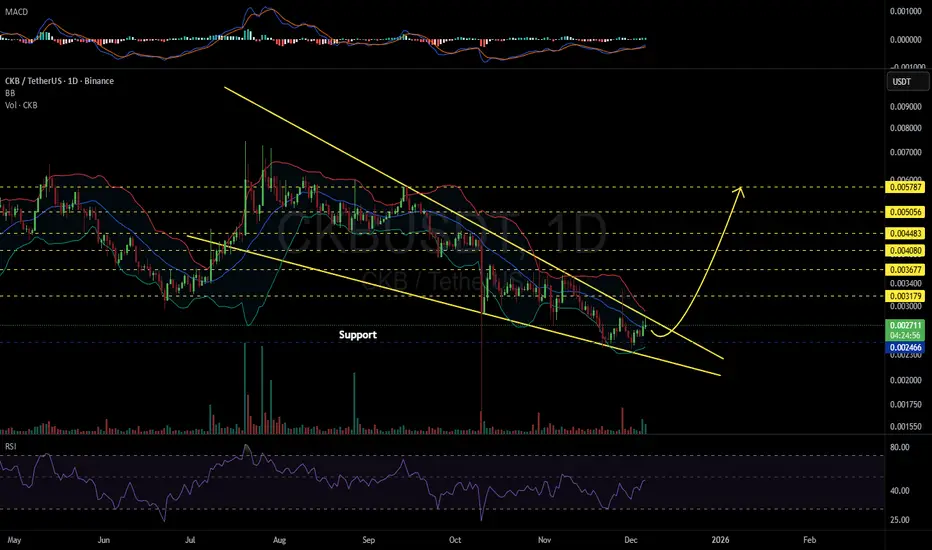
CKBUSDT 1D#CKB is moving inside a falling wedge pattern on the daily chart. Consider buying a small bag here and another near the support level at $0.002466. In case of a breakout above the wedge resistance, the potential targets are:
🎯 $0.003179
🎯 $0.003677
🎯 $0.004080
🎯 $0.004483
🎯 $0.005056
🎯 $0.005787
❌
CKB - Nervos NetworkReal nice Bullish Dragon here with a Right angled and descending broadening formation as a base. Pattern target would be a 100% measured move of the range

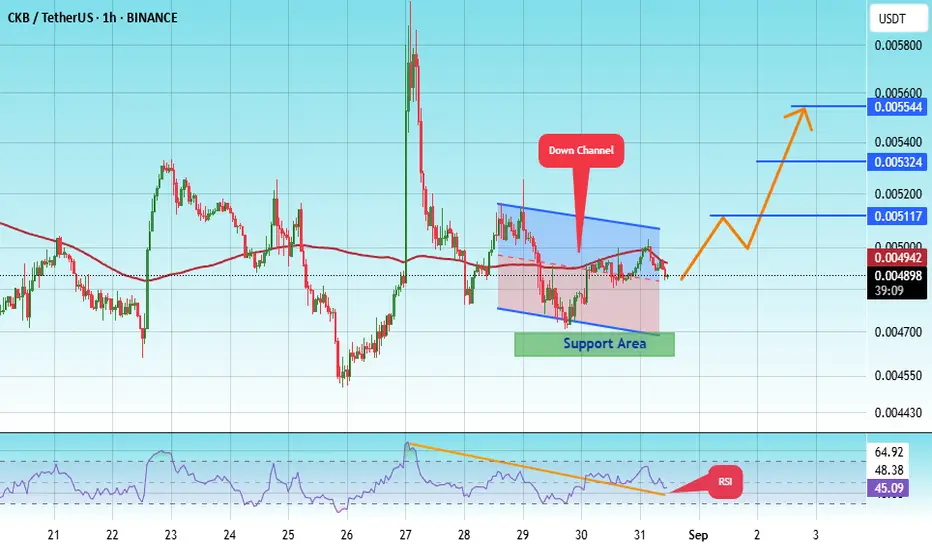
#CKB/USDT — The Final Defense Zone Before a Major Move?#CKB
The price is moving in a descending channel on the 1-hour timeframe and is expected to break out and continue upwards.
We have a trend to stabilize above the 100-period moving average again.
We have a downtrend on the RSI indicator, which supports an upward move if it breaks above it.
We ha

CKB/USDT — The Final Defense Zone Before a Major Move?CKB is currently standing on its last line of defense, the historical support zone between 0.0032–0.0025, which has served as the foundation of every major reversal since 2020.
For over three years, this yellow block has acted as the core accumulation zone where long-term buyers consistently regaine
CKBUSDT 3D#CKB is moving inside a descending channel on the 3-day timeframe chart and is currently holding above the support zone. In case of a bounce and breakout above the channel resistance, the potential targets are:
🎯 $0.004782
🎯 $0.006410
🎯 $0.008548
🎯 $0.010276
🎯 $0.012004
🎯 $0.014464
🎯 $0.017598
⚠️

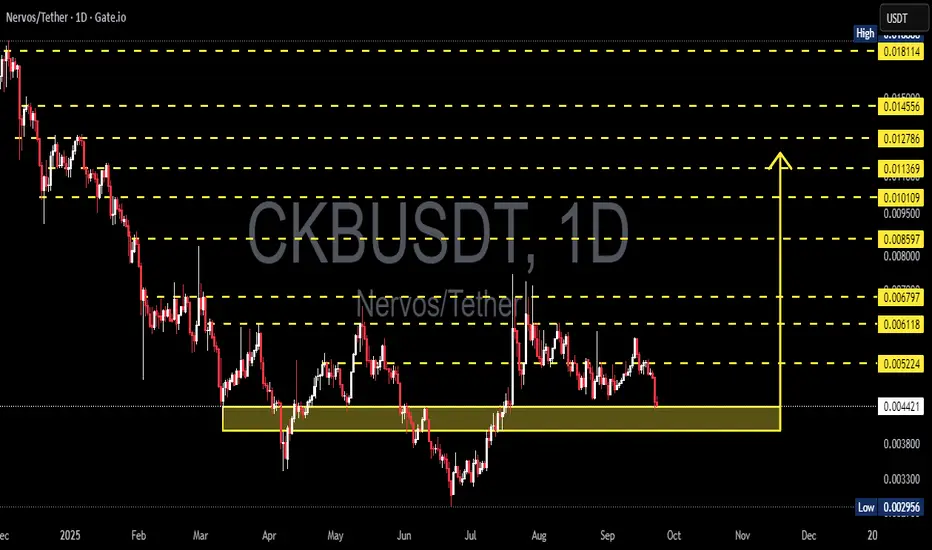
CKBUSDT — Test Demand Zone: Reversal or Deeper Breakdown?📝 Full Analysis
The Nervos (CKB/USDT) pair is now trading right inside a critical demand zone at 0.0038 – 0.0046. This area has repeatedly acted as a last line of defense against deeper declines. At this stage, the market is at a decision point: will this zone trigger another accumulation bounce, o
BUY. CKB. NOW0.2 is coming now
As my post from 2023 states
0.19-20 is the final target
This year it will happen
All the math finally adds up

CKB 0.05 THIS YEAR?if we had 3 rate cuts this year instead of 2
CKB making new all time high to 0.045-0.05 is possible by end of the year
DYOR

#CKB/USDT Still Time to Catch the Move? Some say the move ?#CKB
The price is moving within a descending channel on the 1-hour frame, adhering well to it, and is heading for a strong breakout and retest.
We have a bearish trend on the RSI indicator that is about to be broken and retested, supporting the upside.
There is a major support area (in green) at
See all ideas
Summarizing what the indicators are suggesting.
Oscillators
Neutral
SellBuy
Strong sellStrong buy
Strong sellSellNeutralBuyStrong buy
Oscillators
Neutral
SellBuy
Strong sellStrong buy
Strong sellSellNeutralBuyStrong buy
Summary
Neutral
SellBuy
Strong sellStrong buy
Strong sellSellNeutralBuyStrong buy
Summary
Neutral
SellBuy
Strong sellStrong buy
Strong sellSellNeutralBuyStrong buy
Summary
Neutral
SellBuy
Strong sellStrong buy
Strong sellSellNeutralBuyStrong buy
Moving Averages
Neutral
SellBuy
Strong sellStrong buy
Strong sellSellNeutralBuyStrong buy
Moving Averages
Neutral
SellBuy
Strong sellStrong buy
Strong sellSellNeutralBuyStrong buy
Displays a symbol's price movements over previous years to identify recurring trends.
Frequently Asked Questions
The current price of CKB / TetherUS (CKB) is 0.001620 USDT — it has fallen −2.93% in the past 24 hours. Try placing this info into the context by checking out what coins are also gaining and losing at the moment and seeing CKB price chart.
CKB / TetherUS price has fallen by −19.47% over the last week, its month performance shows a −32.55% decrease, and as for the last year, CKB / TetherUS has decreased by −74.67%. See more dynamics on CKB price chart.
Keep track of coins' changes with our Crypto Coins Heatmap.
Keep track of coins' changes with our Crypto Coins Heatmap.
CKB / TetherUS (CKB) reached its highest price on Mar 31, 2021 — it amounted to 0.044470 USDT. Find more insights on the CKB price chart.
See the list of crypto gainers and choose what best fits your strategy.
See the list of crypto gainers and choose what best fits your strategy.
CKB / TetherUS (CKB) reached the lowest price of 0.001400 USDT on Oct 10, 2025. View more CKB / TetherUS dynamics on the price chart.
See the list of crypto losers to find unexpected opportunities.
See the list of crypto losers to find unexpected opportunities.
The safest choice when buying CKB is to go to a well-known crypto exchange. Some of the popular names are Binance, Coinbase, Kraken. But you'll have to find a reliable broker and create an account first. You can trade CKB right from TradingView charts — just choose a broker and connect to your account.
Crypto markets are famous for their volatility, so one should study all the available stats before adding crypto assets to their portfolio. Very often it's technical analysis that comes in handy. We prepared technical ratings for CKB / TetherUS (CKB): today its technical analysis shows the strong sell signal, and according to the 1 week rating CKB shows the strong sell signal. And you'd better dig deeper and study 1 month rating too — it's sell. Find inspiration in CKB / TetherUS trading ideas and keep track of what's moving crypto markets with our crypto news feed.
CKB / TetherUS (CKB) is just as reliable as any other crypto asset — this corner of the world market is highly volatile. Today, for instance, CKB / TetherUS is estimated as 18.14% volatile. The only thing it means is that you must prepare and examine all available information before making a decision. And if you're not sure about CKB / TetherUS, you can find more inspiration in our curated watchlists.
You can discuss CKB / TetherUS (CKB) with other users in our public chats, Minds or in the comments to Ideas.