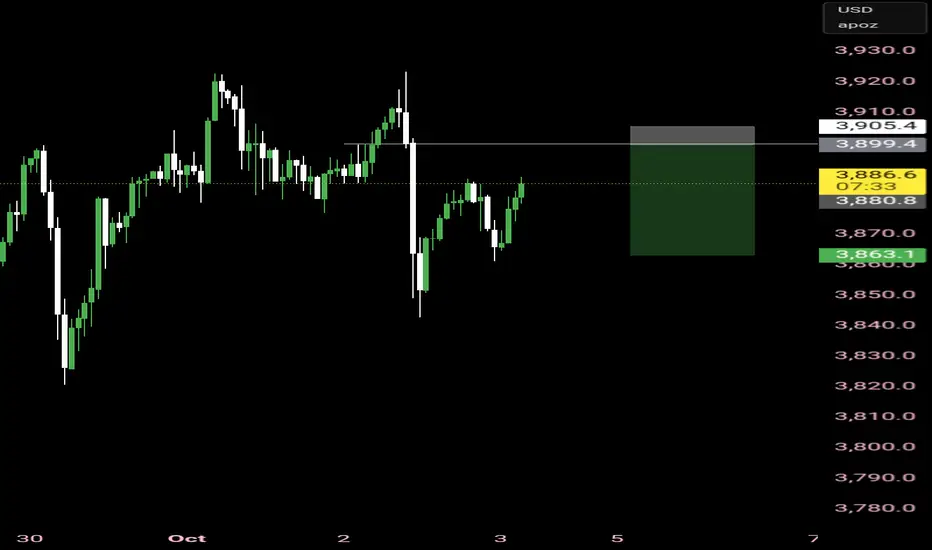
Macro Data can keep Gold Pushing! Key Levels:
Daily High (DH): 3899.5
Monthly High (MH): 3899.5
Daily Low (DL): 3820.4
Weekly High (WH): 3824.6
Weekly Low (WL): 3717.7
📊 Technical Outlook
Price is currently trading near 3890, holding strong after yesterday’s impulsive bullish move. If we see a clean break back above yesterday
Related commodities

Gold UpdateI dumped my gold, but every time it hits the red line on MFI, it bounces up.
I think it dips Monday if a budget deal gets done, or goes up again if there is no deal. I'm inclined to stay cash this weekend.


Gold Futures (MGC) – Pushing Into New HighsPrice continues to climb into all-new highs with very little pullback, showing clear bullish momentum. However, structure is getting thin, and momentum could begin to exhaust soon.
🔹 Current Bias: Bullish — until 4H structure breaks.
🔹 Key Levels:
‣ W-H: 3928
‣ D-H: 3916
‣ D-L: 3861
‣ Daily FVG: 38

Long trade
30min TF overview
Trade 4 – Active Trade Idea
Direction: Buyside trade
Date: Fri 3rd Oct 2025, 9.00 am
Entry: 3900.8
Profit Level (TP): 3967.3 (+1.70%)
Stop Level (SL): 3837.0 (−1.33%)
RR: 5.16
Narrative:
Setup aligns with sweep/trigger/entry model.
Market respected the prior demand zone and le

Has Gold Reached Its Fullest Potential?Has gold reached its fullest potential? It depends on the US dollar.
As we can see when dollar declines, gold went up.
i) From 2001 to 2011, when dollar was down, gold went up.
ii) From 2017 to 2020, when dollar was down, gold went up.
iii) And from 2022 to current, when dollar is down, gold is u

Gold Futures (MGC) – No Pullback, Just Pure StrengthPrice never offered a clean pullback yesterday — just an aggressive continuation straight through prior structure. That type of behavior usually signals either institutional repricing or momentum fueled by broader uncertainty (like the ongoing U.S. government shutdown risk).
🔹 Bias: Bullish until a

Gold Cant stop...Wont Stop....Price continues pressing into new highs with no meaningful pullback, showing strong safe-haven momentum amid rising geopolitical tension.
Watching for signs of exhaustion near current highs — ideally a liquidity sweep above the Daily High (DH) before any structural shift confirms.
No rush to fade

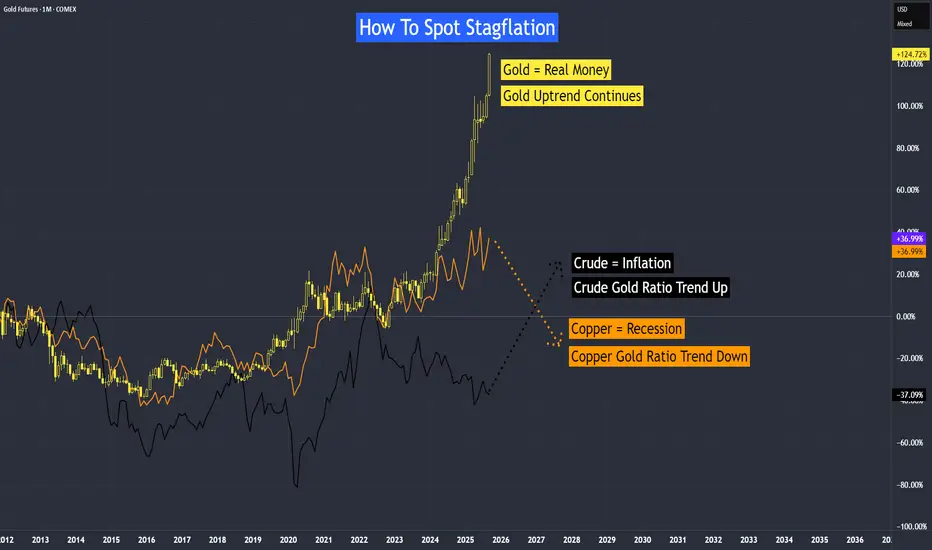
How To Spot Stagflation?One way is by looking at the copper-to-gold ratio and the crude oil-to-gold ratio.
• Gold reflects real money and investor confidence.
• Copper tracks recession.
• Crude oil represents inflation pressures.
When real money is under threat, the economy slows, and inflation rises at the same time, we
See all ideas
Frequently Asked Questions
The nearest expiration date for Gold is Jan 16, 2026.
Traders prefer to sell futures contracts when they've already made money on the investment, but still have plenty of time left before the expiration date. Thus, many consider it a good option to sell Gold before Jan 16, 2026.