Market Hunter: NASDAQ-NAS100 Sell OpportunityMy friends, Good morning!☀️
For US100-NAS100, I will open a SELL position between 24,988 and 25,243, targeting 23,843.📊
My friends, I share these analyses thanks to every single like I receive from you.
Your likes increase my motivation and make me want to support you in this way.🙏
I sinc

Tech bubble burst?The Head and Shoulders (H&S) pattern is a classic reversal formation, typically found after a mature uptrend. It represents a gradual loss of buying pressure and a transition toward a potential downward move.
The H&S pattern often signals the exhaustion of bullish momentum, a shift in control toward

US100: Bullish Breakout Confirmed, But...US100: Bullish Breakout Confirmed, But a Healthy Pullback Is Needed
I would like to see a correction before buying US100
US100 has recently confirmed a Descending Broadening Wedge breakout, a pattern that typically signals the resumption of a strong bullish trend.
However, we are still in a low

NASDAQ Potential UpsidesHey Traders, in today's trading session we are monitoring NAS100 for a buying opportunity around 25,520 zone, NASDAQ is trading in an uptrend and currently is in a correction phase in which it is approaching the trend at 25,520 support and resistance area.
Trade safe, Joe.
Nasdaq - The final blow-off top!⚰️Nasdaq ( TVC:NDQ ) can rally a final +25%:
🔎Analysis summary:
Just this month, we witnessed quite some volatility on the Nasdaq with a correction of about -10%. However, bulls immediately stepped in and clearly pushed price higher. Since there is still bullish pressure, a final blow-off top

USNAS100 consolidating within a bearish trendThe USNAS100 is currently consolidating within a bearish trend. Wall Street’s main indexes are expected to open lower on Monday as investors move to the sidelines ahead of key economic data and a closely watched speech from Federal Reserve Chair Jerome Powell. Markets are looking for clues regarding

NASDAQ Santa Rally already underway.Nasdaq (NDX) has made a strong V-shaped recovery on its 1D MA100, as projected on our previous analysis and is extending the uptrend above the 4H MA200 (orange trend-line).
The rally may need a relief pull-back towards its 4H MA50 (blue trend-line) but technically, the seasonal end-of-the-year 'San

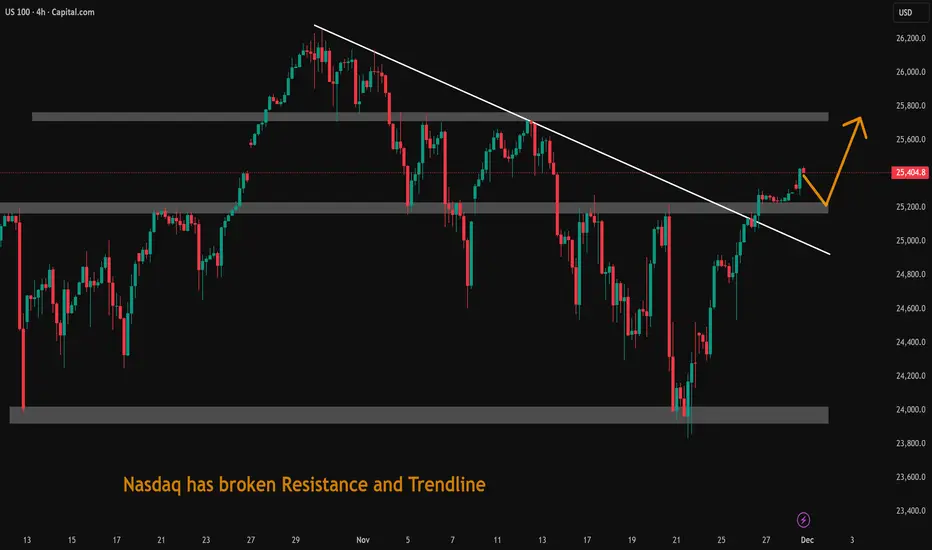
Nasdaq has broken Resistance and TrendlineNasdaq has broken Resistance and Trendline. US economy is doing well. Uptrend may continue.
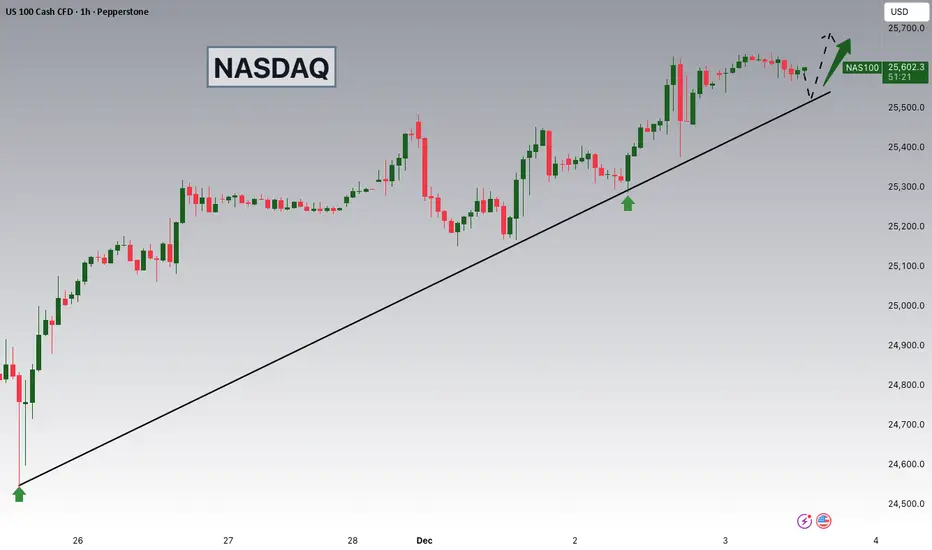
US100 / NASDAQ TodayNasdaq 100 (NDX) Analysis - December 3, 2024
Based on today's market data, here's a comprehensive analysis of the Nasdaq 100:
Today's Performance
The Nasdaq 100 is currently trading around 25,513 points. The index closed at 25,555.86, gaining 213.01 points (+0.84%) as of 5:16 PM EST on December 2.
T

NAS100 | Bullish Bounce Off Pullback SupportMomentum: Bullish
Price is currently above the ichimoku cloud.
Buy entry: 25,308.70
- Pullback support
- 23.6% Fib retracement
Stop Loss: 25,092.80
- Multi-swing low support
Take Profit: 25,553.90
- Swing high resistance
- 127.2% Fib extension
High Risk Investment Warning
Stratos Markets Limite

See all ideas
Displays a symbol's price movements over previous years to identify recurring trends.