S&P 500 (ES1!): Short Term Sells For Longer Term Buys TargetsWelcome back to the Weekly Forex Forecast for the week of Sept 1 - 5th.
In this video, we will analyze the following FX market: S&P 500 (ES1!)
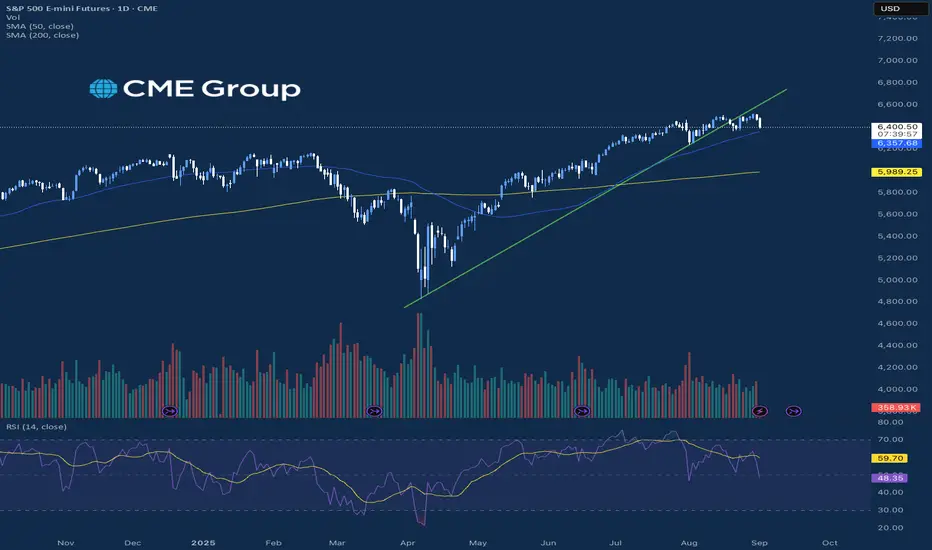
The S&P500 has been strong, but gave a bearish close on Friday. Looking at the Daily, it is easy to see price is retracing lower, perhaps to the +FVG, which is a great place to look for longs once contacted.
Short term sells are permissible, but be mindful the HTFs are bullish.
Enjoy!
May profits be upon you.
Leave any questions or comments in the comment section.
I appreciate any feedback from my viewers!
Like and/or subscribe if you want more accurate analysis.
Thank you so much!
Disclaimer:
I do not provide personal investment advice and I am not a qualified licensed investment advisor.
All information found here, including any ideas, opinions, views, predictions, forecasts, commentaries, suggestions, expressed or implied herein, are for informational, entertainment or educational purposes only and should not be construed as personal investment advice. While the information provided is believed to be accurate, it may include errors or inaccuracies.
I will not and cannot be held liable for any actions you take as a result of anything you read here.
Conduct your own due diligence, or consult a licensed financial advisor or broker before making any and all investment decisions. Any investments, trades, speculations, or decisions made on the basis of any information found on this channel, expressed or implied herein, are committed at your own risk, financial or otherwise.
SPX500U2025 trade ideas

Bearish autumn NQ and ESThis autumn will give us a retracement on the indicies in my opinion. We have seasional tendencies for bearishness and divergence on the weekly and daily charts on the tops.

Core PCE to Wrap the WeekEquity markets are trending lower to finish out a week that came with a vast slate of earnings and economic data many traders have been waiting for. We saw NVIDIA earnings, GDP, and finished the week today with the Fed’s preferred inflation indicator Core PCE, which came right in line with expectations at 2.9%, which was a slight increase over last month. The Nasdaq is leading the equities lower trading down near 1.4% and the S&P and Russell saw small losses after the S&P hit a new record high this week.
Overall this month, the S&P, Nasdaq, Gold and Silver were able to carve out a new all time high price this month and came off of those levels slightly to finish the week and month out. As it stands now, the market is pricing in a 25-basis point interest rate cut near 85% for the September meeting, so traders will be more concerned about how hawkish or dovish Powell sounds after the report comes out for future rate cuts. Next week, we will get more data on manufacturing, jobs, nonfarm payrolls, and unemployment that could add additional volatility to these markets that have been trending higher as of late.
If you have futures in your trading portfolio, you can check out on CME Group data plans available that suit your trading needs tradingview.com/cme/
*CME Group futures are not suitable for all investors and involve the risk of loss. Copyright © 2023 CME Group Inc.
**All examples in this report are hypothetical interpretations of situations and are used for explanation purposes only. The views in this report reflect solely those of the author and not necessarily those of CME Group or its affiliated institutions. This report and the information herein should not be considered investment advice or the results of actual market experience.
S&P500 about to BREAK downLook at the chart, its very EVIDENT. with this overbought and bullish sentiment, i expect the markets to CORRECT further. its still extreme greedy. You can see the support lines. S&P can correct somewhere between 5-9%. Be prepared.
SP:SPX TVC:SPX CBOE:SPX SPREADEX:SPX CBOE:XSP

Day 20 — Trading Only S&P Futures + Monthly resultsWelcome to Day 20 of Trading Only S&P Futures!
Today’s session was all about patience and letting levels do the work.
I started with the X3DD sell signal, but the move was too fast to size in big. Instead, I waited for price to break under 6485 (yesterday’s level) and added a couple of short positions. Later, I shifted focus to the 6463 bottom support — went long there a few times and those trades worked out great.
By holding discipline and repeatedly trading around these levels, I closed the day with +365.28.
📌 This video is going up a little late — I’ve also asked ChatGPT to analyze my last month of trading data to highlight win rates, patterns, and improvements. That deeper analysis is also in the video.
Here's the prompt
"I have trade data from the last month that I’d like you to analyze. Please perform a detailed data analysis and highlight interesting insights, such as patterns, strengths, weaknesses, and potential improvements in my trading approach. A few important notes about my strategy and data: Risk/Reward: I typically trade using a 2x risk to 1x reward setup. This gives me more flexibility to turn trades into winners and avoid stop-loss hunts. Please calculate the win rate I need to achieve to be profitable with this risk/reward ratio. Trade Grouping: My trade count may appear higher than it actually is because sometimes I enter with multiple contracts and scale out at different price levels. If you see trades with the same entry or exit prices, please group them as a single trade. Analysis Goals: Show win rate, average profit/loss, risk-adjusted return, and drawdowns. Identify what worked well and what didn’t. Highlight any tendencies or biases (e.g., time of day, entry type, asset type). Suggest improvements based on the data. Please make the analysis as practical and data-driven as possible."
📈 Key Levels for Tomorrow:
Above 6480 = Flip Bullish
Below 6460 = Flip Bearish

ES - September 2nd - Daily Trade PlanSeptember 1st - 5:55pm EST - Overnight Session & Daily Trade Plan
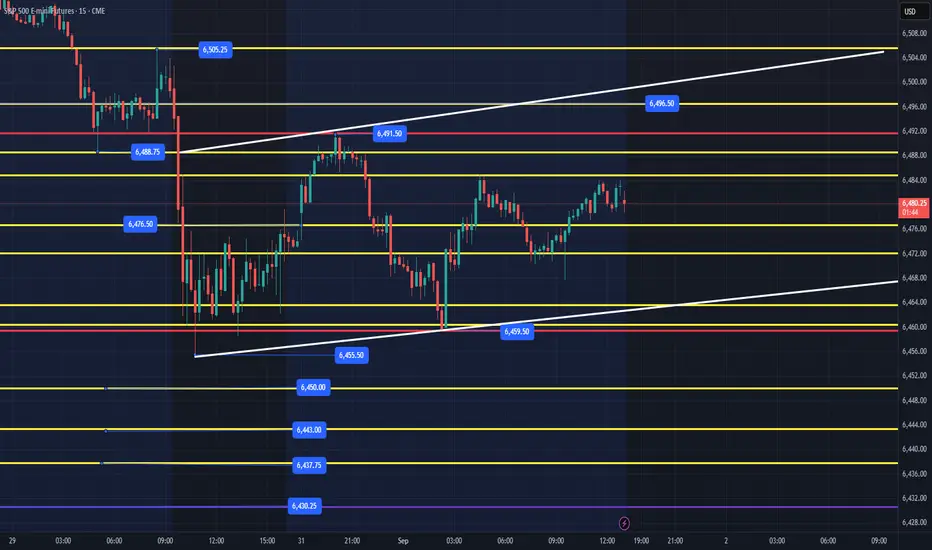
We have a short week with volume picking up moving forward into a seasonally down period. I said on the weekly plan that "Due to low volume on Monday, I do not expect us to get much higher than 6496 in the Monday session, with some headline taking us down Tuesday to 6431 area".
Last night's session our high was 6491.50 and we retested Friday's low around 6459.50. I have put in white a potential bear flag that could continue higher to the 6496.50 level. IF, price does not clear 6505 and hold, we will need to retest the levels below and that could be 6472, 6453 for us to flush and reclaim. Below 6459 and we will need to most likely get out the way and let price flush a few levels, reclaim and back test the 6455-59 zone.
Support levels in yellow that we could flush and reclaim to push higher are as follows:
6455-59, 6450, 6437-40, 6430, 6419, 6411. I believe that 6430 (Last week's low) will give us a good reaction and then 6411 which is the area we broke out from Friday August 22nd. I expect us to have a choppy overnight session with tomorrow's NYSE open giving us direction and hopefully breaking out of this choppy range between 6455- 6496.
I am still bullish above 6390, but a break below this level would be a warning to the current trend.
I will provide an update tomorrow am around 8:30am EST. Check out my Weekly Trade plan in the related publication section to the right.
MES1! WEEK 36 AUG 24TH Looking for MON, TUE, WED to create high of the week at the AUG 29th 6A.M Bearish OB. The Head towards the 3H Equal Lows.
IF price break above the OB then you will need to sit back and reassess. Possibly look for higher prices.
CALANDER EVENT
TUES
-10AM - PMI (HIGH)
WED
-7AM - 30-YEAR MORTGAGE RATE (MED)
-9AM - FED SPEACH (MED)
-10AM - JOLT's JOB OPENING (HIGH)
THUR
-10AM - PMI (HIGH)
-12PM - OIL/GAS (MED)
FRIDAY
-8:30AM - NFP / UNEMPLOYMENT RATE
STOCK
Look to place a Put at the time price trades to the 3H OB.

Continued absorption and a sideways moveThe expectation for Monday on the daily chart in the S&P 500 is to continue its absorption of fundamental information and a potential sideways market as it does this.

Day 29 — Trading Only S&P Futures | From Red to GreenWelcome to Day 29 of Trading Only S&P Futures!
The day started bearish, and my early shorts worked — until the market began spiking up and flipping bullish. Some of those positions hit stop-loss, so I stepped back and waited.
At 6605 gamma resistance, I shorted again with conviction and rode the reversal back into positive territory, finishing the day at +91.81.
This was a good reminder to not overstay trades when conditions are choppy, and to wait for the high-probability levels to do the heavy lifting.
📰 News Highlights
U.S. SEPTEMBER MICHIGAN 5-YEAR EXPECTED INFLATION RISES 3.9%; EST. 3.4%; PREV. 3.5%
🔑 Key Levels for Tomorrow
Above 6565 = Remain Bullish
Below 6535 = Flip Bearish

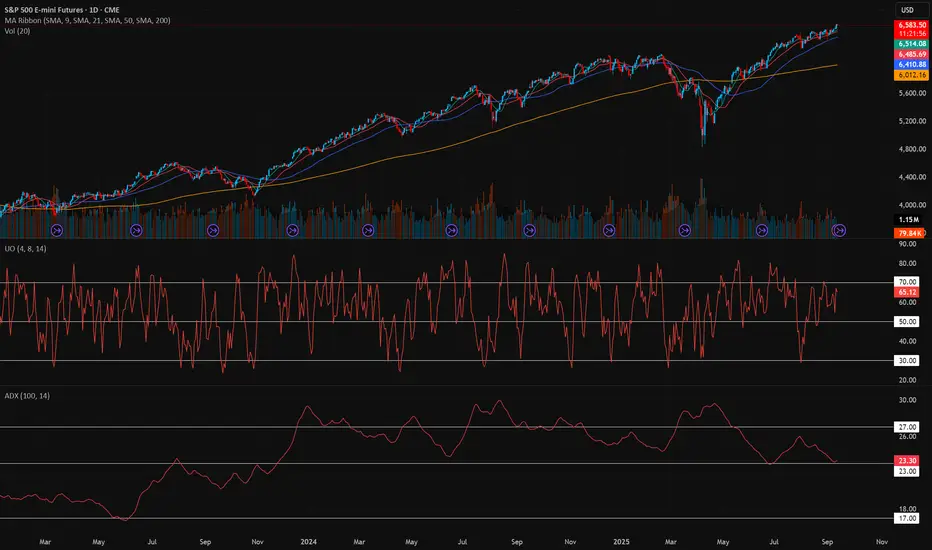
Simple UO + ADX Futures Strategy📚 Trading Plan with UO + ADX + 9/21 MA
1. Indicator Roles
Ultimate Oscillator (UO): Measures momentum across 3 different timeframes (short, medium, long). I use the lengths 4/8/14.
Overbought: > 70
Oversold: < 30
Neutral: 30–70 range
ADX (14-period, 100 smoothed): Measures trend strength, not direction.
Weak trend: < 17~20
Building trend: 20–25
Strong trend: > 27–30, enter on pullback. A bounce from the 9 or 21 MA.
2. Core Trading Logic
We combine momentum (UO) with trend strength (ADX) to avoid false signals.
Long Setup (Buy):
ADX rising above 23 → trend gaining strength.
UO crosses above 30 from below → confirms bullish momentum.
Confirm price is above 21-day MA (optional filter for trend).
📈 Exit:
UO > 50 and turning down, or
ADX below 17, or
Trailing MA.
Short Setup (Sell):
ADX rising above 27 → trend gaining strength.
UO crosses below 70 from above → confirms bearish momentum.
Confirm price is below 9-day MA (optional filter for trend).
📉 Exit:
UO < 30 and turning up, or
ADX drops below 20, or
Trailing stop.
3. Advanced Filters
Avoid false breakouts: If ADX < 20, ignore UO signals (no strong trend).
Divergence filter: If price makes a new high but UO does not → weakening trend.
Scaling:
Add to winners if ADX > 30 and still rising.
Take partial profits if ADX flattens while UO is in extreme zone.
4. Risk Management
Position sizing: Risk 1–2% of account per trade.
Stop loss: Below recent swing low (for longs) or above swing high (for shorts).
Take profit: Risk:Reward 1:2 minimum, or trail with MA.
5. Example Workflow
Case 1 (Bullish):
ADX rises from 18 → 27 (trend forming).
UO crosses 50 → bullish signal.
Enter long.
Exit when UO > 70 and rolls over, or ADX drops < 20.
Case 2 (Bearish):
ADX rises above 25.
UO crosses below 50.
Enter short.
Exit when UO < 30 and turns up, or ADX weakens.
✅ Summary Ruleset
Trade only when ADX > 23–25 (filter out noise).
Go long: UO crosses > 50 with rising ADX.
Go short: UO crosses < 50 with rising ADX.
Exit on momentum extremes (UO < 30 or > 70) or weakening ADX.
Risk: Keep losses capped at 1–2% of equity per trade.
High Expectations!The daily structure in the S&P 500 futures market for Thursday, September 11 indicates high expectations about Fed action next week. Price action for Friday, September 12 is a rest day. This means not a big day up or down without new fundamental information.

Grinding Toward 6,622 and 100% move based off of late 2023 LowHard pressed to see much more upward movement without a significant correction in the cycle. Watching for gaps and increased volatility.

Strategies & Styles in Global TradingPart 1: Foundations of Global Trading Strategies
1.1 Strategic Thinking in Trading
Trading strategies aim to answer three critical questions:
What to trade? (stocks, forex, commodities, indices, crypto, bonds).
When to trade? (entry and exit timing based on analysis).
How much to risk? (position sizing and risk management).
Without a defined strategy, trading becomes speculation driven by emotions.
1.2 Key Influences on Strategy
Global strategies are shaped by:
Market type: Developed (US, EU, Japan) vs. Emerging (India, Brazil, South Africa).
Time horizon: Long-term investments vs. intraday moves.
Information source: Technical analysis, fundamental analysis, quantitative models, or macroeconomic data.
Technology: Algorithmic trading, AI-driven predictions, and blockchain-based platforms.
Part 2: Major Trading Styles
2.1 Day Trading
Definition: Buying and selling within the same day, closing all positions before market close.
Features: Relies on volatility, liquidity, and rapid decision-making.
Tools Used: Intraday charts (1-min, 5-min, 15-min), moving averages, volume profile, momentum indicators.
Global Example: US tech stocks like Tesla or Nvidia are favorite day-trading instruments due to volatility.
Pros: Quick profits, no overnight risk.
Cons: High stress, requires constant monitoring, heavy brokerage costs.
2.2 Swing Trading
Definition: Holding trades for several days or weeks to capture medium-term price swings.
Basis: Combines technical chart patterns with macro/fundamental cues.
Global Example: Trading EUR/USD currency pair during central bank policy cycles.
Pros: Less stressful than day trading, better reward-to-risk ratio.
Cons: Requires patience; risk of overnight news shocks.
2.3 Position Trading
Definition: Long-term strategy, holding positions for months or years.
Basis: Fundamental analysis (earnings, economic cycles, interest rates).
Global Example: Long-term bullish positions in gold as an inflation hedge.
Pros: Less frequent monitoring, aligns with macro trends.
Cons: Requires strong conviction and capital lock-in.
2.4 Scalping
Definition: Ultra-short-term trading strategy, aiming for small profits on many trades.
Basis: Order flow, bid-ask spreads, micro-movements.
Global Example: Forex scalpers trade EUR/USD, GBP/USD due to high liquidity.
Pros: Rapid compounding of profits, no overnight risk.
Cons: High transaction costs, requires lightning-fast execution.
2.5 Algorithmic & Quantitative Trading
Definition: Using computer models, AI, and algorithms to trade automatically.
Methods: Statistical arbitrage, mean reversion, machine learning models.
Global Example: Hedge funds like Renaissance Technologies use quant models to outperform markets.
Pros: Emotion-free, scalable, works 24/7 in multiple markets.
Cons: Requires advanced coding skills, backtesting, and infrastructure.
2.6 High-Frequency Trading (HFT)
Definition: Subset of algorithmic trading using microsecond execution speed.
Basis: Profiting from inefficiencies in order books, arbitrage, spreads.
Global Example: Chicago Mercantile Exchange (CME) futures and US equities.
Pros: Can generate huge volumes of small profits.
Cons: Expensive technology, regulatory scrutiny, highly competitive.
2.7 Event-Driven Trading
Definition: Trading based on news, earnings reports, central bank decisions, or geopolitical events.
Global Example: Buying oil futures after OPEC production cuts; trading GBP during Brexit votes.
Pros: High potential returns.
Cons: High volatility, unpredictable outcomes.
2.8 Arbitrage Strategies
Definition: Profiting from price discrepancies between markets.
Types:
Spatial arbitrage (same asset, different markets).
Triangular arbitrage (currency mismatches).
Merger arbitrage (M&A deals).
Global Example: Simultaneously buying and selling Bitcoin on different exchanges.
Pros: Low-risk if executed correctly.
Cons: Requires speed, capital, and advanced systems.
Part 3: Global Trading Strategies by Asset Class
3.1 Equity Trading Strategies
Value Investing: Buying undervalued stocks (Warren Buffett approach).
Growth Investing: Targeting high-growth sectors like AI or EVs.
Momentum Trading: Riding the wave of strong price trends.
Pairs Trading: Long one stock, short another in the same sector.
3.2 Forex Trading Strategies
Carry Trade: Borrowing in low-interest currency, investing in high-interest currency.
Breakout Trading: Entering positions after a currency breaks key levels.
Range Trading: Buying low, selling high in sideways markets.
News Trading: Trading during central bank announcements or data releases.
3.3 Commodity Trading Strategies
Trend Following: Using moving averages for oil, gold, wheat.
Seasonal Strategies: Trading based on harvests or demand cycles.
Hedging: Producers using futures to lock in prices.
Spread Trading: Buying one commodity and selling another related one (e.g., crude oil vs. heating oil).
3.4 Bond & Fixed Income Trading Strategies
Yield Curve Strategies: Positioning based on steepening or flattening yield curves.
Credit Spread Trading: Exploiting risk premiums between corporate and government bonds.
Duration Hedging: Managing sensitivity to interest rate changes.
3.5 Cryptocurrency Trading Strategies
HODLing: Long-term holding of Bitcoin, Ethereum.
DeFi Yield Farming: Earning interest from decentralized lending protocols.
Arbitrage: Spot vs. futures arbitrage.
Momentum & Volatility Plays: Crypto thrives on extreme price swings.
Part 4: Risk Management & Psychology in Strategies
4.1 Risk Management Tools
Stop-Loss & Take-Profit Orders.
Position Sizing (1–2% capital per trade rule).
Diversification across assets and geographies.
Hedging with options/futures.
4.2 Psychological Styles in Trading
Aggressive vs. Conservative traders.
Discretionary vs. Systematic approaches.
Risk-seeking vs. Risk-averse behaviors.
Trading psychology (discipline, patience, emotion control) often defines whether a strategy succeeds or fails.
Part 5: Regional Differences in Global Trading Styles
US Markets: Heavy focus on tech stocks, options trading, and HFT.
Europe: Strong in forex, bonds, and energy trading.
Asia (Japan, China, India): Retail-dominated, rising algo-trading adoption.
Middle East: Commodity-heavy (oil, petrochemicals).
Africa & Latin America: Emerging markets, currency and commodity-driven.
Part 6: The Future of Global Trading Strategies
AI & Machine Learning: Automated strategies learning from big data.
Blockchain & Tokenization: 24/7 trading, decentralized exchanges.
Sustainable Trading: ESG-based strategies, carbon credits.
Cross-Asset Strategies: Linking equities, commodities, crypto, and derivatives.
Conclusion
Global trading is not just about buying and selling—it is about choosing the right strategy and style that aligns with one’s goals, risk tolerance, and market conditions.
From short-term scalping to long-term investing, from algorithmic arbitrage to macro-driven positioning, traders worldwide adapt strategies to seize opportunities across stocks, currencies, commodities, bonds, and cryptocurrencies.
The winning formula is not a single "best" style—it’s about discipline, adaptability, risk management, and continuous learning. Markets evolve, and so must strategies.
ID: 2025 - 0158.1.2025
Trade #15 of 2025 executed.
Trade entry at 140 DTE (days to expiration).
Excellent fills this morning, well under mid. Created a GTC working order two days ago and let price come to me. No chasing. There are TONS of external liquidity voids resting below.
Target profit is 5% ROI
Happy Trading!
-kevin

ES Supply And demand Break-Out Buy SignalTrading News:
- PPI (Producer Price Manufacturing Index) came out -0.1% vs its 0.3% forecasted number, suggesting lower cost of manufacturing and inflation.
ES:
- Stocks caught a bid from this number as investors use this as a "lock" for FED rate cuts and a higher chance for a 2nd cut before the end of the year.
- Over the last 6 months, when the price is expected to open above yesterday's high, the price has a 74% chance of pulling back and hitting yesterday's high. This gives traders an idea for a possible open short OR wait for a pullback back into the previous ATH/Support level and wait for confirmation.
- Over the last 6 months, if the first 1hr of the NY session is "green" then 75% of the time price will close green for the day. The same is true for the first 1hr candle of the NY session is "red" then 75% chance of day being red.
- Over the last 6 months, Wednesdays have held the highest chance of a "green day", sitting at 69% chance.
- Overall, I remain bullish on this market and would not consider shorting this market at this point—aggressive RB break-out level around the 6540 level on the 5-minute TF. Traders can also wait for price to pullback to this level and wait for confirmation.

ID: 2025 - 0199.9.2025
Trade #19 of 2025
Entry at 164 DTE
Adding to the overall portfolio to help balance delta in anticipation of a market pullback.
Working GTC orders for take profit in 30-60 DIT.
Happy Trading!
-kevin

ESG Investing & Green FinancePart I: Understanding ESG Investing
1. What is ESG?
ESG stands for Environmental, Social, and Governance. It is a framework used by investors to evaluate companies not just on financial performance, but also on how they manage sustainability, ethics, and accountability.
Environmental (E): Measures a company’s impact on the planet—carbon emissions, energy use, waste management, renewable energy adoption, water conservation, pollution control, etc.
Social (S): Assesses how a company treats people—its employees, customers, suppliers, and communities. Issues like labor rights, workplace diversity, data privacy, and community engagement fall here.
Governance (G): Evaluates how a company is managed—board diversity, executive pay, shareholder rights, transparency, anti-corruption policies, etc.
2. Origins of ESG Investing
The roots of ESG investing can be traced back to:
1960s–1970s: Socially Responsible Investing (SRI) emerged. Religious groups and ethical investors avoided companies linked to alcohol, tobacco, gambling, and weapons.
1980s–1990s: Activist investors started pressuring firms on issues like apartheid in South Africa. Many divested from companies operating there.
2000s: Climate change awareness grew, leading to greater focus on corporate environmental performance.
2015 onwards: The Paris Agreement, UN Sustainable Development Goals (SDGs), and growing public concern about climate change propelled ESG to mainstream finance.
3. ESG Investing vs. Traditional Investing
Aspect Traditional Investing ESG Investing
Focus Profit, ROI, growth Profit + sustainability + ethics
Metrics EPS, P/E ratio, ROE ESG scores + financial metrics
Time Horizon Short-to-medium term Long-term resilience
Risk Market risk, credit risk Market + climate + reputational risks
Part II: Key Drivers of ESG Investing
Climate Change and Sustainability Concerns
Rising global temperatures, extreme weather, and natural disasters highlight the risks of ignoring climate change.
Companies that fail to adapt may face legal, regulatory, and reputational risks.
Investor Demand
Millennials and Gen Z, who are more socially conscious, prefer investing in sustainable companies.
ESG-focused mutual funds and ETFs have seen record inflows.
Regulatory Pressure
Governments are mandating climate disclosures. For example, the EU’s Sustainable Finance Disclosure Regulation (SFDR) requires funds to disclose ESG risks.
Corporate Performance Data
Studies show that ESG-aligned companies often outperform peers in the long run due to lower risks, better brand image, and operational efficiency.
Part III: ESG Metrics and Ratings
1. ESG Rating Agencies
Several organizations provide ESG scores to companies, including:
MSCI ESG Ratings
Sustainalytics
Refinitiv
Bloomberg ESG Scores
Each agency uses different criteria, making ESG ratings inconsistent at times. For example, Tesla scores high on environment due to EV leadership, but lower on governance issues.
2. Key Metrics
Carbon emissions (CO2e per unit revenue)
Percentage of renewable energy use
Diversity of board and management
Employee turnover and satisfaction
Transparency in financial reporting
Part IV: Green Finance
1. What is Green Finance?
Green finance refers to financial activities, investments, and instruments specifically designed to support environmentally sustainable projects. Unlike ESG, which is broad, green finance is narrower and directly focused on environmental impact.
Examples include:
Green Bonds (funds raised for renewable energy, clean transport, or sustainable water projects).
Climate Funds (investments in climate change mitigation/adaptation).
Sustainable Loans (corporate loans linked to sustainability targets).
2. Evolution of Green Finance
2007: The European Investment Bank issued the first green bond.
2015: The Paris Climate Agreement boosted funding for green projects.
Today: Green finance is a $2 trillion+ market, with rapid growth in Asia, Europe, and North America.
3. Green Finance vs. ESG Investing
Aspect Green Finance ESG Investing
Scope Narrow (environmental projects only) Broad (environment, social, governance)
Instruments Green bonds, loans, climate funds ESG funds, ETFs, stocks
Purpose Financing climate-friendly initiatives Screening and investing in sustainable companies
Part V: Examples and Case Studies
1. Tesla Inc. (Environment & Social Impact)
Pros: Market leader in EVs, promotes clean energy, reduces carbon dependency.
Cons: Criticism on governance (CEO dominance, workplace safety, and labor issues).
2. Unilever (ESG Leader)
Pioneered Sustainable Living Brands initiative.
Invested heavily in eco-friendly packaging, supply chain ethics, and community programs.
3. Apple Inc.
Committed to becoming carbon neutral by 2030.
Invests in renewable energy for data centers and supply chain sustainability.
4. Green Bonds by Governments
India: Issued sovereign green bonds to finance solar and wind energy.
China: One of the largest issuers of green bonds globally.
EU: Launched “NextGenerationEU” recovery fund with a strong green finance focus.
Part VI: Benefits of ESG & Green Finance
Risk Mitigation – Companies with strong ESG practices face fewer legal and reputational risks.
Long-Term Value Creation – Sustainable companies build resilience against climate and market shocks.
Better Investor Returns – ESG funds often outperform benchmarks over long horizons.
Positive Brand Image – Firms adopting ESG gain consumer trust and loyalty.
Access to Capital – Green finance instruments often come with lower borrowing costs.
Conclusion
ESG investing and green finance are not just trends—they are reshaping global financial markets. By embedding environmental, social, and governance considerations into investment decisions, stakeholders can drive capital towards sustainable and ethical businesses.
While challenges like greenwashing and lack of standardization remain, the direction is clear: the future of finance will be green, responsible, and impact-driven.
Investors, policymakers, and companies who embrace this shift early are likely to reap long-term benefits—not just in profits, but in contributing to a more sustainable planet.

Head and shoulders formation?Possible head and shoulders forming, could make a break to the downside.

WTO, IMF, and World Bank in Global Trading1. Historical Background of Global Trade Institutions
1.1 The Bretton Woods Conference (1944)
In the aftermath of World War II, world leaders recognized the need for a stable international economic order.
The Bretton Woods Conference, held in New Hampshire, USA, in 1944, gave birth to two major institutions: the IMF and the World Bank.
Their purpose was to rebuild war-torn economies, stabilize currencies, and finance reconstruction.
1.2 The General Agreement on Tariffs and Trade (GATT) and WTO
In 1947, the General Agreement on Tariffs and Trade (GATT) was established to reduce tariffs and encourage trade liberalization.
GATT evolved over decades and was eventually replaced by the World Trade Organization (WTO) in 1995, which took on broader responsibilities in managing international trade rules.
Thus, the global economic framework today rests on three pillars: WTO (trade rules), IMF (financial stability), and World Bank (development financing).
2. World Trade Organization (WTO)
2.1 What is the WTO?
The WTO is the only global organization dealing with the rules of trade between nations. With over 160 member countries, it regulates trade agreements, monitors compliance, and settles disputes.
2.2 Core Objectives
Trade Liberalization – Reduce tariffs, quotas, and other barriers.
Predictability – Ensure stable trade policies through binding commitments.
Non-Discrimination – “Most-Favored Nation” (MFN) treatment, ensuring countries don’t discriminate among trade partners.
Fair Competition – Prevent unfair practices like dumping or subsidies.
Development – Provide special provisions for developing and least-developed countries.
2.3 WTO Functions in Global Trade
Negotiation Forum: Members negotiate trade deals (e.g., Doha Round).
Implementation and Monitoring: Ensures countries comply with trade agreements.
Dispute Settlement: Provides a legal framework to resolve trade conflicts.
Capacity Building: Assists developing nations with trade knowledge.
2.4 Impact of WTO on Global Trade
Dramatic reduction in average tariffs (from >30% in 1947 to <5% today).
Expansion of world trade, allowing developing countries like China, India, and Brazil to emerge as major players.
Legal dispute resolution prevents trade wars and supports stability.
2.5 Criticisms of WTO
Seen as favoring developed nations with stronger bargaining power.
Negotiation rounds often stall due to conflicting interests.
Critics argue WTO undermines national sovereignty by enforcing global rules.
3. International Monetary Fund (IMF)
3.1 What is the IMF?
The IMF is a global financial institution headquartered in Washington, D.C., with 190+ member countries. It ensures the stability of the international monetary system—exchange rates, payments, and cross-border capital flows.
3.2 Objectives of IMF
Exchange Rate Stability – Prevent currency crises and competitive devaluations.
Balance of Payments Assistance – Provide short-term loans to countries in crisis.
Policy Surveillance – Monitor global economic trends and provide policy advice.
Capacity Development – Offer training to strengthen economic institutions.
3.3 Functions in Global Trade
Financing Trade Deficits: Countries with shortages of foreign currency can borrow from IMF to finance imports.
Crisis Management: Provides emergency support during global shocks (e.g., Asian Financial Crisis 1997, Eurozone crisis, COVID-19 pandemic).
Exchange Rate Stability: Prevents destabilizing fluctuations that could disrupt trade.
Confidence Building: By backing countries with funds, IMF assures trading partners of stability.
3.4 IMF Tools
Lending Programs: Stand-By Arrangements, Extended Fund Facility, and Rapid Financing Instrument.
Special Drawing Rights (SDRs): International reserve asset to boost global liquidity.
Surveillance Reports: The World Economic Outlook and Global Financial Stability Report.
3.5 Impact of IMF on Global Trade
Prevents collapse of trade flows by ensuring liquidity.
Encourages trade-oriented reforms in developing countries.
Enhances investor confidence by stabilizing economies.
3.6 Criticisms of IMF
Conditionality: Loans often come with austerity measures, criticized for worsening poverty.
Western Dominance: Voting rights favor developed nations, especially the U.S. and Europe.
One-Size-Fits-All Policies: Structural adjustment programs have been criticized for imposing uniform economic models.
4. World Bank
4.1 What is the World Bank?
The World Bank Group (WBG) is a collection of five institutions, the most prominent being the International Bank for Reconstruction and Development (IBRD) and the International Development Association (IDA). Its primary mission is poverty reduction and long-term development.
4.2 Objectives
Reconstruction & Development – Initially focused on post-war rebuilding, now on infrastructure and growth.
Poverty Reduction – Promote inclusive and sustainable development.
Financing Trade Infrastructure – Ports, roads, digital connectivity, and energy supply that enable trade.
Knowledge Sharing – Research and technical expertise.
4.3 Functions in Global Trade
Financing Development Projects: Infrastructure, education, health, energy.
Trade Facilitation: Improves logistics, reduces transaction costs.
Capacity Building: Helps developing nations integrate into global trade.
Risk Mitigation: Provides guarantees to encourage private investment.
4.4 Impact of World Bank on Trade
Building infrastructure that directly supports trade flows (e.g., transport corridors, ports).
Reducing bottlenecks and making exports competitive.
Encouraging private investment and entrepreneurship in developing markets.
4.5 Criticisms of World Bank
Projects sometimes cause displacement or environmental harm.
Critics argue the Bank pushes neoliberal reforms (privatization, deregulation).
Dependence on debt financing can burden poor countries.
5. Interrelationship Between WTO, IMF, and World Bank
These three institutions are often referred to as the “Bretton Woods Twins + WTO” or the pillars of global economic governance.
WTO → Creates the rules of trade.
IMF → Provides monetary stability for trade.
World Bank → Finances development to enable trade participation.
5.1 Coordination
WTO, IMF, and World Bank hold joint meetings to harmonize policies.
During crises (e.g., 2008 financial crash, COVID-19), they collaborated on stimulus and debt relief.
5.2 Complementary Roles
IMF stabilizes economies so they can continue trade.
World Bank builds the infrastructure that enables countries to trade.
WTO provides the legal framework that governs trade relations.
6. Case Studies
6.1 Asian Financial Crisis (1997)
IMF provided emergency loans to South Korea, Thailand, and Indonesia.
WTO prevented protectionist measures that could have worsened the crisis.
World Bank financed structural reforms in affected economies.
6.2 Global Financial Crisis (2008)
IMF expanded lending and increased SDR allocations.
World Bank financed countercyclical projects in developing countries.
WTO helped prevent a rise in tariffs and trade wars.
6.3 COVID-19 Pandemic (2020–2021)
IMF mobilized trillions in emergency support.
World Bank financed health programs, vaccine distribution, and digital infrastructure.
WTO monitored export restrictions on medical supplies and promoted trade facilitation.
7. Criticism of Global Economic Governance
Despite their contributions, these institutions face criticism:
Power Imbalance: Rich nations have more influence.
Conditionality and Sovereignty: Loans often reduce national autonomy.
Unequal Benefits: Global trade benefits are not equally distributed.
Environmental Concerns: Development projects sometimes harm ecosystems.
8. The Future of WTO, IMF, and World Bank in Global Trade
8.1 Challenges Ahead
Rise of protectionism and trade wars (e.g., U.S.–China tensions).
Global inequality and debt crises in developing countries.
Climate change and sustainable development needs.
Digital trade and financial technology disrupting traditional models.
8.2 Possible Reforms
WTO: Reform dispute settlement system and include digital trade rules.
IMF: Greater representation for emerging economies, flexible conditionality.
World Bank: Stronger focus on climate resilience and sustainable infrastructure.
8.3 Long-Term Role
Together, these institutions will remain crucial in shaping the global trade system—balancing stability, growth, and inclusivity.
Conclusion
Global trade is the lifeblood of the interconnected world economy, but it requires strong institutions to ensure fairness, stability, and sustainability. The WTO provides the rules, the IMF ensures monetary stability, and the World Bank finances development that enables participation in trade.
Though criticized for inequities and structural biases, these institutions have prevented major global trade breakdowns, facilitated economic growth, and enabled developing nations to integrate into the global economy.
In the future, reforms are needed to make them more inclusive, transparent, and responsive to new challenges such as digital trade, climate change, and inequality. Yet, their centrality in global trading remains undisputed—without them, the world economy would be far more unstable, fragmented, and vulnerable to crisis.
long position on ES!Looking at yesterday‘s price action along with the general set trend of powell cutting interest rates in September and the positive outlook that earnings reports have had on the market. All my analysis suggest a up day tomorrow. even though there is a accumulation within the ROT model, I would say we would push out of the 6523 range and enter into the 40s and 50s before returning to lower liquidity!

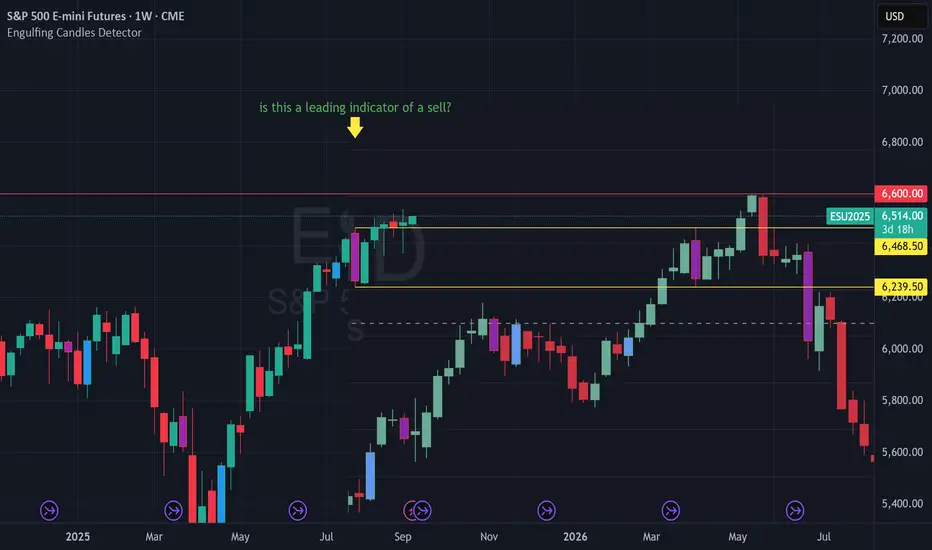
Is the Risk about to be a sell? Put an old pattern of gold from last fall up next to ES. Both have a striking similarity with a Bearish Engulfing pattern and price struggling to move past. Is that bearish engulfing weekly a leading indicator of a pretty sizable dumpster fire coming?
Day 25 — Trading Only S&P Futures | Gold’s Rally Raises FlagsWelcome to Day 25 of Trading Only S&P Futures!
Today started strong with an overnight short and continued by taking longs at major support levels. With the FOMC blackout period in effect, I leaned bullish but stayed selective, waiting for the 5-min MOB to hit before entering. That trade paid off and I wrapped the day at +264.83.
Still, there’s a cautionary note: gold just hit a record high above $3,633/oz, and that could be signaling underlying stress in the markets. Something to keep an eye on as we move forward.
🔑 Key Levels for Tomorrow
Above 6480 = Remain Bullish
Below 6465 = Flip Bearish
📰 News Highlights
SPOT GOLD EXTENDS GAINS, LAST UP 1.3% TO HIT A RECORD HIGH OF $3,633.65/OZ

Buyers have returned.Buyers have returned on the daily chart in the S&P 500. The challenge will be can they follow through the next objective to the upside is 6530.
