Upside continuation or retest and breakdown?Waiting to see how price holds in the 6430 range. Possible continuation to 6480 and back down to 6380.
SPX500H2026 trade ideas

Day 21 — Trading Only S&P Futures | -$417 Tilted LossDay 21 — Trading Only S&P Futures | -$417 Tilted LosWelcome to Day 21 of Trading Only S&P Futures!
Today was a tough one — I turned a positive morning into a -417.18 loss.
I started the day green, up about +150, but made the mistake of assuming the market had already bottomed at 6384. When it broke lower to 6374, I got stopped out at the true bottom of the day.
Frustration set in, and I tilted. I put on a 10-contract short at the MOB, expecting a rejection, but the EOD MOC imbalance and strong news from Google pushed the market higher, blowing past my stop.
The lesson today? Don’t fight the market, and never size up when you’re on tilt.
📰 News Highlights
DOW ENDS DOWN 250 POINTS, VIX JUMPS AS STOCKS DROP TO KICK OFF SEPTEMBER
🔑 Key Levels for Tomorrow
Above 6465 = Flip Bullish
Below 6450 = Remain Bearish

ES - September 3rd - Daily Trade Plan September 2nd - 4:10pm - Update & Trade Plan
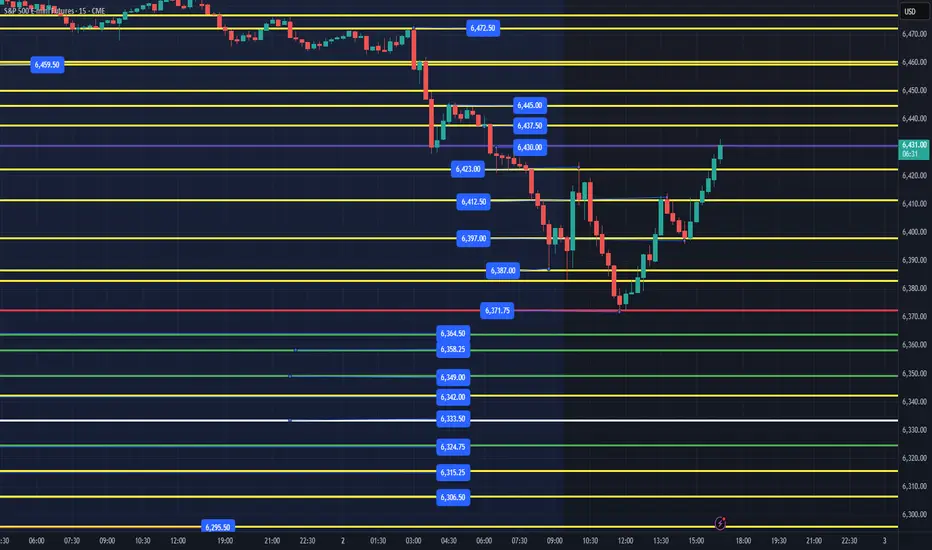
I said last night that " Below 6459 and we will need to most likely get out the way and let price flush a few levels". That we did overnight right before the European open, we flushed 6459 and could not reclaim the level, then tested last week's 6430 level, bounced around 20pts and flushed again down to 6382, bounced and back tested the 6423 resistances. I posted a note at 11:20am EST " IF, price can't hold 6383, look for a flush to 6372, 6358 and a reclaim of those levels above. At 11:53 we flushed down to 6371.75 and started to build a nice base and then went higher the rest of the session. Where are we closing? Right into the 6445 resistance that is important to clear to keep things moving higher!
Plan for the overnight session/tomorrow am as follows:
Our first support down is 6421, 6412 then 6397. Ideally, overnight we can pull back to the 6383-86 level, flush, then reclaim or even better, flush 6371.75 then reclaim for continuation higher.
I did say yesterday that "I am still bullish above 6390, but a break below this level would be a warning to the current trend." We broke below and recovered it today. We could have another bounce left in the tank at the levels discussed above but would ideally see a slow grind into those areas, and not a big flush. Pretty simple for tomorrow, still cautiously bullish until we clear the 6455 level that we broke down from last night.
My lean is we chop around overnight between 6445-6397 with 6385-87 the lowest we would want to chop down to, or we will most likely need to retest 6371 sessions low. IF, we lose the session low, the levels below are of interest and level reclaims will be expected bounces higher. IF, price is flushing, 6368-64, 6333.50 are the 2 big levels of interest to me.
I will send out an update tomorrow around 6am EST after price digests the overnight session.
selling opportunity at market edge for downtrend continuation 1->3 : 2 is proven sellers
3->4 : return to proven sellers
what next?
* hidden divergence
* obv trendline uptrend rejection,
potential sellers entry
* zone trading 76% accuracy if close
below

Bearish autumn NQ and ESThis autumn will give us a retracement on the indicies in my opinion. We have seasional tendencies for bearishness and divergence on the weekly and daily charts on the tops.

Core PCE to Wrap the WeekEquity markets are trending lower to finish out a week that came with a vast slate of earnings and economic data many traders have been waiting for. We saw NVIDIA earnings, GDP, and finished the week today with the Fed’s preferred inflation indicator Core PCE, which came right in line with expectations at 2.9%, which was a slight increase over last month. The Nasdaq is leading the equities lower trading down near 1.4% and the S&P and Russell saw small losses after the S&P hit a new record high this week.
Overall this month, the S&P, Nasdaq, Gold and Silver were able to carve out a new all time high price this month and came off of those levels slightly to finish the week and month out. As it stands now, the market is pricing in a 25-basis point interest rate cut near 85% for the September meeting, so traders will be more concerned about how hawkish or dovish Powell sounds after the report comes out for future rate cuts. Next week, we will get more data on manufacturing, jobs, nonfarm payrolls, and unemployment that could add additional volatility to these markets that have been trending higher as of late.
If you have futures in your trading portfolio, you can check out on CME Group data plans available that suit your trading needs tradingview.com/cme/
*CME Group futures are not suitable for all investors and involve the risk of loss. Copyright © 2023 CME Group Inc.
**All examples in this report are hypothetical interpretations of situations and are used for explanation purposes only. The views in this report reflect solely those of the author and not necessarily those of CME Group or its affiliated institutions. This report and the information herein should not be considered investment advice or the results of actual market experience.
Futures Slip From Highs as Trend Width Flattens, Bias Still UpMarket Overview:
Pullback day near recent highs: breadth softens (12–2), trend width remains wide but begins to flatten, and futures hold above the first momentum threshold with corrective zones well below.
Bullish/Bearish Trend Analysis
Trend Condition:
Bullish Trends: 12
Bearish Trends: 2
Overview: The market is bullish, with 12 trend lines signaling upward momentum, though two bearish lines appear—showing a mild softening in breadth.
Trend Condition
Current Trend State:
The 14-line trend stack is slightly compressing versus yesterday.
Width: Wide—elevated, beginning to flatten.
Implication: Wide-but-flattening often precedes consolidation; a re-widening would argue for continuation.
Price Action and Momentum Zones
Current Price and Change:
Currently, the S&P 500 Futures are at 6,423.00, down by 51.00 pts or 0.79%.
Market Behavior:
Orderly pullback from recent highs; buyers faded, sellers testing the upper momentum band but no decisive breakdown.
Momentum Zones:
Price remains above the 23.6% threshold (6,123.92), the bullish momentum zone. The 38.2%–61.8% band at 5,877.04–5,477.96 is the countertrend, corrective demand area on deeper weakness.
Fib Retracement Levels
Current Position Relative to Levels:
The market is above the 23.6% Fib retracement.
Key Fibonacci Levels:
23.6% → 6,123.92
38.2% → 5,877.04
50.0% → 5,677.50
61.8% → 5,477.96
Analysis:
Staying above 6,123.92 preserves bullish momentum. Continued compression or a close beneath momentum support would shift focus toward the corrective band.
Overall Market Interpretation
Uptrend intact but cooling at the top of the range. Slight breadth deterioration and a flattening stack raise consolidation risk unless trend width re-expands and buyers reclaim control.
Summary
The tape slipped from recent highs with breadth easing to 12–2. Trend width is still wide but flattening, keeping the bias modestly bullish while increasing the odds of a short consolidation if compression deepens.

S&P500 about to BREAK downLook at the chart, its very EVIDENT. with this overbought and bullish sentiment, i expect the markets to CORRECT further. its still extreme greedy. You can see the support lines. S&P can correct somewhere between 5-9%. Be prepared.
SP:SPX TVC:SPX CBOE:SPX SPREADEX:SPX CBOE:XSP

S&P 500 (ES) Nearing Diagonal Wave 5 CompletionOn August 2, the S&P 500 E-Mini futures (ES) pulled back to 6239.50, marking the low of wave 4. Wave 5, now underway, is unfolding as a five-wave diagonal pattern. A defining trait of a diagonal is the overlap between wave ((i)) and wave ((iv)) within its internal structure. From the wave 4 low, wave ((i)) peaked at 6508.75, followed by a retreat to 6362.75, concluding wave ((ii)). The index then resumed its upward trajectory in wave ((iii)), which itself contains a five-wave subdivision. From wave ((ii)), wave (i) reached 6424.25, and a brief dip to 6364 completed wave (ii).
The index climbed again in wave (iii) to 6496.25, with a subsequent pullback in wave (iv) ending at 6430.75. The final leg, wave (v), concluded at 6523, completing wave ((iii)). Wave ((iv)) then unfolded as a zigzag Elliott Wave structure. From wave ((iii)), wave (a) dropped to 6488.75, wave (b) rallied to 6505.75, and wave (c) declined to 6455.5, finalizing wave ((iv)). In the near term, as long as the pivot low at 6363 holds, any dips should find support in a 3, 7, or 11-swing pattern, setting the stage for further upside. This outlook supports continued bullish momentum in the index.

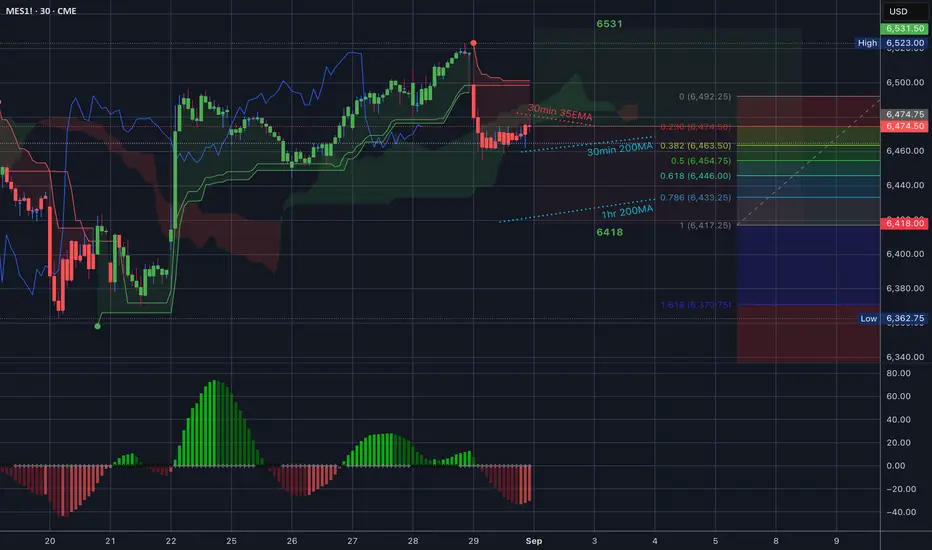
$MES_F $ES_F Trading Range for 9.2.25
Ok, so we are heading into tomorrow after the three day weekend a little bearish. Friday every candle printed red and the 35EMA is above us facing down so definitely look to that as resistance.
30min 200MA underneath us still facing up so we could see a technical bounce there, you can see that extended hours are sitting right on top of that level.
And way at the bottom of the trading range we have the 1hr 200MA - good to know that’s there.
Let’s go, y’all. I have officially been converted into a futures trader so new regular ticker right here.
Short ES to Last Week's LowES is looking heavy with a steady decreasing Cumulative Volume Delta this evening. There is a 500 order block sitting at last week's lows just below 6430, so I'm thinking we head down to that level and test the support there.
Day 20 — Trading Only S&P Futures + Monthly resultsWelcome to Day 20 of Trading Only S&P Futures!
Today’s session was all about patience and letting levels do the work.
I started with the X3DD sell signal, but the move was too fast to size in big. Instead, I waited for price to break under 6485 (yesterday’s level) and added a couple of short positions. Later, I shifted focus to the 6463 bottom support — went long there a few times and those trades worked out great.
By holding discipline and repeatedly trading around these levels, I closed the day with +365.28.
📌 This video is going up a little late — I’ve also asked ChatGPT to analyze my last month of trading data to highlight win rates, patterns, and improvements. That deeper analysis is also in the video.
Here's the prompt
"I have trade data from the last month that I’d like you to analyze. Please perform a detailed data analysis and highlight interesting insights, such as patterns, strengths, weaknesses, and potential improvements in my trading approach. A few important notes about my strategy and data: Risk/Reward: I typically trade using a 2x risk to 1x reward setup. This gives me more flexibility to turn trades into winners and avoid stop-loss hunts. Please calculate the win rate I need to achieve to be profitable with this risk/reward ratio. Trade Grouping: My trade count may appear higher than it actually is because sometimes I enter with multiple contracts and scale out at different price levels. If you see trades with the same entry or exit prices, please group them as a single trade. Analysis Goals: Show win rate, average profit/loss, risk-adjusted return, and drawdowns. Identify what worked well and what didn’t. Highlight any tendencies or biases (e.g., time of day, entry type, asset type). Suggest improvements based on the data. Please make the analysis as practical and data-driven as possible."
📈 Key Levels for Tomorrow:
Above 6480 = Flip Bullish
Below 6460 = Flip Bearish

ES - September 2nd - Daily Trade PlanSeptember 1st - 5:55pm EST - Overnight Session & Daily Trade Plan
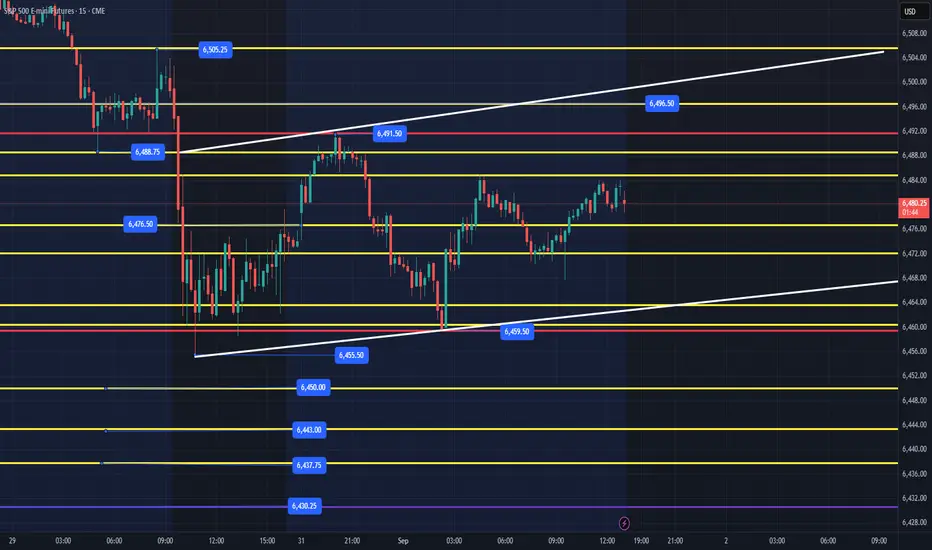
We have a short week with volume picking up moving forward into a seasonally down period. I said on the weekly plan that "Due to low volume on Monday, I do not expect us to get much higher than 6496 in the Monday session, with some headline taking us down Tuesday to 6431 area".
Last night's session our high was 6491.50 and we retested Friday's low around 6459.50. I have put in white a potential bear flag that could continue higher to the 6496.50 level. IF, price does not clear 6505 and hold, we will need to retest the levels below and that could be 6472, 6453 for us to flush and reclaim. Below 6459 and we will need to most likely get out the way and let price flush a few levels, reclaim and back test the 6455-59 zone.
Support levels in yellow that we could flush and reclaim to push higher are as follows:
6455-59, 6450, 6437-40, 6430, 6419, 6411. I believe that 6430 (Last week's low) will give us a good reaction and then 6411 which is the area we broke out from Friday August 22nd. I expect us to have a choppy overnight session with tomorrow's NYSE open giving us direction and hopefully breaking out of this choppy range between 6455- 6496.
I am still bullish above 6390, but a break below this level would be a warning to the current trend.
I will provide an update tomorrow am around 8:30am EST. Check out my Weekly Trade plan in the related publication section to the right.
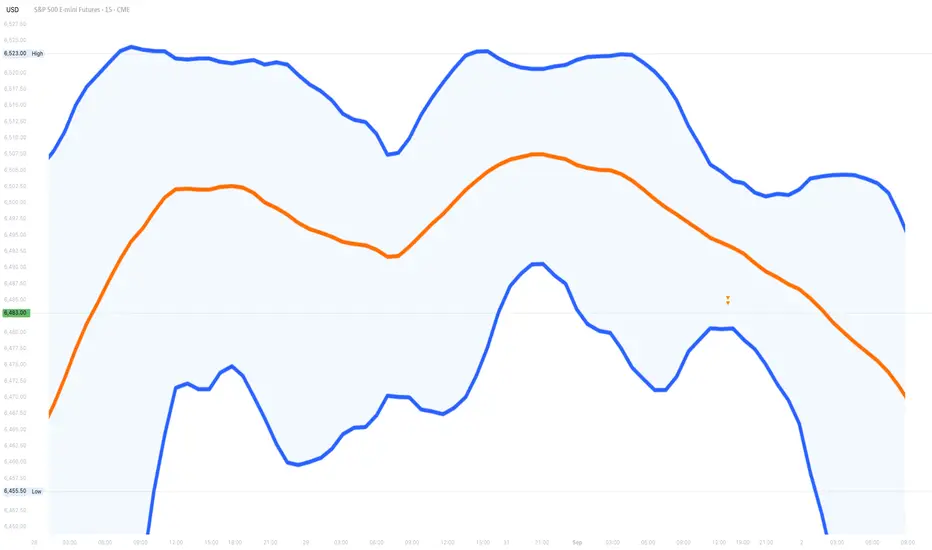
Understanding Bollinger Bands In Trading🔹 1. What are Bollinger Bands?
Bollinger Bands are a popular technical analysis tool used to measure market volatility and identify overbought or oversold conditions. They consist of three lines plotted relative to price movements, helping traders assess price trends and potential reversal points. Developed by John Bollinger in the 1980s, these bands dynamically adjust based on market conditions, expanding during high volatility and contracting during low volatility.
🔹 2. Components
Middle Band (SMA - Simple Moving Average)
The Middle Band is typically a 20-period Simple Moving Average (SMA).
It represents the average price over the selected period and acts as a trend indicator.
Upper Band
The Upper Band is calculated as:
Upper Band=Middle Band+(k×σ)
Where:
kkk is a constant (usually 2)
σ\sigmaσ is the standard deviation of price over the same period
This band represents an area of potential resistance and an overbought condition if the price approaches it.
Lower Band
The Lower Band is calculated as:
Lower Band=Middle Band−(k×σ)
This band represents an area of potential support and an oversold condition if the price nears it.
🔹 3. Role of Standard Deviation in Bollinger Bands
Measuring Volatility
Standard deviation (σ\sigmaσ) is a statistical measure of price dispersion.
Higher standard deviation means larger price swings, causing the bands to expand.
Lower standard deviation means smaller price swings, causing the bands to contract.
Adaptive to Market Conditions
When volatility increases, the bands widen, signaling strong price movement.
When volatility decreases, the bands contract, indicating a consolidation phase.
Identifying Overbought & Oversold Conditions
When price touches the Upper Band, it suggests the asset might be overbought.
When price touches the Lower Band, it suggests the asset might be oversold.
However, these conditions alone do not guarantee a reversal—other confirmations are needed.
🔹 4. History
1. John Bollinger and the Creation of Bollinger Bands
John Bollinger is a financial analyst, trader, and technical analyst. He is the president of Bollinger Capital Management and a Chartered Market Technician (CMT). He has written books and conducted extensive research on market analysis, risk management, and trading strategies.
2. How Did He Develop Bollinger Bands?
In the late 1970s and early 1980s, traders commonly used fixed-percentage bands, which plotted price channels around a moving average. However, these bands were ineffective because they did not account for changing market volatility.
John Bollinger introduced the concept of standard deviation to measure volatility and dynamically adjust the bands. His key contributions were:
Using a moving average (typically 20-period SMA) as the base.
Calculating upper and lower bands by adding and subtracting a multiple (usually 2) of the standard deviation from the moving average.
Recognizing that market volatility changes over time, meaning bands should expand and contract accordingly.
This approach allowed traders to identify periods of low and high volatility, trend reversals, and breakout opportunities with much greater accuracy.
🔹 5. How Bollinger Bands Work
Bollinger Bands are a technical analysis tool designed to measure market volatility and identify potential trading opportunities.
They consist of three lines:
Upper Band – The Middle Band plus two standard deviations.
Middle Band – A 20-period Simple Moving Average (SMA).
Lower Band – The Middle Band minus two standard deviations.
These bands dynamically adjust to price movements, expanding and contracting based on market volatility. The wider the bands, the higher the volatility, and the narrower the bands, the lower the volatility.
🔹 6. Bollinger Bands Formula
Bollinger Bands are built upon a statistical concept called standard deviation, which measures the dispersion of prices from their average. This allows the bands to expand and contract dynamically based on market volatility.
🔹 7. Interpreting Bollinger Bands
1. Identifying Overbought and Oversold Conditions
Bollinger Bands are widely used in trading because they provide insights into market conditions, trend strength, and potential reversal points.
Overbought Condition: When the price touches or moves above the Upper Band, it may indicate that the asset is overbought, meaning the price has risen too far, too fast. Traders may anticipate a pullback or a trend reversal. However, if a strong uptrend is in place, the price may continue to "ride" the Upper Band.
Oversold Condition : When the price touches or moves below the Lower Band, it may indicate that the asset is oversold, meaning the price has fallen too sharply. This may signal a potential buying opportunity, especially if other indicators confirm it.
📌 Important: Just because the price touches an outer band does not guarantee a reversal. Always use Bollinger Bands with other indicators, such as RSI (Relative Strength Index) or MACD (Moving Average Convergence Divergence), for confirmation.
2. Understanding Price Action Near the Bands
Strong Trends:
If the price moves along the Upper Band during an uptrend, it suggests strong bullish momentum.
If the price moves along the Lower Band during a downtrend, it indicates strong bearish momentum.
Reversal Signals:
If the price moves outside the bands and then quickly re-enters, it may signal a trend reversal.
This can be useful in spotting fake breakouts or exhaustion moves.
Mean Reversion:
Prices tend to revert to the Middle Band (SMA) after touching the Upper or Lower Band.
Traders use this principle to buy near the Lower Band and sell near the Upper Band in ranging markets.
3. Understanding Market Signals
Support & Resistance
If the price is above a band, it may act as support.
If the price is below a band, it may act as resistance.
Trend Analysis
Uptrends: Rising middle and upper bands. Downtrends: Falling middle and lower bands. Consolidation: Flat bands signal sideways movement before a breakout.
Compression & Expansion
Compression (bands tighten) breakout. Indicates low volatility before a breakout.
Expansion (bands widen) → trend continuation. Confirms volatility increase and trend continuation.
🔹 8. Strategies
1. Squeeze Strategy
The Bollinger Band Squeeze occurs when the bands contract tightly, indicating low volatility.
This signals a potential breakout, but it doesn’t predict the direction.
How to Trade the Squeeze
1. Identify when the bands are narrowing after a period of expansion.
2. Wait for the price to break above the Upper Band or below the Lower Band with strong momentum.
3. Enter a trade in the direction of the breakout.
4. Confirm the breakout with other indicators like RSI or MACD to avoid false signals.
5. Set stop-loss orders near recent price consolidation areas.
📌 Example:
If the price breaks above the Upper Band, enter a long position (buy).
If the price breaks below the Lower Band, enter a short position (sell).
✅ Best for: Trending markets, breakout traders.
2. Breakout Strategy
A breakout occurs when the price moves outside the bands, signaling strong momentum.
Traders use this as an opportunity to ride trends rather than fade them.
How to Trade the Breakout
1. Look for the price to close outside the Bollinger Bands (not just touch them).
2. Enter a trade in the direction of the breakout after confirming with volume or another momentum indicator.
3. Place a stop-loss near the Middle Band or recent swing low/high.
4. Exit the trade when the price starts consolidating or shows a reversal pattern.
📌 Example:
If a stock closes above the Upper Band, enter a long trade.
If a stock closes below the Lower Band, enter a short trade.
✅ Best for: Trend-following traders, breakout traders.
🔹 9. Key Takeaways
Structure : Bollinger Bands consist of three lines —middle band (SMA), upper band (SMA + 2 * standard deviation), and lower band (SMA - 2 * standard deviation).
Volatility Signals : The bands expand during high volatility and contract during low volatility, helping to identify potential breakouts or consolidations.
Trend Indicators : The middle band acts as a trendline, with prices above it indicating an uptrend and below it suggesting a downtrend.
Support and Resistance : The upper and lower bands typically act as dynamic resistance and support levels, respectively.
Mean Reversion : In range-bound markets, prices tend to revert toward the middle band, offering potential entry points.
Combination With Other Indicators : Bollinger Bands work best when used with other tools like RSI or Moving Averages to confirm signals and enhance trading strategies.
Quiet holiday marketThe shortened session in the S&P 500 for Monday was relatively quiet for a holiday market. This implies an up move for Tuesday.

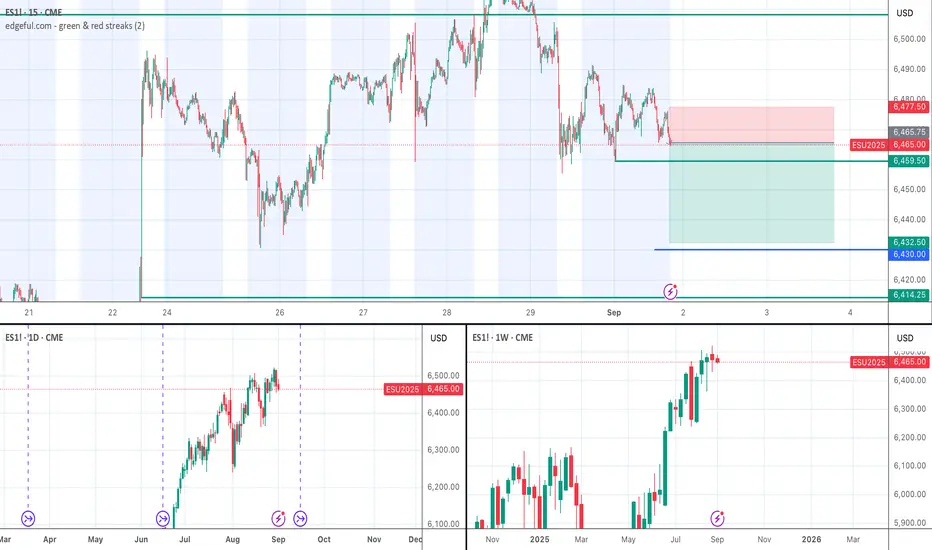
ES breakdown, bullish lookfollowing market structure after just making a new high, market corrects and find support to start creating new higher highs on 4h time frame signaling what it seems to be a continuation towards new all time high. bullish outlook for the week,
on the opposite scenario, break bellow 6,460 with a full body 4h candle closing bellow could signal the down trend

ES Analyses (Sep 1–5), Fundamental, Key Zones, SetupsShort holiday week. U.S. cash equities are closed Mon Sep 1 for Labor Day. ES trades a holiday schedule and then normal hours from Tue.  
Key releases (ET):
• Tue Sep 2, 10:00 — ISM Manufacturing (first business day).  
• Thu Sep 4, 8:15 — ADP Employment Report.  
• Thu Sep 4, 8:30 — Weekly jobless claims. 
• Thu Sep 4, 10:00 — ISM Services (third business day). 
• Fri Sep 5, 8:30 — Nonfarm Payrolls (Employment Situation). 
Plan to sit out the first 10 minutes around each print.
Big picture
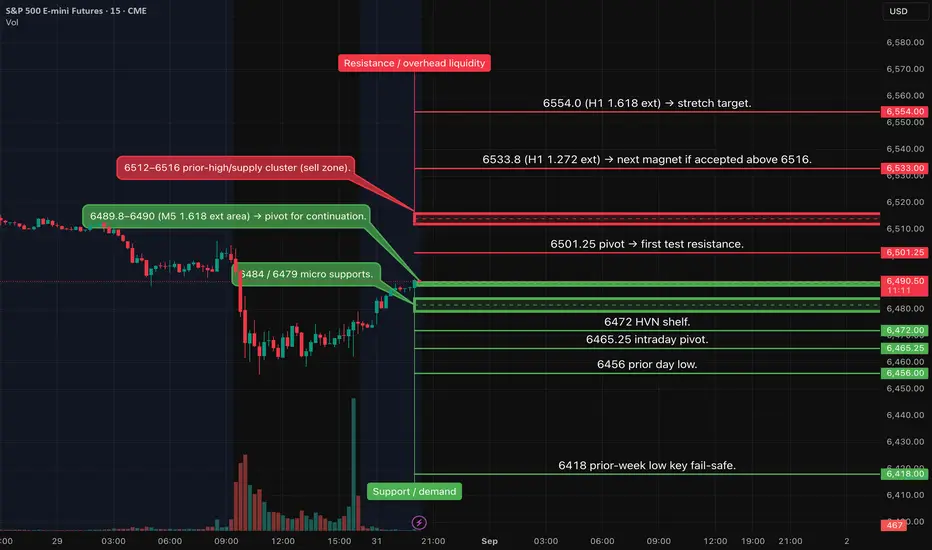
I’m treating 6512–6516 as the week’s decision zone. Acceptance above it opens 6533–6535 → 6554. Lose 6454 on a confirmed close and the door opens to 6418. While above 6418, I keep a neutral-to-bullish bias. (Levels are from my charts.)
Key levels I’m trading around
Overhead liquidity
• 6501.25 pivot
• 6512–6516 prior supply and decision zone
• 6533–6535 H1 1.272 extension
• 6554 H1 1.618 extension
Support
• 6490 continuation pivot
• 6484 / 6479 micro supports
• 6472 HVN shelf · 6465.25 pivot
• 6456 prior low · 6454 fail-safe
• Guardrail: 6418
Playbook (casual, but A++ rules still apply)
30m trend aligned, 15m momentum-on-structure, 5m close to confirm. Risk 6–8 pts. TP1 ≥15 pts. No trades during data prints.
1) Continuation LONG above 6490
Look for a 15m close above 6490, quick check that bids are holding >6484, then a 5m confirmation to enter 6489–6492.
• SL: ~6485
• TP1: 6506 (+15) → scale
• TP2: 6512–6516, TP3: 6533–6535
• Invalidation: 15m bearish close back under 6484
2) Rejection SHORT at 6512–6516
If we poke the zone and print a 15m bearish close <6508, I want a 5m confirm to work 6508–6514 short.
• SL: 6517–6519
• TP1: 6493–6496 (+15)
• TP2: 6484 → 6472, TP3: 6465 → 6456
• Invalidation: 30m acceptance >6516
3) Breakdown SHORT below 6454
If a 15m bar settles <6454 and retest fails, I’ll use 6454–6457 for entry.
• SL: 6460–6462
• TP1: 6439 (+15)
• TP2: 6418, TP3: 6405–6395
• Invalidation: Swift reclaim >6462
Management notes
Trade windows 9:45–11:30 ET and 13:30–15:30 ET. Scale half at TP1. Move stop to breakeven only after structure breaks or a 15m/30m close through TP1. I don’t add fresh longs straight into 6512–6516 unless we’ve got 30m acceptance.
S&P 500 (ES1!): Short Term Sells For Longer Term Buys TargetsWelcome back to the Weekly Forex Forecast for the week of Sept 1 - 5th.
In this video, we will analyze the following FX market: S&P 500 (ES1!)
The S&P500 has been strong, but gave a bearish close on Friday. Looking at the Daily, it is easy to see price is retracing lower, perhaps to the +FVG, which is a great place to look for longs once contacted.
Short term sells are permissible, but be mindful the HTFs are bullish.
Enjoy!
May profits be upon you.
Leave any questions or comments in the comment section.
I appreciate any feedback from my viewers!
Like and/or subscribe if you want more accurate analysis.
Thank you so much!
Disclaimer:
I do not provide personal investment advice and I am not a qualified licensed investment advisor.
All information found here, including any ideas, opinions, views, predictions, forecasts, commentaries, suggestions, expressed or implied herein, are for informational, entertainment or educational purposes only and should not be construed as personal investment advice. While the information provided is believed to be accurate, it may include errors or inaccuracies.
I will not and cannot be held liable for any actions you take as a result of anything you read here.
Conduct your own due diligence, or consult a licensed financial advisor or broker before making any and all investment decisions. Any investments, trades, speculations, or decisions made on the basis of any information found on this channel, expressed or implied herein, are committed at your own risk, financial or otherwise.

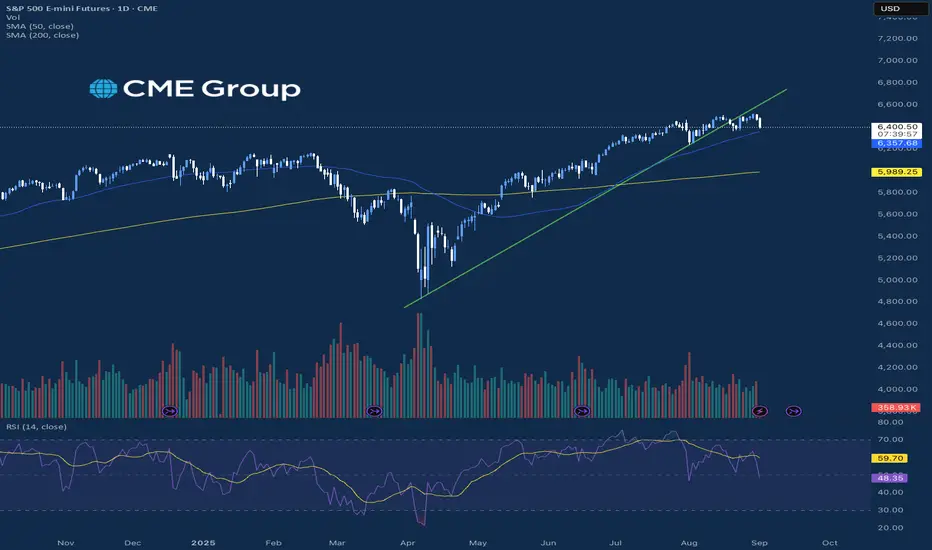
S&P 500 Index (01.09.2025)The S&P 500 futures have once again advanced over the past month, reaching a new all-time high. From a technical perspective, the market is currently in overbought territory, which leaves room for a potential pullback. In such a scenario, the index may test the support level around 6,000.
Another factor supporting the case for a correction is the fact that from August through October, equities typically exhibit seasonal weakness. Nevertheless, the long-term trend remains firmly bullish.
Long-term trend: Up
Resistance level: 6,500
Support level: 6,000

MES1! WEEK 36 AUG 24TH Looking for MON, TUE, WED to create high of the week at the AUG 29th 6A.M Bearish OB. The Head towards the 3H Equal Lows.
IF price break above the OB then you will need to sit back and reassess. Possibly look for higher prices.
CALANDER EVENT
TUES
-10AM - PMI (HIGH)
WED
-7AM - 30-YEAR MORTGAGE RATE (MED)
-9AM - FED SPEACH (MED)
-10AM - JOLT's JOB OPENING (HIGH)
THUR
-10AM - PMI (HIGH)
-12PM - OIL/GAS (MED)
FRIDAY
-8:30AM - NFP / UNEMPLOYMENT RATE
STOCK
Look to place a Put at the time price trades to the 3H OB.

ES-Weekly Trading Plan - September 1st-5thSaturday August 30th - 10:41am EST
We have a short week with futures open for half day on Monday due to USA Labor Day Holiday. I expect light volume on Monday with price not telling us much until we see institutions at their desks on Tuesday.
I said last week the following - (You can also see this on the related publication section)
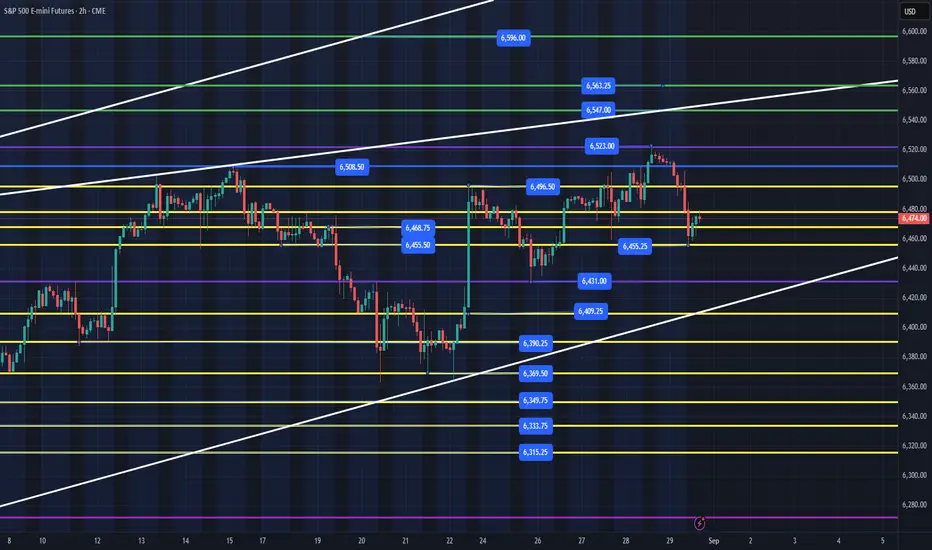
"When you look at the 2hr, 4hr, 8hr chart and zoom out, you can see that the trend is up and that we will probably need to digest Friday's rally and most likely chop around ideally above 6468, 6452 levels with 6429 being the lowest level we would want to test. Then we can retest the 6508 level and continue higher this week with 6522, 6547 my main targets with 6596 if bulls really want it.
IF, we lose 6369, my lean is that we will continue lower and a new market trend could be starting to unfold with 6245 the big area for us to hold to stay bullish in the bigger picture."
Recap of last week - 6430 was the low for the week (never get close to 6369) that got bought up on Sunday evening and we rallied up to the 6522 targets by Thursday. My daily trade plan kept us moving higher all week. I did not post Thursday night/Friday as I was off my desk. We are still in a bullish uptrend and until 6369 is lost, we must focus on trend.
-----------------------------------------------------------------------------------------------------
What is the plan for this week? Since Monday is a short session and will be low volume, I will not be trading and will enjoy time with my family. Ideally, I am looking for a pullback down to the 6431 or tag the white trend line and recover the next level above. Due to low volume on Monday, I do not expect us to get much higher than 6496 in the Monday session, with some headline taking us down Tuesday to 6431 or the white trend line (I will have better idea after the close on Monday) and will have more details in my daily trade plan for Tuesday.)
I do believe we can still rally up to 6547, 6563+ this week, but IF, we lose the 6369 level, that would be a big blow to bulls, and it would need to be sharp reclaim back inside the white trendline to keep momentum.
Overall, we should continue up the levels and get to new highs by end of the week. IF, we lose 6369, I will wait for failed breakdowns below at the levels in Yellow. Remember that when ES wants to sell off, it's better to get out the way and let it build a new base. We had buyers step in on Friday at 6455, so any flush and reclaim of that level Monday would be a good setup.
Tuesday Daily Trade Plan will come out after the close on Monday or before the 6pm EST evening session open.
Inside dayThe expectation for trade behavior on Monday, September 1 for the S&P 500 daily chart is trading inside the range from the Friday session.

The end - 2026 Financial panicSince 2300, I’ve marked a zone and made a personal commitment: no matter what happens in the market, when this zone is approached, I will begin reducing my exposure and carefully exit all financial markets—with extreme caution and tight stop losses.
Yesterday, I received an alert I never expected to see. It signaled the approach of the zone I identified back in 2021 as the escape point—where major crashes are likely imminent and the urge to invest must be resisted.
This zone aligns with the 0.786 trend-based Fibonacci level from the 2009 bottom to the 2020 peak, as well as the April 2020 bottom. It also coincides with the 2.618 and 3.618 Fibonacci extensions from the 2007–2010 cycle, and the 3.618 trend Fibonacci from the 2002–2009 cycle. But that’s not all.
According to Gann’s Square of 9, if you examine closely, you’ll notice that whenever the trend reaches one of its primary or secondary angles since the 2009 bottom, it consistently triggers a significant drop. The end cycle at the 360° angle corresponds to 7926—perfectly aligning with all the previously mentioned Fibonacci zones.
And for those skeptical of technical analysis, consider this: the upcoming year, 2026, is a pivotal year in the Samuel Benner chart developed in 1875 to identify periods of financial disorder. Benner’s chart indicated when to buy, when to sell, and when to expect chaos. Remarkably, it has accurately forecasted major financial crashes over the past 150 years—including the Great Depression, the Dot-Com bust, and the 2020 COVID crash. According to this chart, selling during the crash year and re-entering post-crash has historically led to profitable outcomes with a +-2 Years at a 87.5% accuracy.
When you combine all these signals, it feels reckless not to take them seriously—especially since this marks the end of a cycle measured from 2009. That’s how significant it is.
To those who dismiss technical analysis, this may sound like smoke and mirrors. But for those who’ve seen its power firsthand, the sheer number of confluences here is too substantial to ignore. If I know such big crash may happen - I would be happy to wait 1-2 years on cash and take opportunity of big red markets to buy.
Curious to hear your thoughts on this.
