Positive attitudeThe daily price action on Thursday in the S&P 500 indicates a positive attitude of the market going into Friday's labor numbers. It will be interesting to see if buyers follow through with a positive close going into the weekend.
SPX500H2026 trade ideas

Day 23 — Trading Only S&P Futures | +$200 & New Daily RuleWelcome to Day 23 of Trading Only S&P Futures!
I locked in +200.45 on my competition account by shorting the MOB overnight and walking away once my target was hit. Later in the day, I came back to watch and ended up losing on other accounts — which sparked an important realization.
From now on, I’m considering a rule: cap daily gains at 10% of account balance.
For example, with a $2,000 account, my daily target should be $200 max. Anything more means overtrading, staying in the market too long, and risking unnecessary drawdowns.
This might be the structure I need to keep consistent results.
📰 News Highlights
U.S. JOB CUTS TOTAL 85,979 IN AUGUST, HIGHEST FOR THAT MONTH SINCE 2020 — CHALLENGER
🔑 Key Levels for Tomorrow
Above 6470 = Remain Bullish
Below 6450 = Flip Bearish

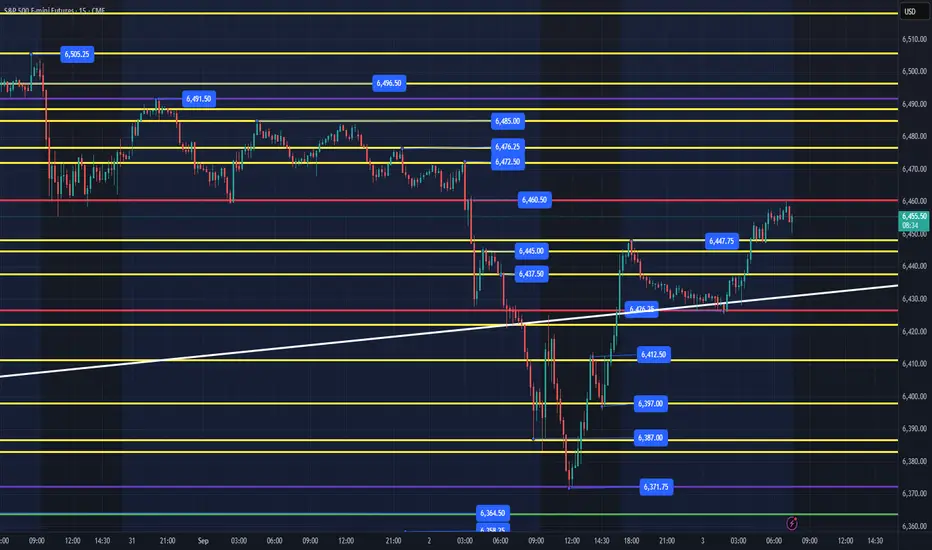
ES - September 5th - Daily Trade Plan - Evening SessionSeptember 4th - 7:15pm
In today's daily trade plan, I said - "Ideally, we lose 6454, flush and reclaim for a move higher. I expect another choppy day, and we need to clear 6491 to keep this rally moving higher."
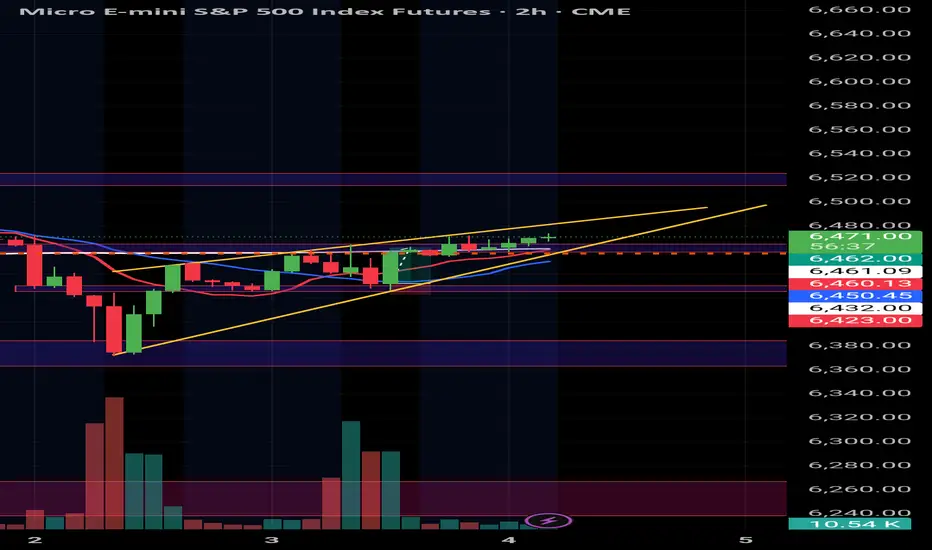
At 10:16am price dropped down to 6456.25 and took off higher. You can look at a 4hr chart and see the institutional accumulation that has been happening. You can look at my weekly trading plan in which I stated -
"I do believe we can still rally up to 6547, 6563+ this week, but IF, we lose the 6369 level, that would be a big blow to bulls, and it would need to be sharp reclaim back inside the white trendline to keep momentum."
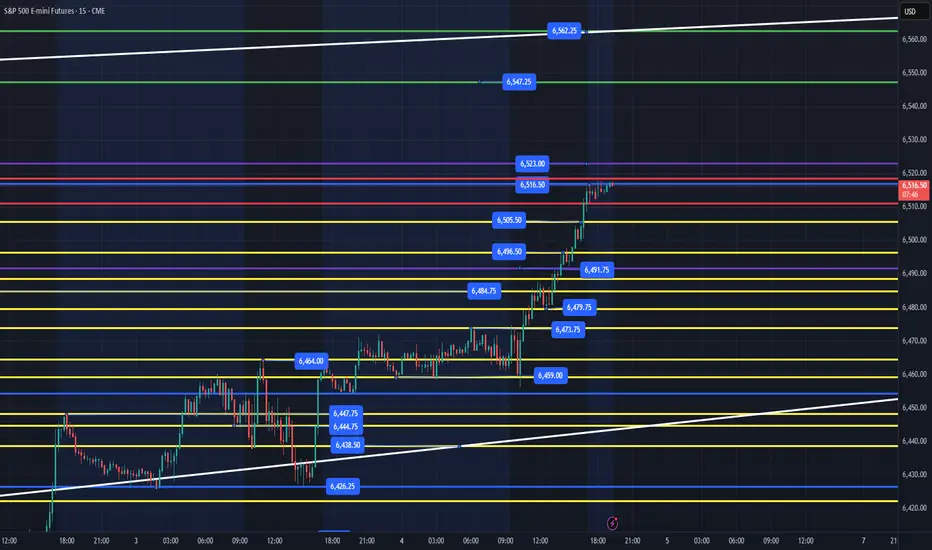
What did institutions do so far this week? Flush the white trendline, run stops, accumulate and we are heading higher. 6523 is the next big resistance with 6547, 6563 still in play. Price needs to hold 6473 with 6455 being the lowest for us to keep moving higher. Employment report out tomorrow am and usually the initial move will be a fake out. I don't trade prior to the employment report and usually wait until after the NYSE open to evaluate and find a spot to get some points. Since we have closed at highs on the day and we are just going sideways, the best levels that I will be looking for a flush and reclaim would be the 6491 level as it was the high of this week during the Sunday evening session. We could dip down to 6473/79 levels and then rally.
My lean is we grind sideways and up into the 6523 level overnight and then we will need to wait for the employment report and NYSE to try and get some level losses and reclaims to finish the week at our targets of 6547, 6563+.
I will post an updated chart tomorrow before 7am EST.
---------------------------------------------------------------------------------------------------------
Couple of things about how I color code my levels.
1. Purple shows the weekly High/Low
2. Red shows the current overnight session High/Low (New chart out in am)
3. Blue shows the previous day's session High/Low
4. Yellow Levels are levels that show support and resistance levels of interest.
5. White shows the trendline from the August lows.

Bullish energy Just an idea …..I mostly scalp. 20-30% targets. Because the market is respecting higher lows, sustaining above moving averages, and showing momentum confirmation, my bias is bullish. I expect that as long as price holds above the most recent support zone, buyers will continue to press toward the next resistance level.

(ES) – Key Resistance at 6475The ES is approaching a significant resistance zone around the 6475 level, which has the potential to act as a short-term cap on price action. Given the current structure and momentum, ES may struggle to break and hold above this area.
This presents a possible short opportunity near 6475, with a tight stop just above the resistance. If this level holds as resistance, we could see a rejection leading to lower levels in the coming sessions.
Monitor price action closely around this zone for confirmation and manage risk accordingly.

Possible flush or continuation?Appears to be forming a falling wedge. Waiting to see how it plays out. Could go either way
ES - September 4th - Daily Trade PlanSeptember 4th - 6:45am EST
In yesterday's post I said "Ideally, we need to hold the 6426 level or flush and reclaim quickly. IF, price can't rally above 6476, my lean is we are in the midst of a change in character of price, and I will be looking lower for levels to flush and reclaim."
We chopped around all day and ended up breaking below the white trend line to 6426, got bought up and then rallied at end of day. Institutions bought it up and we ended up close to the highs of the day.
Couple of things about how I color code my levels.
1. Purple shows the weekly High/Low
2. Red shows the current overnight session High/Low
3. Blue shows the previous day's session High/Low
4. Yellow Levels are levels that show support and resistance levels of interest.
5. White shows the trendline from the August lows.
What is the game plan for today?
Overnight the low was 6454 with us coming into session highs at 6473.75. Ideally, we can flush 6454 and reclaim for a level to level move higher. IF, price sells off below 6454, we will probably need to head back down to the white trendline which is the 6438 level. 6438-6454 will be a chop fest.
Immediate Resistances - 6473, 6476, 6485, 6491 (Weekly High)
Immediate Supports - 6458, 6454, 6438, 6426, 6412
Ideally, we lose 6454, flush and reclaim for a move higher. I expect another choppy day, and we need to clear 6491 to keep this rally moving higher. We also have employment report out tomorrow am. My lean is we keep chopping up today as we head into the report at 8:30am tomorrow.

OTEUM EXPERT CALL: SP500 – Jackson Hole Fade OTEUM EXPERT CALL: SP500 – Jackson Hole Fade 🏔️🐻
We’re looking for a SHORT(s) in spot and options for a macro swing down into Jackson Hole and the immediate aftermath 📉. Plan is to sell rallies into value (red box), ride the drift lower, and bank along staged targets. After that, we’ll be hunting the first-cut squeeze back up 🏦✂️🚀.
Risk: a surprise dovish leak / policy jawbone that front-runs the cut and squeezes shorts. Size smart, trail tight, don’t overstay.
#SP500 #ES #Macro #JacksonHole #ShortSetup #OTEUM

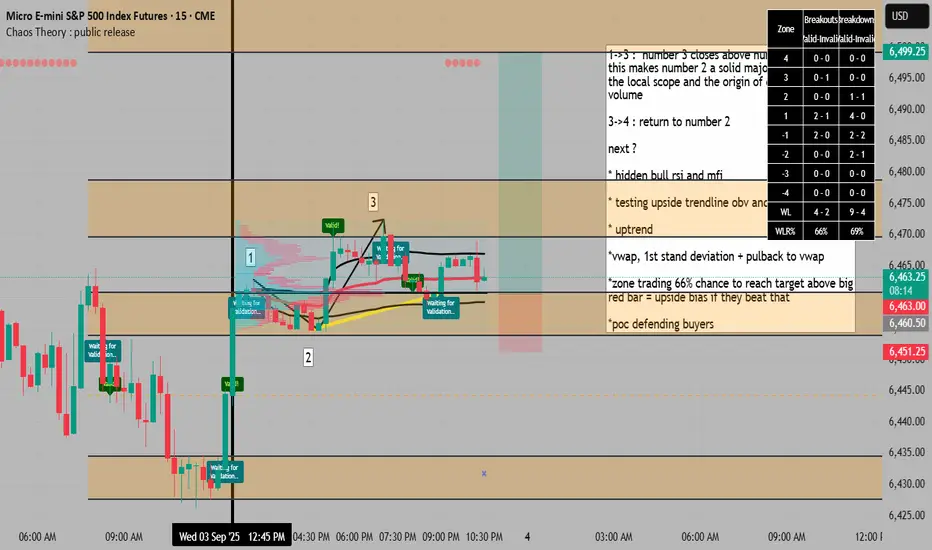
return to proven buyers might be the continuation of trend1->3 : number 3 closes above number 1 ,
this makes number 2 a solid major low in
the local scope and the origin of dominant
volume
3->4 : return to number 2
next ?
* hidden bull rsi and mfi
* testing upside trendline obv and small breaks
* uptrend
*vwap, 1st stand deviation + pulback to vwap
*zone trading 66% chance to reach target above big
red bar = upside bias if they beat that
*poc defending buyers
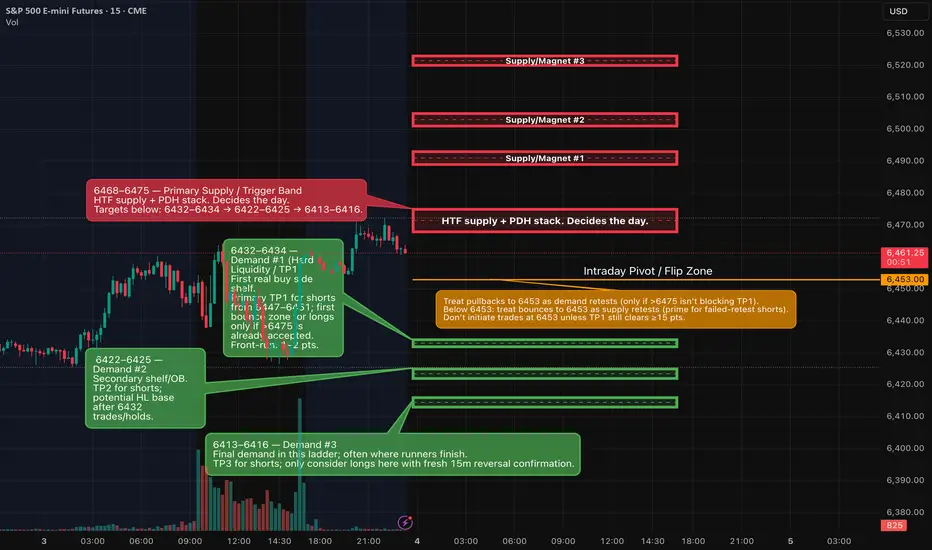
ES (A++) — Intraday Analyses & Setups for Thu, Sep 4, 2025 (ET)We’re parked beneath a well-defined 6468–6475 ceiling. Tomorrow the clean A++ is either: (A) Breakout-acceptance long > 6475 (retest holds), or (B) Rejection short after a test of 6468–6475 that sends price back through 6453 with 15-minute bearish confirmation. TP ladders are mapped to ~6490 / 6501 / 6520 above and ~6432 / 6422 / 6413 below. Trigger-Lock is ON: numbers are frozen once posted.
Weekly/Daily: Pressing prior distribution highs; repeated supply above ~6470–6485; upside extensions show 1.618 ≈ 6489 and 2.000 ≈ 6504 as next magnets.
4H/1H: Recovery from the 6.43k shelf, printing HLs into the ceiling; momentum constructive but unresolved under 6475.
30m/15m: Rangebound day resolved late; resistance band 6468–6475 capped advances; 6453 (Monday Low pivot) is your intraday toggle.
Hard levels to respect
• Ceiling / Trigger band: 6468–6475
• Pivot: 6453 (lose/reclaim toggles bias)
• First downside shelves: 6432–6434, 6422–6425, 6413–6416
• Upside magnets if accepted: 6489–6493, 6501–6505, 6520–6523
A++ Setups
1) Breakout-Acceptance LONG
• Trigger: First 5-minute close > 6475, then a quick retest that holds 6472–6475 (no reclaim < 6470).
• Entry: 6472–6479 on the hold.
• Initial SL: 6466–6468 (≤ 6–8 pts).
• TP1: 6490–6493 (≥ +15 from 6475 → 2.5R with 6-pt risk).
• TP2: 6501–6505
• TP3: 6520–6523
Invalidation: Any 15m close back inside 6468–6475 after acceptance.
2) Rejection-Failure SHORT
• Precondition: Price tests 6468–6475 and rejects.
• Confirm: 15m bearish close < 6466, then a 5m failed retest 6447–6451 (lower high).
• Entry: 6447–6451 on the failed retest.
• Initial SL: 6454–6456 (≤ 6–8 pts).
• TP1: 6432–6434 (≥ +15 from 6449).
• TP2: 6422–6425
• TP3: 6413–6416
Flip: Any 30m acceptance > 6475 cancels shorts and re-arms the long.
Tomorrow’s U.S. calendar (key times, ET)
• ADP National Employment Report: 8:15 am. 
• Initial Jobless Claims: 8:30 am (weekly, DOL). 
• S&P Global U.S. Services PMI (final): 9:45 am (standard PMI schedule). 
• ISM Services PMI: 10:00 am (third business day rule → Sep 4). 
• EIA Weekly Petroleum Status (holiday schedule): 12:00 pm ET (Labor Day shift). 
A conservative update for ThursdayA conservative update for Thursday is expected on the S&P 500 daily chart. The objective to the upside would be 6477 as the market waits for Friday's numbers.

SPX to 8,111 Trump Channel is Established !!!!SPX to 8,111 Trump Channel is Established !!!!
Sell all your bonds

Day 22 — Trading Only S&P Futures & Market analysisWelcome to Day 22 of Trading Only S&P Futures!
Today I kept things simple — waited for the 10am JOLTS report to set direction and only got long after we held the 1-min MOB. Even then, I stayed cautious since price was still under 6465 resistance.
I focused on gamma levels, which played out clean on both the buy and sell side. The only real slip-up was a FOMO long, and that reminded me of an important rule: I should only size up when I’ve got 2+ confirmations. If I take a trade with less, it needs to be 1 contract only — risk management first.
Closed the session with +256.25, ending the day disciplined and green.
📰 News Highlights
U.S. JULY JOLTS JOB OPENINGS FALL TO 7.181M (EST. 7.380M, PREV. 7.357M) — LOWEST SINCE MARCH 2021
🔑 Key Levels for Tomorrow
Above 6470 = Flip Bullish
Below 6450 = Remain Bearish

S&P500: Short-Term Pullback Before Next RallyS&P futures initially slipped yesterday but managed to stabilize soon. Our primary outlook is that the ongoing turquoise wave B will continue to move higher, likely topping out just below resistance at 6,675 points. After that, we expect wave C to drive the index directly into the magenta long Target Zone between 6,082 and 5,650 points, where the low of the wave (4) correction should be established. From there, the impulsive wave (5) is expected to begin, pushing the index above the 6,675 points resistance and completing the broader blue wave (III). Alternatively, there is a 35% chance that the index could break out directly above 6,675 points without first reaching the magenta Target Zone. In this scenario, the index would already be forming the alternative wave alt.(5) in magenta.

idea for S&P500 9/3i wanna play it long as long as market holds on my demand zone or pop up strongly and keep above the last supply around 6.466

Long Setup on ES Futures Near Key Support (6360–6365)Looking to initiate a medium- to long-term long position on ES futures around the 6360–6365 zone. After a multi-day pullback, ES is approaching a well-defined support area.
How the price is approaching this level is a great indication of a potential bounce. This type of setup often leads to a strong reaction off key levels.
Entry Zone: 6360–6365
Stop Loss: 6240
Take Profit 1: 6431
Take Profit 2: 6475

ES - September 3rd - Daily Trade Plan - UpdateSeptember 3rd - 7:25am EST
I wanted to provide an update on today's levels and what has transpired overnight. Price opened around 6448 and grinded down into the white trendline support. This trendline you can also see on the weekly chart (See Related Publications) and yesterday when we dropped below it, we then retested it at 6423 level, tested again in the afternoon to 6426, and we have then back tested it this evening down to 6426 and rallied from there, broke above the overnight high of 6448 and have come into resistance at 6460.
Couple of things about how I color code my levels.
1. Purple shows the weekly High/Low
2. Red shows the current overnight session High/Low
3. Zoom out on a 4hr, 6hr, chart and you will see a trendline from August 22 Low at 6364 which started the massive move to 6496. It is also the same trendline connecting the August 1st low that rallied to 6508. Both levels created rallies that lasted for 200+ pts. That does not mean we will see another rally like that, unless we can reclaim the weekly high of 6491 and then take it level to level from there.
Our first support down is the 6448 level. A flush and reclaim of this level, should take us higher. Each level in yellow are areas that price could flush, recover and climb level to level. My edge as a trader is to try and take 10pts+ out of the market and generally I am looking to do that by flushing a high-quality level, recover and ride it to the next level.
Immediate Resistances - 6460, 6472, 6476, 6485
Immediate Supports - 6448, 6437, 6426, 6412
Ideally, we need to hold the 6426 level or flush and reclaim quickly. IF, price can't rally above 6476, my lean is we are in the midst of a change in character of price, and I will be looking lower for levels to flush and reclaim.
I will send out an update around 10am.
Inside dayThe structure expected for the S&P 500 daily chart is for Wednesday to trade inside of Tuesday's range. It will take new fundamental information to drive volatility in this market.

ES (Sep 3): short pops into 6420–6435; watch JOLTS & Beige BookHTF still skews bearish; intraday bounce stalled into overhead supply. For Wednesday (Sep 3), I’m planning sell-the-pop into 6420–6435 with confirmation. News risk: JOLTS 10:00 ET, Factory Orders 9:00 ET, Fed Beige Book 14:00 ET. ISM Services & ADP are Thursday (not Wed).
HTF bias (top-down)
• Weekly/Daily: Price rolled off the 6.5k zone; momentum flattening; room to probe lower demand in coming sessions.
• 4H/1H: Clean LH→LL sequence; today’s bounce tagged supply, then ranged under it. Bias sell rallies until acceptance above the ceiling.
Key zones I’m using (approx.)
• Supply / short zones: 6420–6435 (NY PM high / intraday OB cluster).
• Hard liquidity / targets below: 6396 → 6378 → 6310–6280 (HTF demand/extension cluster).
• Invalidation / flip line: 6448–6450 (15m/30m acceptance above = stand down shorts; consider flip long on retest).
Numbers reflect my mapping from today’s 30m/15m/5m; execution still needs rulebook confirmation (see below).
A++ setup (primary)
Short the pop into 6420–6435
• Trigger: 15m bearish context plus a 5m bearish close inside the zone (no exceptions).
• Initial stop: 6448 (or last swing high if tighter).
• TPs: TP1 6396 (scale ½) → TP2 6378 → TP3 6310.
• Management: Move stop → BE only after structure break or 15m/30m close through TP1; trail runners by 15m/30m swings.
Flip scenario (only if invalidated)
If we accept above 6448–6450 (15m close + hold), I’ll look long on a retest 6448–6452 toward 6463 → 6476+, provided structure confirms.
Macro calendar (what actually hits Wednesday Sep 3)
• 09:00 — Factory Orders (Jul) (Census M3; FRED calendar lists the release).  
• 10:00 — JOLTS (Jul) (labor demand; BLS schedule). 
• 14:00 — Fed Beige Book (regional conditions; often a volatility nudge). 


Upcoming playLooking for this gap fill and then determine a continued upward direction or breakdown to retest the lower area of the day.

Upside continuation or retest and breakdown?Waiting to see how price holds in the 6430 range. Possible continuation to 6480 and back down to 6380.
