US30 Approaches 47,200 Support as Seasonality Favors Bulls!Hey Traders,
In today’s session, we’re monitoring US30 for a buying opportunity around the 47,200 zone. The Dow Jones remains in a broader uptrend and is currently in a correction phase, approaching a key support and resistance area at 47,200.
We’d also like to highlight the strong seasonal tendency for equities during this period — historically, November has often provided a tailwind for the Dow as market sentiment improves ahead of year-end.
Watching closely for a potential bullish trigger at support.
Trade safe,
Joe.
Trade ideas

US30 showing signs of potential bullish momentumThe US30 index is currently in a phase of price consolidation, showing signs of potential bullish momentum. The recent strong upward movement indicates that buyers are regaining control, and there’s a possibility of further growth continuation if bullish momentum sustains.
On Wednesday, Wall Street’s main indices inched higher following a stronger-than-expected private payrolls report. Additionally, ongoing U.S. tariff court hearings boosted investor sentiment. Meanwhile, technology stocks stabilized after the previous session’s sharp sell-off, helping to support broader market optimism.
If the price reacts positively and rebounds strongly to the upside, we could expect the bullish trend to resume. The next psychological resistance level to watch would be around 47,800, which could act as a potential upside target for bullish traders.
You may find more details in the chart,
Trade wisely best of Luck Buddies.
Ps; Support with like and comments for better analysis Thanks for Supporting.

US 30 should soon to go upafter a healthy correction US 30 should make new highs.
Already according with levels of support we have to be careful when 'Market Makers" will start to buy the dip
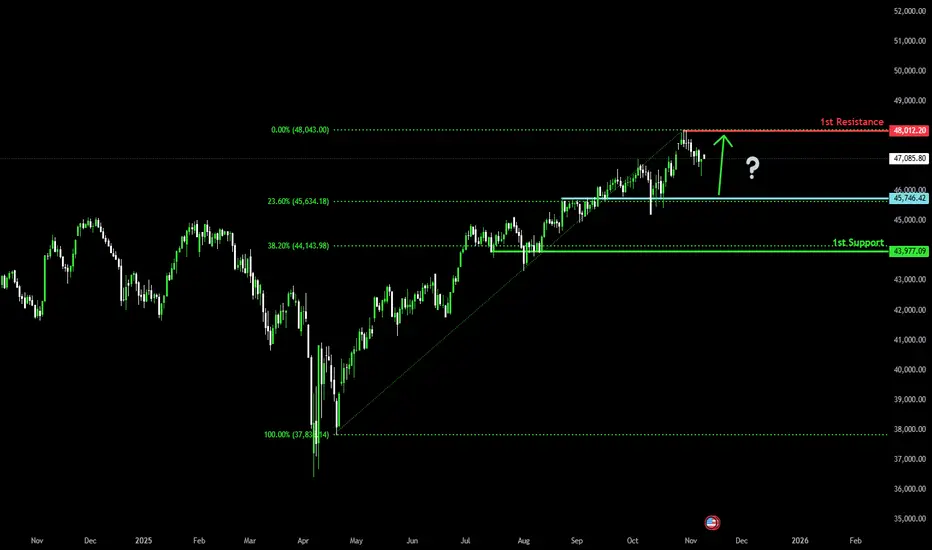
Bullish continuation setup?The Dow Jones (US30) is declining toward the pivot level, which is an overlap support aligned with the 23.6% Fibonacci retracement. A potential rebound toward the recent swing high resistance could occur from this area.
Pivot: 45,746.42
1st Support: 43,977.09
1st Resistance: 48,012.20
Disclaimer:
The above opinions given constitute general market commentary, and do not constitute the opinion or advice of IC Markets or any form of personal or investment advice.
Any opinions, news, research, analyses, prices, other information, or links to third-party sites contained on this website are provided on an "as-is" basis, are intended only to be informative, is not an advice nor a recommendation, nor research, or a record of our trading prices, or an offer of, or solicitation for a transaction in any financial instrument and thus should not be treated as such. The information provided does not involve any specific investment objectives, financial situation and needs of any specific person who may receive it. Please be aware, that past performance is not a reliable indicator of future performance and/or results. Past Performance or Forward-looking scenarios based upon the reasonable beliefs of the third-party provider are not a guarantee of future performance. Actual results may differ materially from those anticipated in forward-looking or past performance statements. IC Markets makes no representation or warranty and assumes no liability as to the accuracy or completeness of the information provided, nor any loss arising from any investment based on a recommendation, forecast or any information supplied by any third-party.
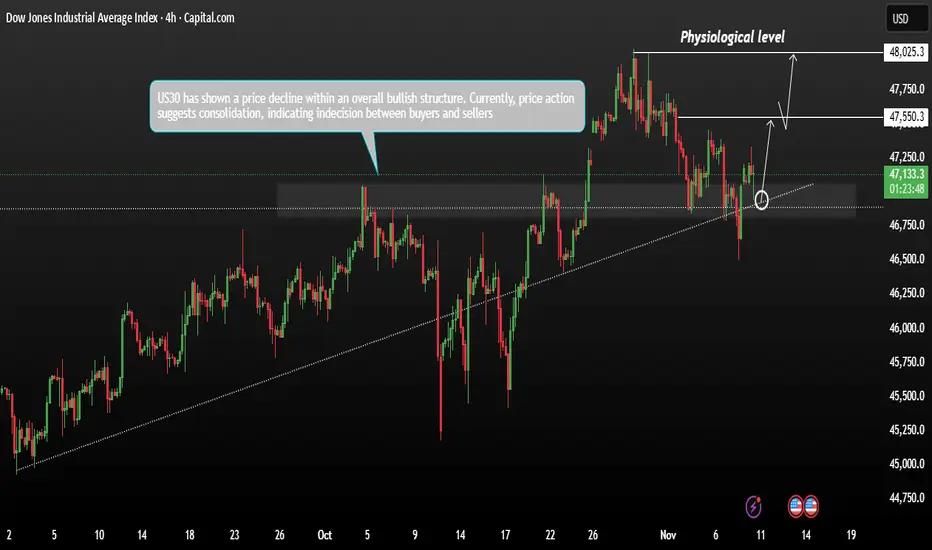
US30 Price decline within an overall bullish structureUS30 has shown a price decline within an overall bullish structure. Currently, price action suggests consolidation, indicating indecision between buyers and sellers. the index has pulled back but remains above key support zones, suggesting the potential for a rebound toward recent swing-high resistance levels.
If bulls maintain control, a continuation of the uptrend could follow after this consolidation phase. However, if momentum weakens, a deeper retracement could occur before any sustainable upside move resumes then Next expected target would be 47,550 to 48,025 lets see and how does price should react.
You may find more details in the chart,
Trade wisely best of Luck Buddies.
Ps; Support with like and comments for better analysis Thanks for Supporting.
Market correction, filling gaps and money shiftIt is expected and have been waiting for it for few weeks.
the market needs to correct itself by:
- Institutions and large funds (market makers) to exit from high tech AI and overvalued stocks and leave them to bag holders.
- They already shorted the large AI stocks so they will make money anyway.
- Money Shift: Institutions and funds moving from high tech to other sectors.
- Dow Jones must fill the gaps left during the strong uptrend - marked in circles.
- This shift will take some time pushing the stock market down, I already shifted my investments to other sectors, 50% cash and waiting.

Golds overperformance relative to the Dow will be dramatic !!The place to invest during the following decade is gold!!
The Dow Jones is projected to lose 96% relative to gold from now until August 2036!! (if history repeats itself as it did in 1968-1980).
In 12 years time, the DOW to GOLD ratio is expected to reach 0.44.
By 2026, we will be able to sell our gold by buying the Dow with less than half an ounce of gold (currently, it takes 12 ounces of gold to buy the Dow).
We're talking about a 24x outperformance!!
DO NOT ignore the historic break down in the stock market relative to gold which is happening right now !! For those who think that the gold bull is over: it is just about to start !!
This is a ratio graph, so don't get me wrong: the DOW could still hit 100'000 USD but that would imply that Gold would rise above 100'000 USD an ounce !

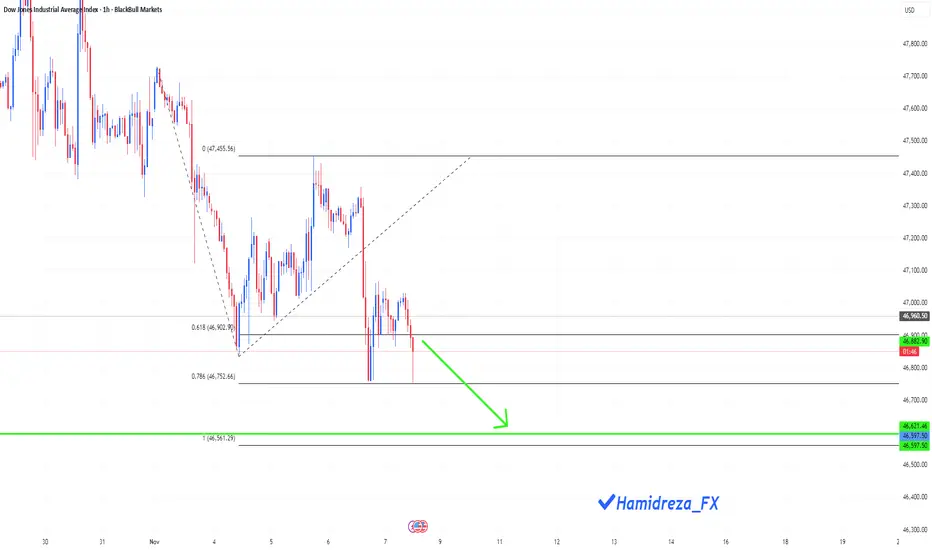
Could the Dow Jones continue to correct?
Hi everyone
I think if the 78.6 Fibonacci level is broken, we will probably reach the 1 Fibonacci level.
Do you think it is possible?
what do you think?
DOW JONES HIGH PROBABILITY SETUPS SOON!!!🚨 DOW30 HIGH PROBABILITY SELL/BUY SETUP 🚨
* Here We Can See Clearly The Next Potential Moves For US30 Coming Hours/Days.
* Keep Your Eyes Close On Your Trading Positions.
* Happy PIP Hunting Traders.
FXKILLA.

DOW JONES recovered and is looking for a High at 48500.Exactly 2 weeks ago (October 22, see chart below), we gave a strong Buy Signal on Dow Jones (DJI), as the index had already initiated the new Bullish Leg of its 6-month Channel Up and quickly hit our 47700 Target:
That trading plan included a 2nd Target as well at 48500, which represented a +7.50% rise from the October 10 Low, which was a Higher Low for the Channel Up on its 1D MA50 (blue trend-line).
As Target 1 was on the 1.382 Fibonacci extension, the recent pull-back was technically expected as the sequence was similar to those of August 22 - September 02 among others. As you can see, all minor pull-backs that took place within this Channel Up, hit the 4H MA100 (red trend-line) and rebounded. Major ones found support lower on the 1D MA50, as did the October 10 Low.
Since the index hit yesterday its 4H MA100 and is rebounding today, the Bullish Leg remains valid and on the medium-term can reach our final 48500 Target.
-------------------------------------------------------------------------------
** Please LIKE 👍, FOLLOW ✅, SHARE 🙌 and COMMENT ✍ if you enjoy this idea! Also share your ideas and charts in the comments section below! This is best way to keep it relevant, support us, keep the content here free and allow the idea to reach as many people as possible. **
-------------------------------------------------------------------------------
💸💸💸💸💸💸
👇 👇 👇 👇 👇 👇

Is a Market Correction Coming? 10 Warning Signs You Can’t Ignore🚨 Markets look euphoric… but data says otherwise.
Hello @TradingView users, hope you are doing well
Here are 10 reasons why we think a sharp pullback could be near
(Not financial advice — just signals stacking up.)
1) Record yield-curve inversion: The 10y–2y spread was negative for a record ~783 days before ending in Sept 2024; such inversions have preceded every U.S. recession in recent decades.
2) Q1 2025 GDP dipped, Q2 rebounded: BEA shows real GDP fell in Q1 2025 (revised −0.6%), then rose +3.8% in Q2 2025. One more weak quarter would meet the “technical” definition, but Q2 strength complicates that path.
3) Cuts usually come with stress: Markets are pressuring the Fed to cut; historically, rate-cut cycles often start when growth/inflation risks tilt weaker (not typically in “booming” conditions).
4) LEI turned down again: After a tiny July uptick, the Conference Board’s LEI fell −0.5% in Aug 2025 and is −2.8% over the last 6 months, pointing to softer momentum (the “15+ straight months” stat is no longer current).
5) Valuations are stretched: The Shiller CAPE > 40, the highest since the dot-com era—historically linked to weaker forward returns.
6) Labor market showing cracks at the margin: Unemployment ~4.3% (Aug 2025) and job openings ~7.2M (Aug)—down from the 2022 peak—suggest some cooling, even if not severe. (I removed the unsourced “+35% layoffs” figure.)
7) Buffett’s record cash: Berkshire now holds roughly $381–$382B in cash & T-bills, an all-time high—interpreted by many as “waiting for better prices.” (Replaces the older $347.7B figure.)
8) Government shutdown risk/drag: The U.S. is in a prolonged federal shutdown (30+ days), with credible estimates of a material GDP hit if it persists—an added macro headwind.
9) Parabolic leaders, dot-com déjà vu vibes: Today’s rally is narrow and AI-led, and valuation gauges echo late-1990s extremes—a setup that can amplify drawdown risk on disappointments.
markets.businessinsider.com
10) Clustering of risks: Yield-curve history + LEI weakness + stretched valuations + policy uncertainty = elevated correction risk, even if timing is uncertain.
Please be cautious, more signals are starting to align, suggesting a potential market drop. From Warren Buffett holding significantly more cash, to the ongoing government shutdown, and even the recent sharp rally that mirrors patterns seen right before the dot-com bubble, the puzzle pieces are starting to fit together.
This message isn’t to cause panic, but rather to remind you to trade carefully and stay prepared either by keeping some cash ready to invest if the market drops, or by simply sticking to your existing long-term investment plan if you have any.
Comment below what YOU think, is this a healthy dip incoming or the start of something bigger?
@TradingView Appreciate it if you guys can feature this post so more traders and investors get the warning and stay safe if the drop happens.
Thank you
Alain M(Coach)
WTW Team
NYSE:DOW NASDAQ:NDX SP:SPX

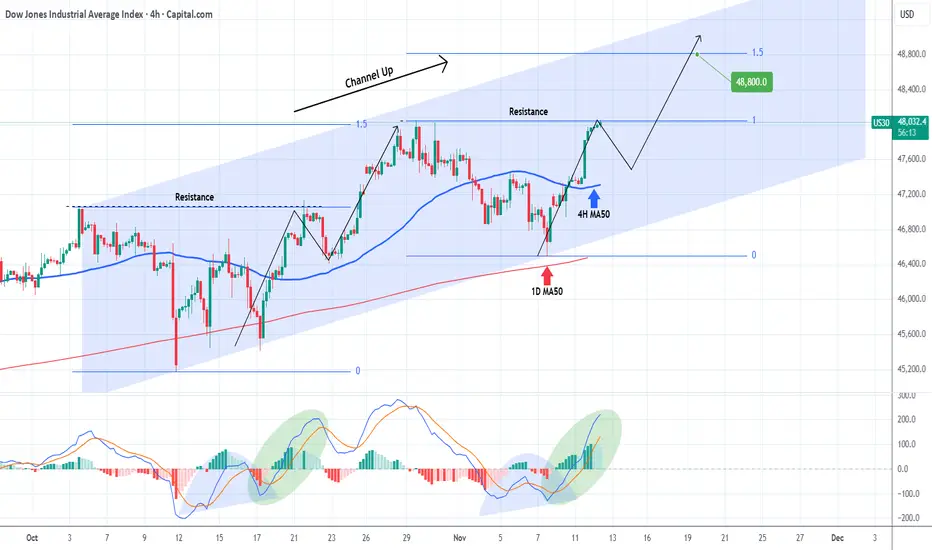
DOW JONES to new All Time Highs and won't stop there!Dow Jones (DJI) has been trading within an aggressive Channel Up since October 03, which made today a new All Time High (ATH). This is its technical Bullish Leg following the Higher Low bottom near the 1D MA50 (red trend-line).
With a 4H MACD sequence identical to the previous Leg, it is possible to see a re-test of the 4H MA50 (blue trend-line) next but on the medium-term, a new Higher High of at least 48800 (the 1.5 Fibonacci extension as on the previous Bullish Leg) is expected.
---
** Please LIKE 👍, FOLLOW ✅, SHARE 🙌 and COMMENT ✍ if you enjoy this idea! Also share your ideas and charts in the comments section below! This is best way to keep it relevant, support us, keep the content here free and allow the idea to reach as many people as possible. **
---
💸💸💸💸💸💸
👇 👇 👇 👇 👇 👇
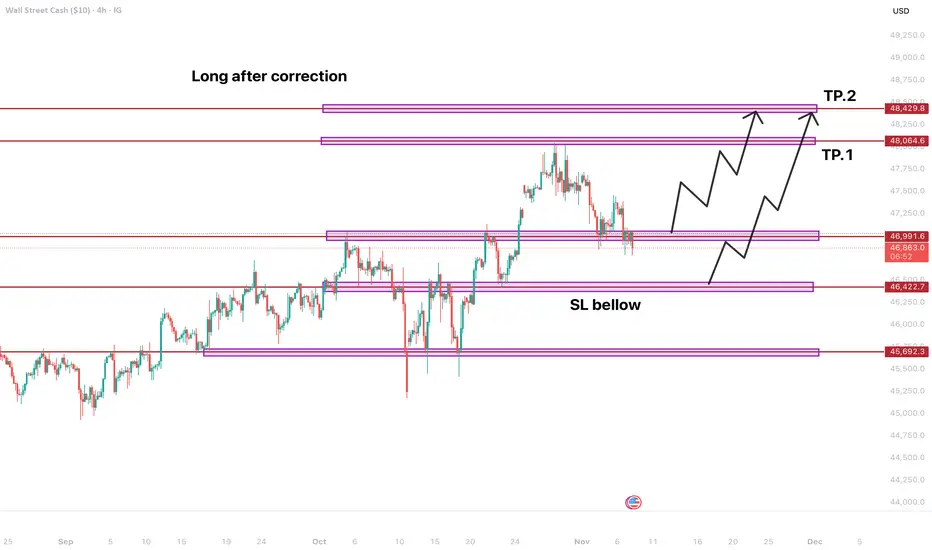
US30 – Correction Toward 47100 | Next Leg Up Toward 47920US30 – MARKET OUTLOOK | Bullish Bias Above 47100
US30 is showing a mild bearish correction after facing resistance near 47460, but the broader structure remains bullish while price holds above 47100.
🔼 Above 47460: Bullish continuation toward 47750 → 47920 → 48200.
🔽 Below 47100: Bearish correction possible toward 46920 → 46600.
Pivot: 47430
Support: 47100 · 46920 · 46600
Resistance: 47750 · 47920 · 48200
US30 stays bullish while above 47100, but a confirmed close below this level could trigger a short-term bearish correction toward 46920.

US30 – Buyers Defend Pivot | Holding 47080 Keeps Trend IntactUS30 – MARKET OUTLOOK | Bullish Bias Above 47080
US30 continues to trade with a bullish tone while holding above 47080, supported by stronger sentiment across U.S. equities.
Above 47080: Bullish continuation toward 47300 → 47460 → 47760.
Below 47080: Bearish correction possible toward 46910 → 46600.
Pivot: 47100
Support: 46910 · 46610 · 46450
Resistance: 47310 · 47460 · 47760
US30 remains bullish while above 47080, but a confirmed 1H close below this level could trigger a short-term bearish correction toward 46910–46600.

US30 : Bulls Regaining Control!After a clean correction, US30 (Dow Jones) looks set for another push upward. If structure holds, we could see momentum building toward new highs before the next potential pullback. Stay alert for confirmation around 47,400–47,600 levels!
Disclosure: We are part of Trade Nation's Influencer program and receive a monthly fee for using their TradingView charts in our analysis.

DowJones important support retest at 46800Key Support and Resistance Levels
Resistance Level 1: 47433
Resistance Level 2: 47534
Resistance Level 3: 47636
Support Level 1: 46807
Support Level 2: 46690
Support Level 3: 46545
This communication is for informational purposes only and should not be viewed as any form of recommendation as to a particular course of action or as investment advice. It is not intended as an offer or solicitation for the purchase or sale of any financial instrument or as an official confirmation of any transaction. Opinions, estimates and assumptions expressed herein are made as of the date of this communication and are subject to change without notice. This communication has been prepared based upon information, including market prices, data and other information, believed to be reliable; however, Trade Nation does not warrant its completeness or accuracy. All market prices and market data contained in or attached to this communication are indicative and subject to change without notice.

Dow Challenges 4-Year ResistanceFrom a monthly perspective, and filtering out short-term noise using the line chart, the Dow’s price action has been contracting since its bullish rebound from the 2020 lows, with overbought momentum previously recorded in November 2024 and April 2021.
This setup highlights the potential for long-term reversal risks near the upper boundary — specifically along the trendline connecting consecutive higher highs from November 2021 through November 2024.
If the trend extends beyond the 48,000 resistance, further advances could target 48,400 and 49,000, with 51,000 seen as an extreme projection before another major correction phase.
Conversely, a confirmed hold below 46,900 would indicate renewed pressure, potentially driving prices toward 46,600 and 46,200, where a technical rebound could occur.
If not, a deeper retracement toward the 45,000 region (previous significant resistance of 2025) may emerge.
Written by Razan Hilal, CMT

US30(SHORT)
Us30 resecting trendline.
Rejected at resistance of trendline.
Expecting long term shorts


US30 – Bearish Bias Below 46910 | Targeting 46600–46410US30 – MARKET OUTLOOK | Bearish Bias Below 46910
US30 reversed from recent highs and stabilized below the pivot zone at 46910, signaling renewed bearish momentum in the short term.
🔽 Below 46910: Bearish continuation toward 46600 → 46410 → 46000.
🔼 Above 47100: Bullish recovery possible toward 47220 → 47450.
Pivot: 46910
Support: 46600 · 46410 · 46000
Resistance: 47100 · 47220 · 47450
US30 remains bearish while below 46910, but a confirmed 1H or 4H close above 47100 would shift bias to bullish continuation toward 47450.

DOW JONES INDUSTRIAL HIGH PROBABILITY SETUP SOON!!!🚨 DOW30 HIGH PROBABILITY BUY SETUP 🚨
* Here We Can See Clearly The Next Potential Moves For US30 Coming Hours/Days.
* Keep Your Eyes Close On Your Trading Positions.
* Happy PIP Hunting Traders.
FXKILLA.

plans change This setup is based on a bearish market structure visible on the 2-hour chart. The market has been forming lower highs and lower lows, indicating that sellers remain in control. A descending trendline connects the previous swing highs, confirming continued bearish pressure.
Recently, price pushed above a previous high (marked with the “$” symbol), likely sweeping liquidity and triggering stop-losses of early sellers. After that sweep, price failed to continue higher — a sign that buying momentum was exhausted and sellers might re-enter from that level.

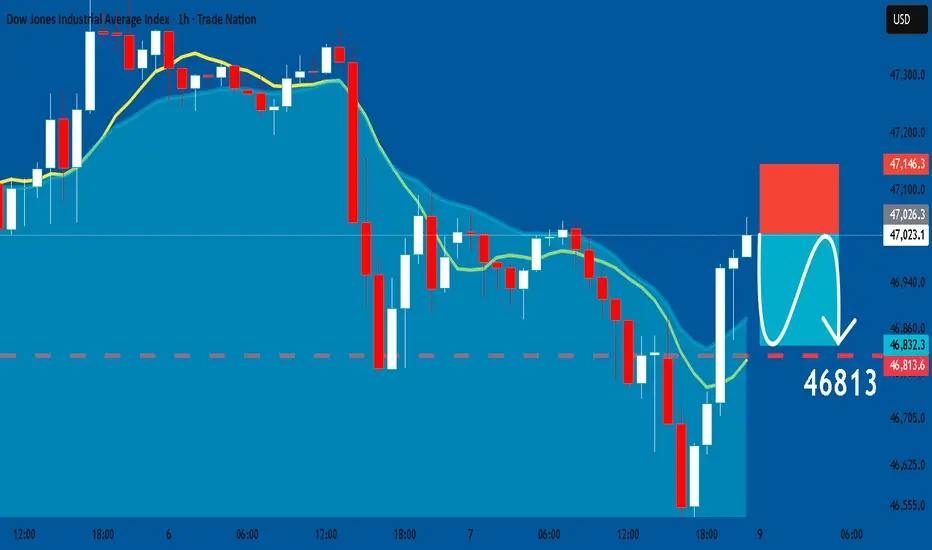
US30: Short Signal Explained
US30
- Classic bearish pattern
- Our team expects retracement
SUGGESTED TRADE:
Swing Trade
Sell US30
Entry - 47023
Stop - 47146
Take - 46813
Our Risk - 1%
Start protection of your profits from lower levels
Disclosure: I am part of Trade Nation's Influencer program and receive a monthly fee for using their TradingView charts in my analysis.
❤️ Please, support our work with like & comment! ❤️