Bullish bounce off?DJ30 is falling towards the support level, which is a pullback support that aligns with the 38.2% Fibonacci retracement and could bounce from this level to our take-profit.
Entry: 47,0090.29
Why we like it:
There is a pullback support that aligns with the 38.2% Fibonacci retracement.
Stop loss: 46,642.72
Why we like it:
There is an overlap support that is slightly below the 50% Fibonacci retracement.
Take profit: 48,056.22
Why we like it:
There is a swing high resistance level.
Enjoying your TradingView experience? Review us!
Please be advised that the information presented on TradingView is provided to Vantage (‘Vantage Global Limited’, ‘we’) by a third-party provider (‘Everest Fortune Group’). Please be reminded that you are solely responsible for the trading decisions on your account. There is a very high degree of risk involved in trading. Any information and/or content is intended entirely for research, educational and informational purposes only and does not constitute investment or consultation advice or investment strategy. The information is not tailored to the investment needs of any specific person and therefore does not involve a consideration of any of the investment objectives, financial situation or needs of any viewer that may receive it. Kindly also note that past performance is not a reliable indicator of future results. Actual results may differ materially from those anticipated in forward-looking or past performance statements. We assume no liability as to the accuracy or completeness of any of the information and/or content provided herein and the Company cannot be held responsible for any omission, mistake nor for any loss or damage including without limitation to any loss of profit which may arise from reliance on any information supplied by Everest Fortune Group.
Trade ideas


Potential bullish bounce off?Dow Jones (US30) has bounced off the pivot, which is a pullback support and could rise to the 1st resistance, which is a swing high resistance.
Pivot: 46,869.22
1st Support: 46,429.35
1st Resistance: 48,012.20
Disclaimer:
The above opinions given constitute general market commentary, and do not constitute the opinion or advice of IC Markets or any form of personal or investment advice.
Any opinions, news, research, analyses, prices, other information, or links to third-party sites contained on this website are provided on an "as-is" basis, are intended only to be informative, is not an advice nor a recommendation, nor research, or a record of our trading prices, or an offer of, or solicitation for a transaction in any financial instrument and thus should not be treated as such. The information provided does not involve any specific investment objectives, financial situation and needs of any specific person who may receive it. Please be aware, that past performance is not a reliable indicator of future performance and/or results. Past Performance or Forward-looking scenarios based upon the reasonable beliefs of the third-party provider are not a guarantee of future performance. Actual results may differ materially from those anticipated in forward-looking or past performance statements. IC Markets makes no representation or warranty and assumes no liability as to the accuracy or completeness of the information provided, nor any loss arising from any investment based on a recommendation, forecast or any information supplied by any third-party.


US30 - Bearish Momentum Extends After 1.5% DropUS30 – MARKET OUTLOOK | Bearish Momentum Extends After 1.5% Drop 🇺🇸
The Dow Jones remains under pressure after a sharp 1.5% decline, with sellers maintaining control in the short term.
🔽 Below 46,920: Bearish continuation toward 46,800 → 46,600 → 46,410.
🔼 Above 46,920: Bullish recovery toward 47,100 → 47,440.
Pivot: 46,920
Support: 46,790 · 46,450 · 46,020
Resistance: 47,100 · 47,440 · 47,560
US30 stays bearish while below 46,920, but a confirmed 1H close above this level could shift tone to bullish in the near term.

Us30 long US30 (Dow Jones Index) – Market Outlook & Trade Setup
Currently observing a potential bullish reaction from the demand zone around the 47,500 region after multiple rejections at this level.
If price maintains above this support, I’m anticipating a continuation toward the 48,180 area — aligning with prior liquidity and supply levels.
This setup combines:
• Structure confirmation from previous higher lows
• Demand zone retest for potential entry
• Clear risk-to-reward framework with defined targets
Patience and precision remain key. Let’s see how price action develops going into the next session. 📊
#US30 #MarketAnalysis #TradingInsights #DowJones #TechnicalAnalysis #FinancialMarkets

us30 4h🔹 Overall Outlook and Potential Price Movements
In the charts above, we have outlined the overall outlook and possible price movement paths.
As shown, each analysis highlights a key support or resistance zone near the current market price. The market’s reaction to these zones — whether a breakout or rejection — will likely determine the next direction of the price toward the specified levels.
⚠️ Important Note:
The purpose of these trading perspectives is to identify key upcoming price levels and assess potential market reactions. The provided analyses are not trading signals in any way.
✅ Recommendation for Use:
To make effective use of these analyses, it is advised to manually draw the marked zones on your chart. Then, on the 15-minute time frame, monitor the candlestick behavior and look for valid entry triggers before making any trading decisions.


US30 Set To Grow! BUY!
My dear subscribers,
My technical analysis for US30 is below:
The price is coiling around a solid key level - 47178
Bias - Bullish
Technical Indicators: Pivot Points High anticipates a potential price reversal.
Super trend shows a clear buy, giving a perfect indicators' convergence.
Goal - 47528
About Used Indicators:
By the very nature of the supertrend indicator, it offers firm support and resistance levels for traders to enter and exit trades. Additionally, it also provides signals for setting stop losses
Disclosure: I am part of Trade Nation's Influencer program and receive a monthly fee for using their TradingView charts in my analysis.
———————————
WISH YOU ALL LUCK

DowJones The Week Ahead Key Trading LevelsKey Support and Resistance Levels
Resistance Level 1: 47447
Resistance Level 2: 47570
Resistance Level 3: 47673
Support Level 1: 46985
Support Level 2: 46820
Support Level 3: 46708
This communication is for informational purposes only and should not be viewed as any form of recommendation as to a particular course of action or as investment advice. It is not intended as an offer or solicitation for the purchase or sale of any financial instrument or as an official confirmation of any transaction. Opinions, estimates and assumptions expressed herein are made as of the date of this communication and are subject to change without notice. This communication has been prepared based upon information, including market prices, data and other information, believed to be reliable; however, Trade Nation does not warrant its completeness or accuracy. All market prices and market data contained in or attached to this communication are indicative and subject to change without notice.


DOWJONES / US30 BUY IDEAIIn this idea we can see that h4 starts pullback . By my point of view i can see that h4 swing will bearish because there is doubble bottom liquidity left and it will swept and it will be taken so h4 swing will bearish ..then market will approach to second h4 zone (45813.2 - 45414.4) and in this zone we will switch to M15 timeframe for refine our entry and for minimum stop loss ..and
wait for our entry model for buy setup. when we get our buy entry model/signal we get it... :)

DowJones (DJI) IntraSwing & Future Level for 14th - 15th Nov 20DowJones (DJI) IntraSwing & Future Level for 14th - 15th Nov 2025 (2:30 am)
✍🏼️ "Future IntraSwing Levels" mentioned in BOX format.
Useful to Tally / Recognize for Next day Trade Plan.
Level description:
L#1: If the candle crossed & stays above the “Buy Gen”, it is treated / considered as Bullish bias.
L#2: Possibility / Probability of REVERSAL near RLB#1 & UBTgt
L#3: If the candle stays above “Sell Gen” but below “Buy Gen”, it is treated / considered as Sidewise. Aggressive Traders can take Long position near “Sell Gen” either retesting or crossed from Below & vice-versa i.e. can take Short position near “Buy Gen” either retesting or crossed downward from Above.
L#4: If the candle crossed & stays below the “Sell Gen”, it is treated / considered a Bearish bias.
L#5: Possibility / Probability of REVERSAL near RLS#1 & USTgt
HZB (Buy side) & HZS (Sell side) => Hurdle Zone,
*** Specialty of “HZB#1, HZB#2 HZS#1 & HZS#2” is Sidewise (behaviour in Nature)
Rest Plotted and Mentioned on Chart
Color code Used:
Green =. Positive bias.
Red =. Negative bias.
RED in Between Green means Trend Finder / Momentum Change
/ CYCLE Change and Vice Versa.
Notice One thing: HOW LEVELS are Working.
Use any Momentum Indicator / Oscillator or as you "USED to" to Take entry.
⚠️ DISCLAIMER:
The information, views, and ideas shared here are purely for educational and informational purposes only. They are not intended as investment advice or a recommendation to buy, sell, or hold any financial instruments. I am not a SEBI-registered financial adviser.
Trading and investing in the stock market involves risk, and you should do your own research and analysis. You are solely responsible for any decisions made based on this research.
"As HARD EARNED MONEY IS YOUR's, So DECISION SHOULD HAVE TO BE YOUR's".
Do comment if Helpful .
In depth Analysis will be added later (If time Permits)

US30 Trade Set Up Nov 14 2025I am expecting price to continue it bearish trend to sweep lower SSL but first i want to see a slight pullback into 1h FVG before continuing its trend

Seems like dow is continue to fall. NYSE:DOW dow is weak now. broke the previous swing and seems like it is going to continue its trajectory and keep falling.

US30 Trade Secured 1500 PipsPrice inverted a 1h FVG in London session then broke structure to the downside on the 15m, came up to sweep BSL to then target PDL

#DJI - 1500 Point Move on Cards?Date: 13-11-2025
#DJI Current Price: $48,254.83
Pivot Point: $48,160.50 Support: $47,650.55 Resistance: $48,673.16
Upside Levels:
L1: $48,957.83 L2: $49,242.50 L3: $49,648.25 L4: $50,054.00
Downside Levels:
L1: $47,364.53 L2: $47,078.50 L3: $46,672.75 L4: $46,267.00
#Tradingview #DJI #NDX #NIFTY #BTC #GOLD

US30 LONGFib Retracement levels. for any form of pull back a higher low need to be created on or above a strong support level.
$DJI – Buy the Dip Opportunity | Target: 51,000TVC:DJI – Buy the Dip Opportunity | Target: 51,000 🚀
The Dow Jones is offering a high-probability dip-buying setup within a strong macro bullish structure. Wave alignment and smart money positioning suggest continuation toward the 51,000 zone. Price is respecting key Fibonacci levels and institutional support zones. Momentum is building — this could be the launchpad.
📍 Watch for confirmation on lower timeframes.
📈 Trend remains intact — stay with structure.
#ElliottWave #SmartMoney #Fibonacci #DowJones #DJI #TradingView #TechnicalAnalysis #BuyTheDip

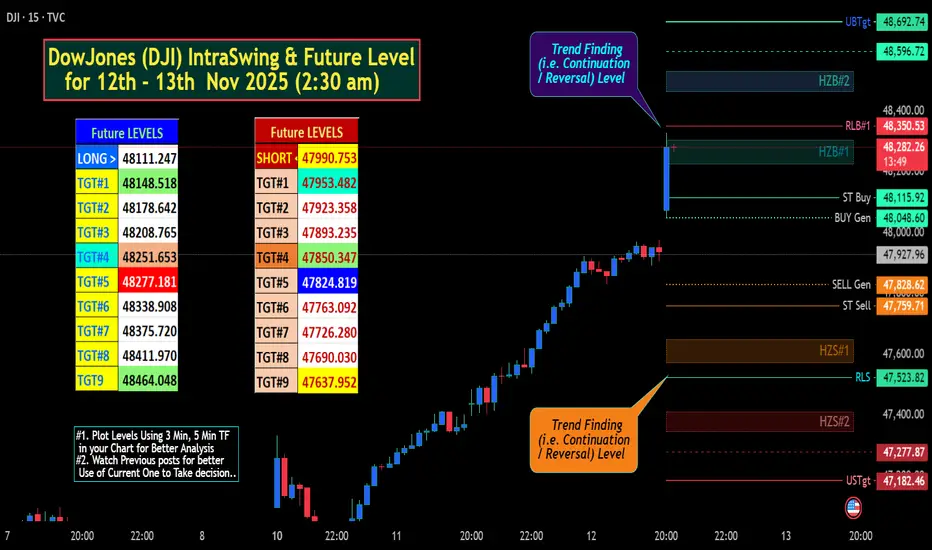
DowJones (DJI) IntraSwing & Fut Level for 12th - 13th Nov 2025 DowJones (DJI) IntraSwing & Fut Level for 12th - 13th Nov 2025 (2:30 am)
b]✍🏼️ "Future IntraSwing Levels" mentioned in BOX format.
Useful to Tally / Recognize for Next day Trade Plan.
Level description:
L#1: If the candle crossed & stays above the “Buy Gen”, it is treated / considered as Bullish bias.
L#2: Possibility / Probability of REVERSAL near RLB#1 & UBTgt
L#3: If the candle stays above “Sell Gen” but below “Buy Gen”, it is treated / considered as Sidewise. Aggressive Traders can take Long position near “Sell Gen” either retesting or crossed from Below & vice-versa i.e. can take Short position near “Buy Gen” either retesting or crossed downward from Above.
L#4: If the candle crossed & stays below the “Sell Gen”, it is treated / considered a Bearish bias.
L#5: Possibility / Probability of REVERSAL near RLS#1 & USTgt
HZB (Buy side) & HZS (Sell side) => Hurdle Zone,
*** Specialty of “HZB#1, HZB#2 HZS#1 & HZS#2” is Sidewise (behaviour in Nature)
Rest Plotted and Mentioned on Chart
Color code Used:
Green =. Positive bias.
Red =. Negative bias.
RED in Between Green means Trend Finder / Momentum Change
/ CYCLE Change and Vice Versa.
Notice One thing: HOW LEVELS are Working.
Use any Momentum Indicator / Oscillator or as you "USED to" to Take entry.
⚠️ DISCLAIMER:
The information, views, and ideas shared here are purely for educational and informational purposes only. They are not intended as investment advice or a recommendation to buy, sell, or hold any financial instruments. I am not a SEBI-registered financial adviser.
Trading and investing in the stock market involves risk, and you should do your own research and analysis. You are solely responsible for any decisions made based on this research.
"As HARD EARNED MONEY IS YOUR's, So DECISION SHOULD HAVE TO BE YOUR's".
Do comment if Helpful .
In depth Analysis will be added later (If time Permits)
US30 Trade Set Up Nov 12 2025Price is trading above PDH and has swept ATH so i want to see a pullback to sweep SSL Asia/London lows and/or tap 4h FVG before looking to buy back up

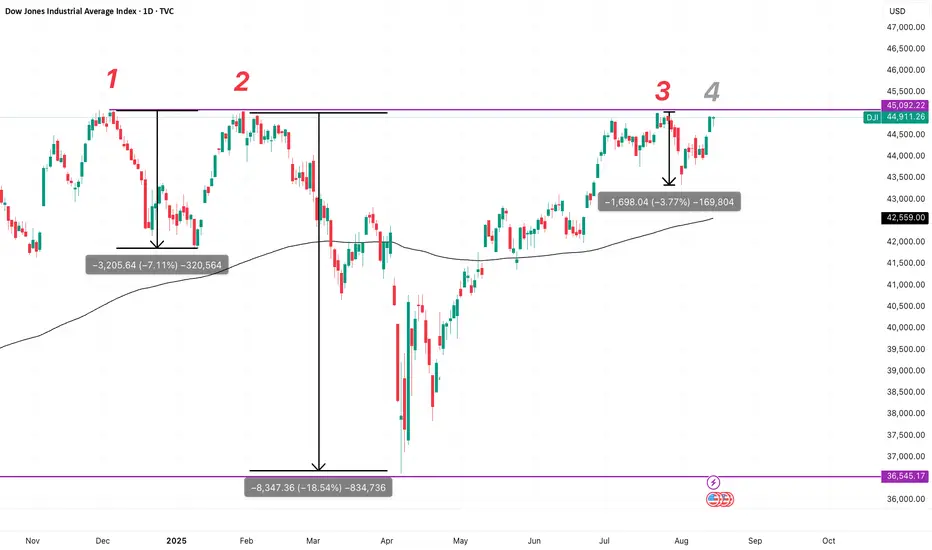
Dow: Fourth Attempt at the CeilingThree times since late 2024, the Dow has run head-first into the same resistance zone around 45,092 — each time pulling back, but each time finding higher lows and quicker recoveries.
Now we’re at attempt #4. The prior pullbacks have been smaller, and breadth is improving — only 5 out of 30 Dow components are negative since December 24, 2024.
Yes, there are plenty of unknowns — macro headwinds, earnings gaps, global geopolitical and tariff risks — but the chart says one thing loud and clear: the bulls are still in control.
A clean breakout here could open the door to new highs. Until proven otherwise, momentum belongs to the buyers.