BoJ firmness and Fed pivot set stage for yen recoveryThe Japanese yen is currently trading in a strategically important zone. It remains historically weak but is closely monitored by Japanese authorities as USD/JPY hovers just below the symbolic 150 level. For swing traders, the challenge is to determine whether the currency can mount a lasting rebound, as fundamentals and sentiment have become less one-sided than in recent years.
Fundamental analysis
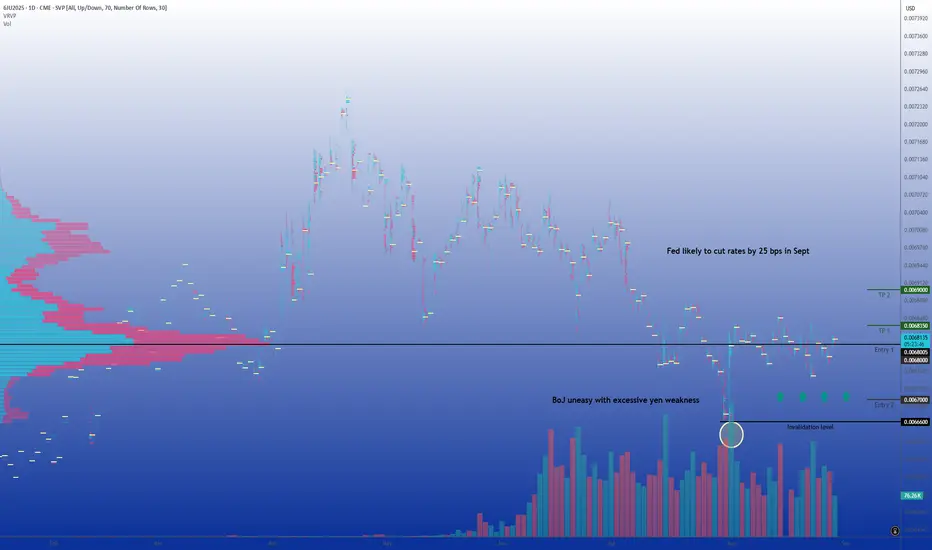
The yen’s path remains primarily shaped by monetary policy divergence. In the U.S., recent data point to slowing momentum: the latest jobs report revealed weaker hiring and downward revisions, while inflation signals remain mixed. Chair Jerome Powell confirmed at Jackson Hole that the central bank is preparing to lower interest rates in September, with a strong likelihood of a 25 basis point cut (probability > 85% according to CME FedWatch Tool).
Japan presents a contrasting stance. The Bank of Japan has adopted a firmer tone than in the past decade. Governor Kazuo Ueda stresses the importance of wages and employment in sustaining inflation, suggesting that another hike could occur before year-end. With Tokyo CPI still above the central bank target, the BoJ’s hawkish bias is becoming more credible. This change narrows the policy gap with the U.S.
The yen’s traditional role as a funding currency is also under pressure. Narrowing rate differentials and a less accommodative BoJ reduce the appeal of the carry trade. More importantly, the threat of intervention lingers. In 2022, Tokyo intervened when USD/JPY crossed 150. With spot near 148, a break of that threshold could once again invite official action. This risk serves as both a psychological and practical ceiling for dollar strength against the yen.
Taken together, fundamentals are no longer uniformly bearish.
Technical analysis
On the J6U5 daily chart, the broader trend remains bearish for the yen, but since early August the contract has shifted into consolidation.
The volume profile highlights a value area concentrated between 0.00678 and 0.00680, confirming this range as the market’s equilibrium. Below 0.00676, liquidity is thin, leaving the market vulnerable to a swift drop toward 0.00670 if support gives way. Conversely, a sustained break above 0.00684 would validate renewed yen strength, with an upside projection toward 0.00690.
Resistance lies clearly between 0.00683 and 0.00685, zones of congestion that make gains difficult without a trigger. This structure offers swing traders clear markers and the narrow corridor suggests that the next breakout could be meaningful.
Market sentiment
Retail positioning data shows a clear consensus against the yen, with a majority of individual traders long USD/JPY (therefore short yen). This consensus is exposed to a squeeze, particularly since most of these long USD/JPY positions are losing money, weakening traders and increasing the risk of forced unwinds.
According to the CFTC COT report, asset managers are on the opposite side, tending to be net buyers of yen.
CME and OTC options
Options data underline the gravity of 0.00680. On CME, open interest is concentrated at this strike, with additional clusters between 0.00675–0.00677 and 0.00683–0.00685. This reinforces the current corridor structure.
The spot market provides similar signals. Large expiries are clustered between 147.50 and 148.00 USD/JPY, amounting to nearly 3.3 billion dollars in contracts this week. These expiries act as magnets for spot price action and serve as a cap on near-term upside. Until they roll off, traders should expect range-bound behavior around current levels.
Trade idea
In this context, a swing strategy favoring yen strength is justified. The plan would be to buy J6U5 on dips: half the position near 0.00680 and the other half closer to 0.00670 if retested.
Invalidation comes on a daily close below 0.00666, which would negate the bullish scenario and reopen the path toward further yen weakness. On the upside, the first objective is 0.00683–0.00684, the upper bound of the current range. With a catalyst such as dovish Fed guidance, hawkish BoJ comments, or verbal intervention from Tokyo, the move could extend toward 0.00690.
The setup provides a clear risk/reward structure: limited downside defined by support, while upside benefits from the vulnerability of consensus short positions.
Final thoughts
The J6U5 contract sits at a delicate equilibrium. Fundamentals are slowly turning less unfavorable to the yen as the Fed prepares to ease, the BoJ strikes a firmer tone, and intervention risk limits dollar upside. Technically, the contract trades in a well-defined range, with 0.00680 as pivot. Sentiment shows retail consensus against the yen, while institutional positioning and options data point to potential cracks in that view.
Combining these factors, a swing-long yen strategy on dips is justified. The base case is for a rebound toward 0.00684 and possibly 0.00690 if catalysts materialize. The potential for recovery is real, though discipline is essential: the broader bearish trend will not be reversed until resistance levels are broken. For swing traders, the opportunity lies in anticipating this tactical rebound, positioning ahead of a possible market rebalancing in favor of the yen.
---
When charting futures, the data provided could be delayed. Traders working with the ticker symbols discussed in this idea may prefer to use CME Group real-time data plan on TradingView: tradingview.com/cme/ .
This consideration is particularly important for shorter-term traders, whereas it may be less critical for those focused on longer-term trading strategies.
General Disclaimer:
The trade ideas presented herein are solely for illustrative purposes forming a part of a case study intended to demonstrate key principles in risk management within the context of the specific market scenarios discussed. These ideas are not to be interpreted as investment recommendations or financial advice. They do not endorse or promote any specific trading strategies, financial products, or services. The information provided is based on data believed to be reliable; however, its accuracy or completeness cannot be guaranteed. Trading in financial markets involves risks, including the potential loss of principal. Each individual should conduct their own research and consult with professional financial advisors before making any investment decisions. The author or publisher of this content bears no responsibility for any actions taken based on the information provided or for any resultant financial or other losses.
6JU2024 trade ideas
Just Because It’s Big Doesn’t Mean It’s SmartJPY Call Spread Breakdown: Bullish Signal — Or Just Obvious FOMO?
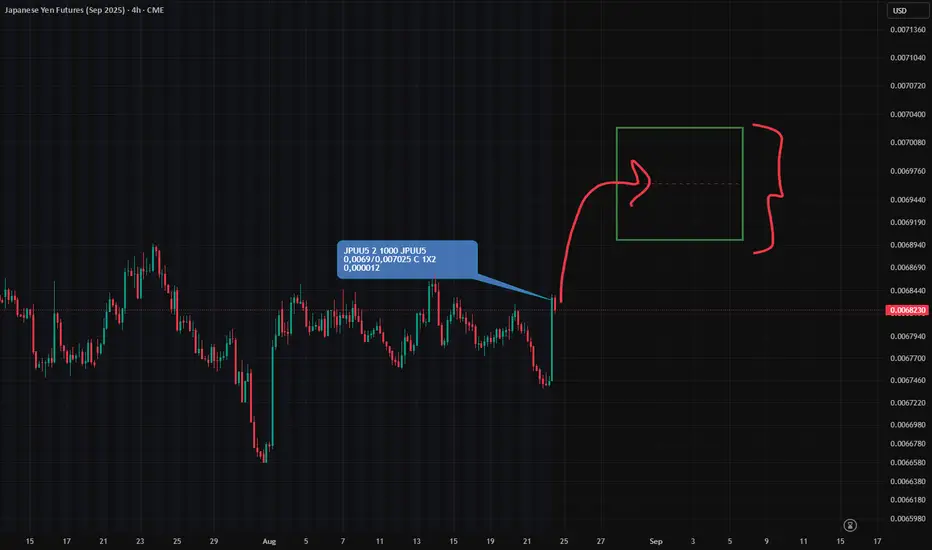
A new vertical call spread appeared in JPY options yesterday (per CME Globex data):
Long 0.0069 Call
Short 0.007025 Call
🎯 Target: 0.007025 — upside continuation play.
Open interest increased at both strikes → new position, not a roll.
Size? Relatively large for JPY (based on systematic observations).
⏰ When Was It Opened?
9:45 AM CT — after yesterday’s sharp rally in JPY futures.
In fact — right at the top of the move.
📌 Not before the move.
But after the impulse, on momentum.
🔍 Combining Flow + Chart Context:
Price had already spiked up.
The spread bets on further upside .
🧠 Key Takeaways:
✅ Sentiment: Bullish
❌ Predictive value: Low — nearly zero
Why?
The setup is too obvious.
No evidence of insider-like timing.
If this had been placed before the move — yes, it would matter.
But opening at the peak? That’s not edge — it’s FOMO dressed as strategy.
🚫 Will I go long JPY futures based on this?
No.
Not because I doubt the move.
But because this isn’t smart money behavior — it’s trend-chasing.
🎯 Final Lesson:
Not every large options trade is a signal.
Always ask:
When was it placed?
Why here?
Who’s behind it?
🔍 True edge isn’t in the trade itself — it’s in the context around it.
Can Yen Futures Push Higher? Inverted H&S Breakout in Focus1. Introduction
Japanese Yen Futures (6J) and Micro Yen Futures (MJY) are showing a promising technical setup that traders are watching closely. On the daily chart, an inverted Head and Shoulders pattern has formed, suggesting a potential reversal from recent weakness. The neckline lies around 0.006850, and if prices sustain a breakout above this level, the upside projection aligns neatly with a UFO resistance zone near 0.007100.
Adding weight to this bullish case, the MACD histogram is diverging positively, with higher lows forming while price action recorded lower lows. This bullish divergence suggests underlying momentum could support the completion of the pattern and drive Yen Futures higher in the sessions ahead.
2. Understanding the Inverted Head & Shoulders Pattern
The inverted Head & Shoulders (H&S) is a widely recognized reversal formation that often signals the end of a bearish trend. It is composed of three troughs: the left shoulder, the head (the deepest low), and the right shoulder, which is typically shallower. The neckline acts as the key breakout level, and once broken, the projected price target is measured from the head to the neckline, then projected upward.
In the case of Japanese Yen Futures, the neckline sits around 0.006850. A confirmed break above this price would validate the pattern, projecting a target toward 0.007100.
3. The Role of MACD Divergence
Momentum indicators could provide early clues about the strength of a potential breakout. In this case, the MACD histogram is showing bullish divergence—price made lower lows, while the histogram made higher lows. This divergence signals that selling pressure may be weakening, even as price was still falling.
Such conditions could potentially precede significant reversals, and when they align with a clear price pattern like the inverted Head & Shoulders, the probability of follow-through may increase. Traders monitoring this confluence will be looking at the neckline breakout above 0.006850 as the technical trigger that confirms it.
4. Contract Specs: Yen Futures vs. Micro Yen Futures
Understanding contract specifications helps traders size positions correctly and manage risk efficiently.
o Japanese Yen Futures (6J)
Contract Unit: ¥12,500,000
Minimum Tick: 0.0000005 per JPY = $6.25 per contract
Initial Margin (approximate, subject to change): ~$3,100
Popular with institutional traders due to larger notional exposure.
o Micro JPY/USD Futures (MJY)
Contract Unit: ¥1,250,000 (1/10th of standard 6J contract)
Minimum Tick: 0.000001 per JPY = $1.25 per contract
Initial Margin (approximate, subject to change): ~$310
Provides accessibility for retail traders and allows more granular risk management.
Both contracts track the same underlying, but the Micro contract offers flexibility for traders with smaller accounts or those looking to fine-tune position sizes.
5. Trade Plan & Stop Loss Options
With the inverted Head & Shoulders pattern taking shape, the trade bias turns long above the neckline breakout at 0.006850. The upside objective aligns with the resistance around 0.007100, providing a clearly defined target.
Two possible stop-loss placements can be considered:
o Below the Right Shoulder
Provides a valid protection but may offer a weaker Reward-to-Risk (R:R) ratio depending on the right shoulder height.
Useful for conservative traders looking to minimize drawdowns.
o Mathematically Below the Neckline
Positioned far enough to allow for retests of the neckline while aiming for a 3:1 R:R ratio.
Provides a balance between protection and potential profitability.
This approach ensures flexibility, letting traders choose between tighter risk control or a more favorable reward profile.
6. Risk Management Considerations
No pattern or indicator guarantees success, making risk management the cornerstone of any futures strategy. A few key principles stand out:
Always use a stop loss: Prevents small losses from escalating into significant drawdowns.
Avoid undefined risk exposure: Futures are leveraged products; unprotected trades can lead to large, rapid losses.
Precision in entries and exits: Reduces emotional decision-making and improves consistency.
Position sizing matters: Adjusting the number of contracts ensures risk stays proportional to account size.
Diversification and hedging: Yen futures can be used as a hedge against equity or bond market volatility, but should not necessarily replace broader risk controls.
In this context, choosing the stop-loss level carefully and sticking to the pre-defined trade plan is more important than the pattern itself.
7. Conclusion & Forward View
Japanese Yen Futures (6J) and Micro JPY/USD Futures (MJY) are at a critical juncture. The inverted Head & Shoulders on the daily chart, supported by a bullish MACD divergence, highlights a potential reversal in progress. A breakout above the neckline at 0.006850 opens the door for an advance toward the 0.007100 UFO resistance zone.
While the setup looks constructive, it is crucial to recognize that even strong patterns can fail. This is why risk management—through proper stop-loss placement and careful position sizing—remains the most important aspect of any trading plan.
When charting futures, the data provided could be delayed. Traders working with the ticker symbols discussed in this idea may prefer to use CME Group real-time data plan on TradingView: www.tradingview.com - This consideration is particularly important for shorter-term traders, whereas it may be less critical for those focused on longer-term trading strategies.
General Disclaimer:
The trade ideas presented herein are solely for illustrative purposes forming a part of a case study intended to demonstrate key principles in risk management within the context of the specific market scenarios discussed. These ideas are not to be interpreted as investment recommendations or financial advice. They do not endorse or promote any specific trading strategies, financial products, or services. The information provided is based on data believed to be reliable; however, its accuracy or completeness cannot be guaranteed. Trading in financial markets involves risks, including the potential loss of principal. Each individual should conduct their own research and consult with professional financial advisors before making any investment decisions. The author or publisher of this content bears no responsibility for any actions taken based on the information provided or for any resultant financial or other losses.

A return to solid seller structure presents a =SELLers world ## Japanese Yen Futures Short - Technical Narrative 📊
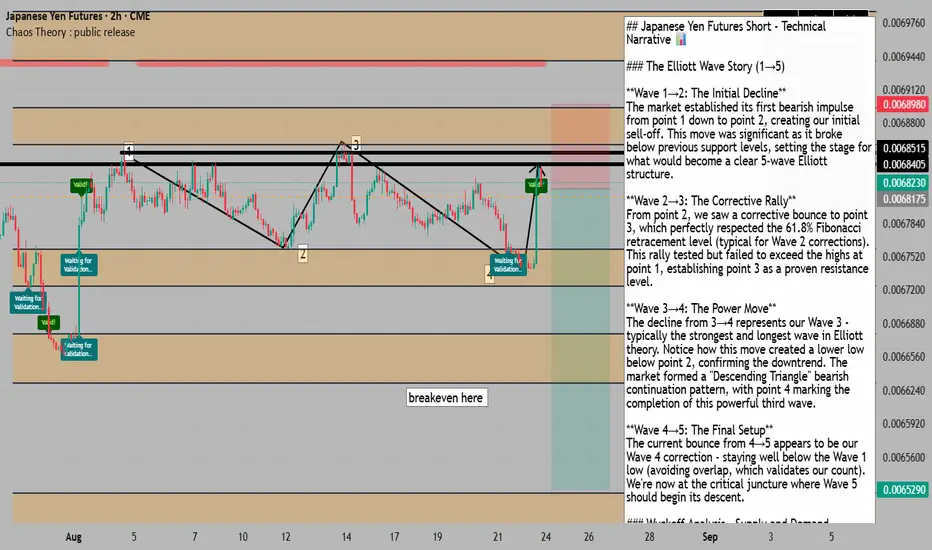
### The Elliott Wave Story (1→5)
**Wave 1→2: The Initial Decline**
The market established its first bearish impulse from point 1 down to point 2, creating our initial sell-off. This move was significant as it broke below previous support levels, setting the stage for what would become a clear 5-wave Elliott structure.
**Wave 2→3: The Corrective Rally**
From point 2, we saw a corrective bounce to point 3, which perfectly respected the 61.8% Fibonacci retracement level (typical for Wave 2 corrections). This rally tested but failed to exceed the highs at point 1, establishing point 3 as a proven resistance level.
**Wave 3→4: The Power Move**
The decline from 3→4 represents our Wave 3 - typically the strongest and longest wave in Elliott theory. Notice how this move created a lower low below point 2, confirming the downtrend. The market formed a "Descending Triangle" bearish continuation pattern, with point 4 marking the completion of this powerful third wave.
**Wave 4→5: The Final Setup**
The current bounce from 4→5 appears to be our Wave 4 correction - staying well below the Wave 1 low (avoiding overlap, which validates our count). We're now at the critical juncture where Wave 5 should begin its descent.
### Wyckoff Analysis - Supply and Demand Dynamics
Points 1 and 3 represent **proven sellers** - they've demonstrated their strength by pushing price below the uptrend support from point 2. The move from 4→5 represents a "return to supply" - weak buyers attempting to rally but meeting the dominant sellers who control this market. This is textbook Wyckoff distribution.
### The Chaos Zone Confluence 🎯
Your orange zones align perfectly with our analysis:
- Upper zone rejection at current levels (0.00682)
- "Breakeven here" notation at 0.006625 provides our first target
- Lower zone at 0.006529 offers our extended target
With chaos theory zones showing a 63% breakdown success rate over 2,500 candles, the probability favors continuation lower.
### Technical Divergences & Patterns
You've correctly identified:
- **Bearish divergence** on MFI and RSI
- **Sharp triangle turn** pattern suggesting reversal
- **Lower low confirmation** on the recent 2H candle close
### Fundamental Catalysts 🌍
The technical setup gains massive conviction from:
- Record net-long positioning in Yen futures (298k contracts) - extreme sentiment ready to unwind
- BOJ maintaining dovish stance at 0.50% while markets positioned for hawkish surprises
- Daily chart showing multiple rejections at 0.0068260 resistance level
### The Trade Setup 🎯
**ENTRY**: Market entry at 0.006822
**STOP LOSS OPTIONS**:
1. **Conservative**: Above points 1 & 3 at 0.006855 (33 pips risk)
2. **Aggressive**: Just above point 5 high at 0.006835 (13 pips risk)
**TARGETS**:
- **TP1**: 0.006625 (Chaos zone "breakeven" level) - 197 pips
- **TP2**: 0.006529 (Lower chaos zone) - 293 pips
**Risk/Reward**:
- Conservative stop: 1:6 R/R to TP1, 1:9 R/R to TP2
- Aggressive stop: 1:15 R/R to TP1, 1:22 R/R to TP2
### The Narrative Conclusion 📝
We have a complete Elliott Wave 5-wave structure approaching its final leg down. The Wyckoff distribution shows sellers in control at points 1 and 3, with buyers exhausted at point 4. The current position at point 5 represents the last gasp before the markdown phase.
Combined with:
- Record speculative long positioning ready to liquidate
- BOJ dovishness versus market expectations
- Major daily resistance overhead
- Chaos zones predicting downside with 63% accuracy
- Technical divergences confirming weakness
**This sets up a HIGH-CONVICTION short with exceptional risk/reward.**
The aggressive stop above point 5 (0.006835) makes more sense given the strong resistance and allows for massive R/R. If we're wrong and break above, we want out quickly anyway. The two-zone target strategy lets you take partial profits at the first chaos zone and ride the rest to the lower target.
**The stars have aligned: Elliott Waves + Wyckoff + Chaos Theory + COT Extremes + BOJ Fundamentals = SELL** 🎯
A return to solid sellers with deceptive volitility (fake) =SELL1->3 : creates higher high , this cements number 2
as the controlling entity in the viewable space
3->4 : strong sellers assert dominance, now the
strongest entity is the high number 3
4 : price returning to the current strongest entity
on the chart ....
what do I think will happen ?
* a retun to number 3 represents a return to solid
major resistance, ir provides an opportunity to
enter the market taking the side of the
strongest proven players on the market
* looking at volume histogram, we can see that this
large green bar is not as strong as it seems, it can be thought
of as more of a lack of sellers rather than an overwhelming
amount of buyers. comparing the last 2 candles who had
similar volume, we can see they are relativly insignificant and
do not actuallu appear to be that big , this large appearance of the big green candle calls to the old ' appear strong when weak, and weak when strong' , there is no power behind the bar which further adds to the sell case.
* as far as dow goes, on the daily we are on a downtrend and returning to a solid MINOR low, but still solid, it has been proven by defeating a potential upswing and cementing a push down.

Yen Futures Short-Term Analysis – 19/8/2025
Yen has drawn a nearby liquidity level and closed above the previous high. I’m anticipating further upside, with Yen likely to raid the nearest high.
My target setup is to:
Short EURJPY
Short GBPJPY

Very briefy: from Straddles to Spreads — What Options Are Saying📊 Market Pulse (CME data based): Key Flow Signals (15.08)
Gold (Oct series):
Spreads at 3650/3750 are being closed.
📉 Sentiment: moderately bearish — no strong upside expected.
AUD:
No major repositioning or fresh flow.
🟢 Sentiment remains bullish — quiet but intact.
EUR:
No insider-level activity or large block trades.
Neutral zone — no directional edge yet.
GBP:
Growing put interest at 1.35.
🟠 Sentiment: moderately bearish — but this level will act as local support IF reached.
JPY:
Another straddle live — expires Aug 22 (4-day life).
Boundaries set, setup familiar.
We know the drill: fade the edges, watch the break-even levels for LONG/SHORT opens
Gartley 222 pattern on the YenWe may have a beautiful Gartley pattern activating on the daily chart of the Yen. The neckline of the reverse head & shoulder might prove an excellent entry point.
Should the Yen rise, it will definitly put a strong pressure on tech stocks.

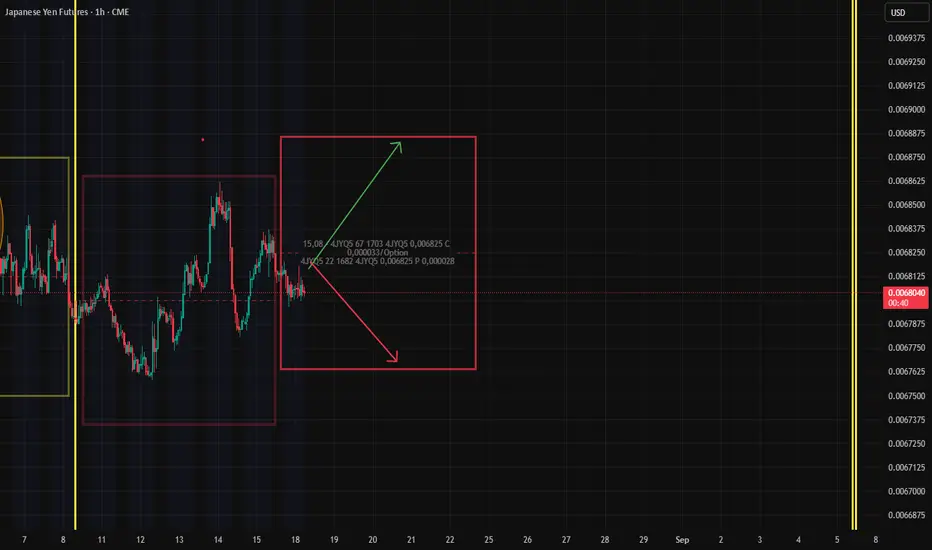
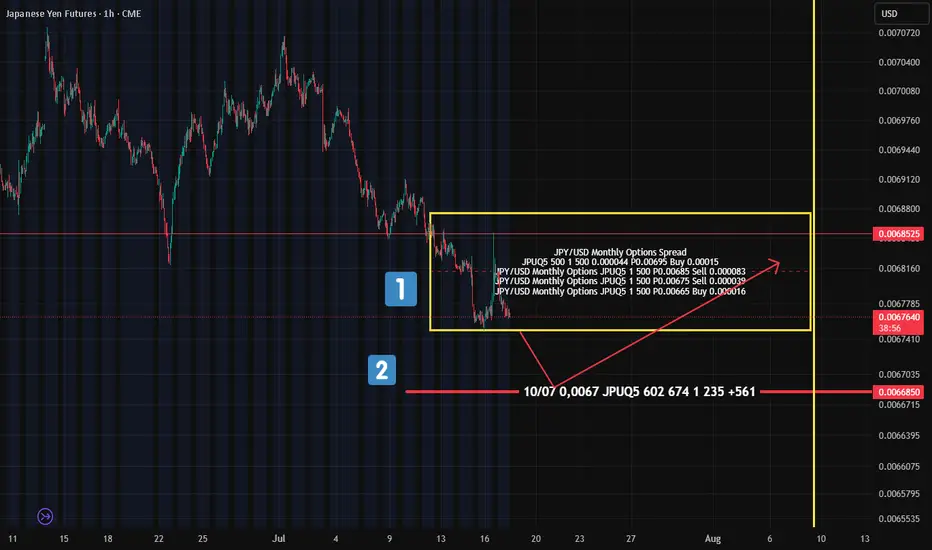
Yen Futures Options: What the "Put Condor" Tells Us About FutureA quick look at the options sentiment on Japanese Yen futures (not spot) — and there’s something interesting on the flow radar.
On July 10 , a "Put Condor" was placed — boundaries marked by the yellow rectangle on the chart (№1).
The goal of this setup? Price should expire within these boundaries — meaning the seller expects limited downside , but still allows for some controlled movement.
What’s notable?
This position was placed before the yen started to weaken — so someone was clearly preparing for this scenario in advance .
Also worth watching:
Further down (№2 on the chart), there’s another cluster of put options at 0.0067 — suggesting this level could act as a support zone if the futures contract drops that low.
📊 Bottom Line:
There are clear signs pointing to continued downside pressure in Yen futures.
The 0.006685 level is key — potential support for a bounce back into the 0.00675–0.00685 range .
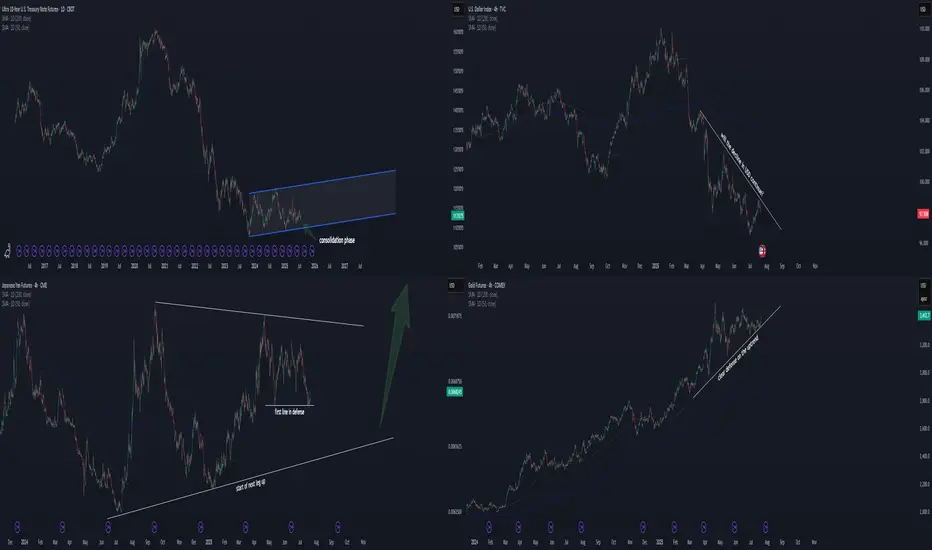
Time to invest in JPY and TN/bond? Hello FX/futures traders!
Market is at a pivotal point. Not in a bad way, but in a good way!
Chart 2: TVC:DXY
Let's start with the US Dollar . A declining USD was just well defended the last few days. If this is true, then the stock up, dollar down scenario is likely to continue. This is good for equities.
Chart 4: COMEX:GC1!
Gold defends its trendline as well. It seems like gold wants to go up more. A raising gold in the current scenario suggests declining USD TVC:DXY . This isn't always true, but we have to look at the current correlation and makes the best educated guess on this.
Logical Deduction 1:
Chart 1: CBOT:TN1!
A consolidation phase has been going on for almost 2 years now. This is definitely
a good sign to long bond, as at least we know the likely bottom for stoploss. With dollar leaning down and gold up, I think TN will defend its current level around 110-113.
Logical Deduction 2:
Chart 3: CME:6J1!
JPY is defending its first key level since May 2025. A wedge is forming, and the breakout is about to take place later this year. Likely the consolidation phase will take more time (with likelihood to breakout to either side). But with a declining USD side by side, I consider now a good entry point to long JPY with controllable risk.
Let me know what you think!
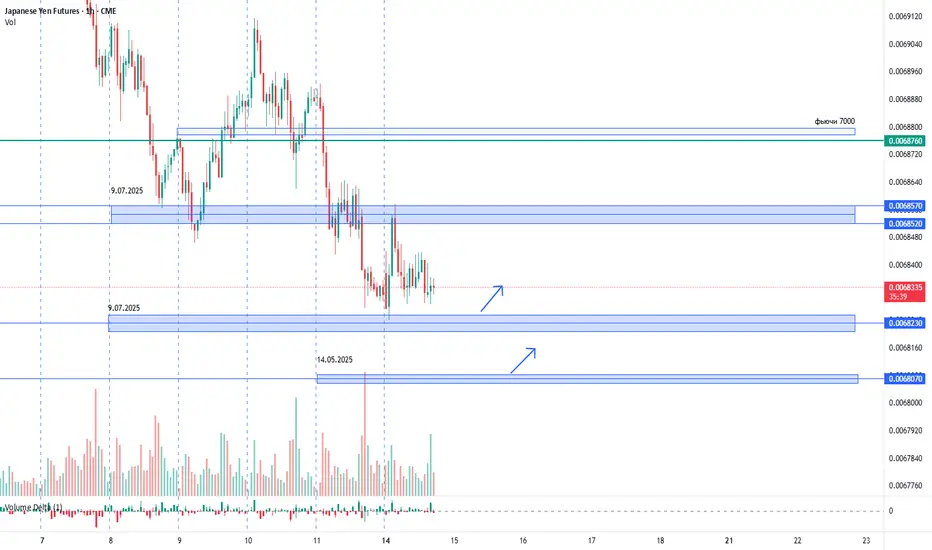
USDJPY. 14.07.2025. The plan for the next few days.The nearest interesting resistance zones have already been worked out at night and have given a good reaction. Let's mark the others where we can expect a reaction. It's not certain that there will be a major reversal, but I believe we will see a correction that can be monetized. We are waiting for a reaction and looking for an entry point.
The post will be adjusted based on changes.
Don't forget to click on the Rocket! =)
JPY/USD 6J Futs : Alignment Across All Frameworks🧭
✅ 1. Macro Outlook (Bearish JPY → Bullish USDJPY → Bearish JPYUSD short-term)
BOJ is behind the curve (still dovish)
Fed remains restrictive
Japan faces weak exports, aging demographics, and trade shocks
Result: Short-term pressure on JPY → price consolidates in Discount zone
🟢 This explains the bottom formation seen around 0.00675–0.00685
✅ 2. Medium-Term DSS Prediction
VolanX & DSS show near-term stagnation, then potential recovery after risk shifts
Projection favors a slow grind higher after liquidity sweep, possibly forming a higher low
📈 Matches the zone around Equilibrium ~ 0.00691–0.00697 before a wave up
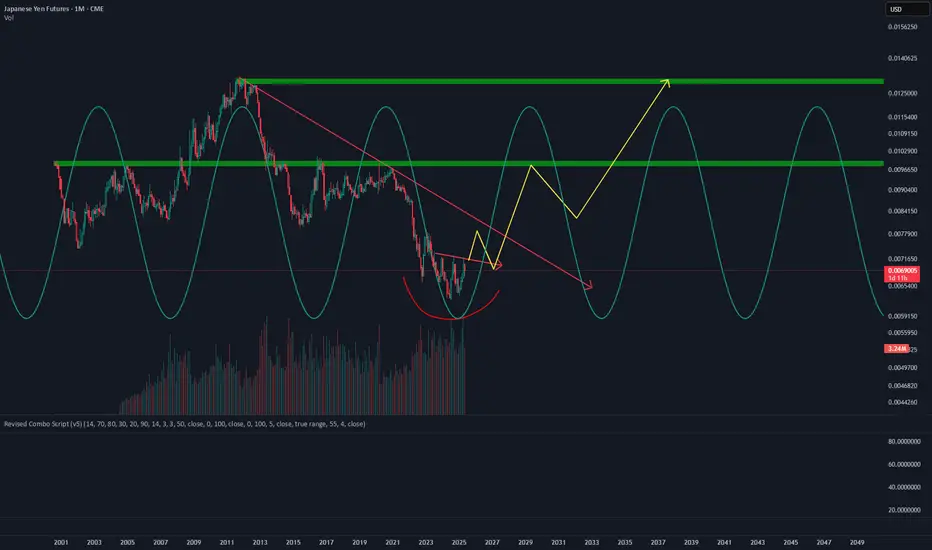
✅ 3. Long-Term Technical Structure (Chart You Posted)
Chart Highlights:
📉 Completed BOS (Break of Structure) near 2022–2023
🧠 CHoCH (Change of Character) bullish confirmed in late 2024
🔵 Discount + Wick Low at ~0.00657–0.00675 held firmly
⚖️ Current price around Equilibrium zone (0.00691–0.00697) acting as re-accumulation
🔴 Large Premium supply zone at 0.00785–0.00875, then full projection toward:
0.0099735 (Fib 0.618)
0.0112330 (Fib 0.382 from all-time range)
🟡 Structure shows a rounded bottom → equilibrium → rally into premium
🔮 Synthesized Forecast (Multi-Timeframe Outlook)
Timeframe Bias Forecast Price Key Zone
1–2 weeks Neutral/Bearish 0.00685–0.00690 Discount equilibrium zone
3–6 weeks Reversal Bullish 0.00695–0.00715 Micro-premium retest zone
6–12 months Bullish 0.00775–0.00885 Long-term premium targets
2–3 years Expansion Bullish 0.0099735 → 0.0112330 Long-term Fibonacci targets
✅ Final Confirmation
Yes, this chart confirms and aligns perfectly with:
📊 The macro outlook (BOJ lag + Fed pause → JPY depreciation short term, followed by reversion)
🤖 Your DSS and VolanX system predictions
🧠 A smart money thesis showing accumulation > break > expansion

July 7 - 11th: Sell The RIPs, Buy The DIPs! (PART 2)Welcome back to the Weekly Forex Forecast!
This is Part 2 of the FOREX futures outlook for the week of July 7 - 11th.
In this video, we will analyze the following FX markets:
CHF and JPY
Last Friday was a bank holiday, so the price action is discounted. This Monday has no red folders on the calendar, so the environment is set for a day of misdirection. Be careful to take only trades that confirm your directional bias!
USD is still weak, and analyst have determined the FED will put off cutting rates until September. Tariffs wars may start up again July 9th. And Trumps Bill can add 3+ trillion to the debt.
None of this supports the USD!
Look to buy the dips xxx USD, and look to sell the rips vs USD xxx.
Enjoy!
May profits be upon you.
Leave any questions or comments in the comment section.
I appreciate any feedback from my viewers!
Like and/or subscribe if you want more accurate analysis.
Thank you so much!
Disclaimer:
I do not provide personal investment advice and I am not a qualified licensed investment advisor.
All information found here, including any ideas, opinions, views, predictions, forecasts, commentaries, suggestions, expressed or implied herein, are for informational, entertainment or educational purposes only and should not be construed as personal investment advice. While the information provided is believed to be accurate, it may include errors or inaccuracies.
I will not and cannot be held liable for any actions you take as a result of anything you read here.
Conduct your own due diligence, or consult a licensed financial advisor or broker before making any and all investment decisions. Any investments, trades, speculations, or decisions made on the basis of any information found on this channel, expressed or implied herein, are committed at your own risk, financial or otherwise.

Buy the Dip into 0.0070 Pre-Expiry Pin & Policy RiskThe Japanese yen has experienced significant swings in recent weeks, both higher and lower, reflecting a fragile balance between diverging monetary policies and ongoing geopolitical uncertainty. That said, its status as a safe-haven currency continues to offer it defensive appeal among global investors, independent of technical flows, such as the major USD/JPY option expiry scheduled for Monday, June 16.
Fundamental Analysis
Central banks have entered a wait-and-see mode. The Federal Reserve is widely expected to hold rates steady at its upcoming June 18 meeting. According to the CME FedWatch tool, markets price in a 97% probability of no change, with only a 3% chance of an immediate cut. In this context, the USD still benefits from rate differentials, but forward guidance is now increasingly balanced over the next 6 months.
Meanwhile, the Bank of Japan has started to normalize its ultra-loose policy. After decades of zero or negative interest rates, the BoJ raised its policy rate to 0.50% in January 2025. Although no hike is expected on June 17, the central bank has signaled vigilance toward imported inflation and yen depreciation. As a result, the USD/JPY interest rate gap remains wide but is gradually narrowing.
On the geopolitical front, Israel’s recent airstrike on Iranian strategic sites has lifted energy prices and reignited risk aversion. The VIX briefly jumped around 22, before retreating to 20. Historically, such uncertainty tends to benefit the yen, as risk-averse capital flows gravitate toward defensive assets.
Technical Analysis
The Japanese currency has gained over 8% year-to-date, with spot USD/JPY retreating to a low of 140 in April. This level corresponds to 0.007263 on the 6JU2025 futures contract.
We now shift focus to the September contract, with the March expiry settling this Monday.
After the volatility spike mostly driven by US tariffs (which pushed the VIX above 50 for the first time since the pandemic), risk conditions have stabilized. The yen has since consolidated within a well-defined range with stable volumes.
In late May, buyers stepped in aggressively around 0.00692, leading to a sharp rebound to 0.00710. Price action has now stabilized near 0.00700, inside a pivot zone that acts both as equilibrium and a tactical entry area. These dynamics suggest a buy-on-dip strategy may offer strong asymmetry.
If price returns to the 0.00692–0.00700 area, the trade setup remains valid. However, a clean daily break below 0.00691 would invalidate the bullish view and suggest a return to a broader sideways range.
Sentiment Analysis
According to the CFTC Commitment of Traders (COT) report, asset managers remain net long the yen, reflecting a structurally bullish bias. These positions are consistent with macro/geopolitical hedging strategies, and reflect growing expectations that the policy rate differential between the Fed and the BoJ may gradually narrow.
On the retail side, positioning is surprisingly neutral on USD/JPY, a rare condition for a pair often dominated by consensus directional trades. This suggests that retail traders are in a wait-and-see mode, likely due to the policy event risk ahead.
Options Analysis – The $7 Billion USD/JPY 145.00 Magnet
A massive $7+ billion USD/JPY option position at the 145.00 strike is due to expire Monday, June 16, at the 10am NY cut. This level currently acts as a gravitational anchor on spot price action, keeping USD/JPY within a tight range near 145.
Market makers are likely adjusting hedges as expiry approaches, suppressing volatility in the short term. This has also indirectly stabilized the 6JU2025 contract in the 0.00700–0.00705 range.
Once the strike expires, we may see a volatility release and potentially a new trend emerge, depending on the Fed-BoJ policy tone.
Trade Idea – Buy on Dip Around 0.00700
Strategy: Buy the pullback ahead of expiry and potential breakout
• Entry target: Buy at 0.0070000 (tactical dip zone)
• Stop-loss: 0.0069100 (below the May 29 rejection low)
• Take-Profit 1: 0.0071000 (recent resistance)
• Take-Profit 2: 0.0072500 (near YTD highs)
Rationale:
Geopolitical risk and Fed-BoJ policy events support safe-haven flows
• Technically clean reaction from 0.00692 suggests strong buying interest
• Option expiry-induced pin near spot 145 could offer a lower entry window
• COT positioning supports a bullish JPY view
• Attractive risk-reward setup with tight stop
This setup allows traders to take advantage of a volatility compression regime due to options expiry before potential breakout catalysts next week, with well-defined risk.
The 6JU2025 contract is currently resting in a strategic equilibrium zone near 0.00700. Macro fundamentals and speculative positioning both argue in favor of yen stabilization or modest appreciation.
The expiry of the $7B option on Monday, followed by central bank events midweek, could unleash a directional move. Until then, a dip-buying strategy near 0.0070 appears compelling, as long as the 0.00691 support holds on a daily closing basis.
When charting futures, the data provided could be delayed. Traders working with the ticker symbols discussed in this idea may prefer to use CME Group real-time data plan on TradingView: tradingview.com/cme/.
This consideration is particularly important for shorter-term traders, whereas it may be less critical for those focused on longer-term trading strategies.
General Disclaimer:
The trade ideas presented herein are solely for illustrative purposes forming a part of a case study intended to demonstrate key principles in risk management within the context of the specific market scenarios discussed. These ideas are not to be interpreted as investment recommendations or financial advice. They do not endorse or promote any specific trading strategies, financial products, or services. The information provided is based on data believed to be reliable; however, its accuracy or completeness cannot be guaranteed. Trading in financial markets involves risks, including the potential loss of principal. Each individual should conduct their own research and consult with professional financial advisors before making any investment decisions. The author or publisher of this content bears no responsibility for any actions taken based on the information provided or for any resultant financial or other losses.

Weekly FOREX Forecast Jun 2 - 6th: CHF & JPY FuturesThis is the FOREX futures outlook for the week of Jun 2 - 6th.
In this video, we will analyze the following FX markets:
CHF JPY
It's been a consolidative week, but the USD is still weak. Look for valid breakdowns of consolidations before buying against the USD.
NFP week ahead! Mon-Wed will be the best days to trade.
Enjoy!
May profits be upon you.
Leave any questions or comments in the comment section.
I appreciate any feedback from my viewers!
Like and/or subscribe if you want more accurate analysis.
Thank you so much!
Disclaimer:
I do not provide personal investment advice and I am not a qualified licensed investment advisor.
All information found here, including any ideas, opinions, views, predictions, forecasts, commentaries, suggestions, expressed or implied herein, are for informational, entertainment or educational purposes only and should not be construed as personal investment advice. While the information provided is believed to be accurate, it may include errors or inaccuracies.
I will not and cannot be held liable for any actions you take as a result of anything you read here.
Conduct your own due diligence, or consult a licensed financial advisor or broker before making any and all investment decisions. Any investments, trades, speculations, or decisions made on the basis of any information found on this channel, expressed or implied herein, are committed at your own risk, financial or otherwise.

6J Weekly TrajectionsWe got a good lower target liquidity and a nice rejection off of 4H FVG. This is my idea on where the price will be going over the next week.

Japonese will Growth Hello. Fine ? me yes.
The dollars empire is over. Time for others currencies to go up.
Japonese Yen will go up.
Consolidation and accumulation at bottom.
Long when red line is break. Good luck.

Yen tells a different storyDespite the poor data that came out of Japan, the price action has been telling a different narrative. I'm going to pay attention on this asset until it has reached towards the Weekly objective. I'd like to see the price purge the obvious swing high as noted and fails to push higher to confirm my bias. Fundamentally all the data is supporting for the Yen to have a bearish outlook, but until it happens I'll wait for further confirmation.

Downtrend Confirmed Is the Yen About to Weaken Further?Hey Traders so today here is way to trade a downtrending market. See the Yen I have been able to connect 3 Bar trendline projecting it lower. But as you can see it has now pulled back to the trendline this is normally the best place to sell beacause momentum is on your side. Not only that but it also closed below the 50% retracement level which is also a strong bearish sign.
So if your going to think about selling YEN this is a good place.
However if your going to be bullish yen wait until a close about resistance.
Always use Risk Management!
Hope This Helps Your Trading
Clifford

How to Trend the Trend for Beginners part 3 Hey Traders so today we are going to the final part of the series for beginners about how to trade trends using techincal analysis.
So today we will go over what I believe is the best way to confirm that the market is trending using the best method.
Enjoy!
Clifford

The Yen’s Comeback Starts Here—and it Seems the COT Knew First1. Introduction: A Market Everyone Gave Up On
For a while, the Japanese Yen looked like a lost cause. After topping out in early 2021, Yen futures (6J1!) began an unrelenting slide, shedding value week after week like an old coat in spring. Traders stopped asking, “Where’s support?” and started asking, “How low can it go?”
The macro backdrop didn’t help. The Bank of Japan clung to ultra-loose monetary policy, even as the Fed hiked aggressively. Speculators piled on shorts. The Yen was a one-way ticket down, and no one seemed interested in punching the brakes.
But beneath that apathy, a quieter shift was underway. While price kept bleeding, trader positioning began to hint at something different—something the chart didn’t show yet. And if you were watching the Commitments of Traders (COT) report closely enough, you might’ve seen it.
2. The COT Trend That No One Was Watching
The COT report isn’t glamorous. It’s slow, lagging by a few days, and rarely makes headlines. But for those who track what the big players are doing—those large enough to be required to report their positions—it’s a treasure trove of subtle clues.
One of those clues is Total Reportable Positions. This metric tells us how active large market participants really are—regardless of whether they’re long or short. When that number is dropping, it suggests the “big dogs” are losing interest. When it starts climbing again? Someone’s gearing up to play.
From 2021 through most of 2024, Total Reportable Positions in 6J were in a steady decline—mirroring the slow death of the Yen's bullish case. But in late 2024, something changed. Using a simple linear regression channel on this COT data, a clear breakout emerged. Positioning was picking up again—for the first time in nearly three years.
And it wasn’t just a bounce. It was a structural shift.
3. Did Price Listen?
Yes—and no. Price didn't immediately explode higher. But the structure began to change. The market stopped making new lows. Weekly closes began to cluster above support. And importantly, a Zig Zag analysis started marking a pattern of higher lows—the first signs of accumulation.
Here’s where the chart really gets interesting: the timing of the COT breakout coincided almost perfectly with a key UFO support at 0.0065425—a price level that also marked the bottom in COT Traders Total Reportable Longs. This adds a powerful layer of confirmation: institutional orders weren’t just showing up in the data—they were leaving footprints on the chart.
And above? There’s a UFO resistance level at 0.0075395. If the Yen continues to climb, that could be a significant price level where early longs may choose to lighten up.
4. The Contract Behind the Story
Before we go deeper, let’s talk about what you’re actually trading when you pull the trigger on Yen Futures.
The CME Japanese Yen futures (6J) contract represents 12.5 million Japanese Yen, and each tick move—just 0.0000005 per JPY—is worth $6.25. It’s precise, it’s liquid, and for traders who like to build macro positions or take advantage of carry flows, it’s a staple.
As of May 2025, margin requirements hover around ~$3,800 (Always double-check with your broker or clearing firm—these numbers shift from time to time.)
But maybe you’re not managing seven-figure accounts. Maybe you just want to test this setup with more flexibility. That’s where the Micro JPY/USD Futures (MJY) come in.
Contract size: 1/10th the size of 6J
Tick move: 0.000001 per JPY increment = $1.25
Same market structure, tighter margin requirement around ~$380 per contract
Important note: The COT report aggregates positioning across the whole futures market—it doesn’t separate out micro traders from full-size. So yes, the data still applies. And yes, it still matters.
5. Lessons from the Shift
This isn’t about hindsight bias. The value in this setup isn’t that the Yen happened to bounce—it’s how Total Reportable Positions broke trend before price did.
Here are the real takeaways:
COT data may or may not be predictive—but it is insightful. When positioning starts expanding after a long contraction, it often signals renewed interest or risk-taking. That’s tradable information.
Technical support and resistance as well as highs and lows give context. Without them, COT breakouts can feel theoretical. With them, you have real, observable UFO levels where institutions may act—and where you can plan.
6. Watchlist Insights: Where This Might Work Again
You don’t have to wait for another yen setup to apply this framework. The same structure can help you scout for early positioning shifts across the CME product universe.
Here’s a simple filter to start building your own COT watchlist:
✅ Look for markets where:
Price has been in a long, clean downtrend (or uptrend)
Total Reportable Positions are falling—but starting to reverse
A breakout occurs in positioning trend (draw a regression channel and watch for a clean violation)
A key support or resistance lines up with recent extremes in COT positioning
Whether it's crude oil, corn, or euro FX, this template gives you a framework for exploration.
🎯 Want to See More Setups Like This?
We’re just getting started. If this breakdown opened your eyes to new ways of using COT reports, UFO levels, and multi-dimensional trade setups, keep watching this space.
When charting futures, the data provided could be delayed. Traders working with the ticker symbols discussed in this idea may prefer to use CME Group real-time data plan on TradingView: www.tradingview.com - This consideration is particularly important for shorter-term traders, whereas it may be less critical for those focused on longer-term trading strategies.
General Disclaimer:
The trade ideas presented herein are solely for illustrative purposes forming a part of a case study intended to demonstrate key principles in risk management within the context of the specific market scenarios discussed. These ideas are not to be interpreted as investment recommendations or financial advice. They do not endorse or promote any specific trading strategies, financial products, or services. The information provided is based on data believed to be reliable; however, its accuracy or completeness cannot be guaranteed. Trading in financial markets involves risks, including the potential loss of principal. Each individual should conduct their own research and consult with professional financial advisors before making any investment decisions. The author or publisher of this content bears no responsibility for any actions taken based on the information provided or for any resultant financial or other losses.

Weekly Forecasts UPDATES! ALL Markets Analyzed! Stocks & FOREXIn this Weekly Forecast UPDATE, we will analyze the S&P 500, NASDAQ, DOW JONES, Gold and Metals futures, and the FOREX Majors for Thursday, May 8th.
The targets set in last weekend's forecasts are still in play! Trade accordingly.
Enjoy!
May profits be upon you.
Leave any questions or comments in the comment section.
I appreciate any feedback from my viewers!
Like and/or subscribe if you want more accurate analysis.
Thank you so much!
Disclaimer:
I do not provide personal investment advice and I am not a qualified licensed investment advisor.
All information found here, including any ideas, opinions, views, predictions, forecasts, commentaries, suggestions, expressed or implied herein, are for informational, entertainment or educational purposes only and should not be construed as personal investment advice. While the information provided is believed to be accurate, it may include errors or inaccuracies.
I will not and cannot be held liable for any actions you take as a result of anything you read here.
Conduct your own due diligence, or consult a licensed financial advisor or broker before making any and all investment decisions. Any investments, trades, speculations, or decisions made on the basis of any information found on this channel, expressed or implied herein, are committed at your own risk, financial or otherwise.
