Why Every Trend Begins and Ends With LiquidityEvery trend in crypto begins and ends with liquidity. Before a trend can move with force, the market must collect the stop orders that provide the fuel for expansion. These orders sit above equal highs, below equal lows, inside inefficiencies, and around obvious retail breakout levels. Price does no
Related futures

Swing Failure Pattern (SFP): When Price ReversesThe swing failure pattern is a liquidity event, not a candle pattern. It marks the moment when the market reaches for obvious stops, absorbs them, and reveals true intent.
An SFP forms when price trades beyond a well-defined swing high or low and then fails to hold acceptance outside that level. Th

17/12/2025 $BTC - $DXY -$SPX - $NDX - $GOLD forecastGold and Bitcoin should be the sole indexes witnessing a correction tomorrow. overall bullish energy will keep accompaining Bitcoin until the next week, but for what concerns tomorrow the trend should be downwards oriented

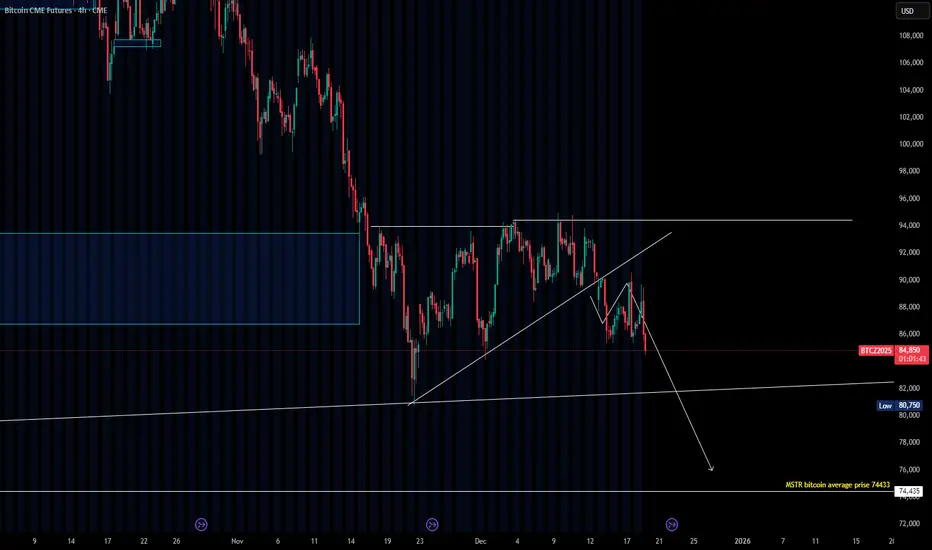
BTC CME: Short Scenario Progressing, but Macro Context MattersBTC CME continues to follow the short scenario as planned and is approaching the first downside target at 84,000.
I expect further gradual downside continuation with a potential update of local lows.
However, today’s macro data must be taken into account.
US inflation came in significantly lower th
BTC1!Risked ~800 down for 4,000 - 8,000 up from high 85s yesterday, even from this current juncture it's an appealing R/R if risking 2,800 down (invalidated on new lows) for 7,000 (Yearly Open test) up. I believe 2025 closes very close to its open as that's probably the most ironic outcome despite the ro

Tokenization Push by US Government Will Unleash a Demand ShockCME: Micro Bitcoin Futures ( CME:MBT1! ) and Micro Ether Futures ( CME:MET1! )
On December 8th, U.S. Commodity Futures Trading Commission (CFTC) announced the launch of a digital assets pilot program for certain digital assets, including BTC, ETH, and USDC, to be used as collateral in derivatives

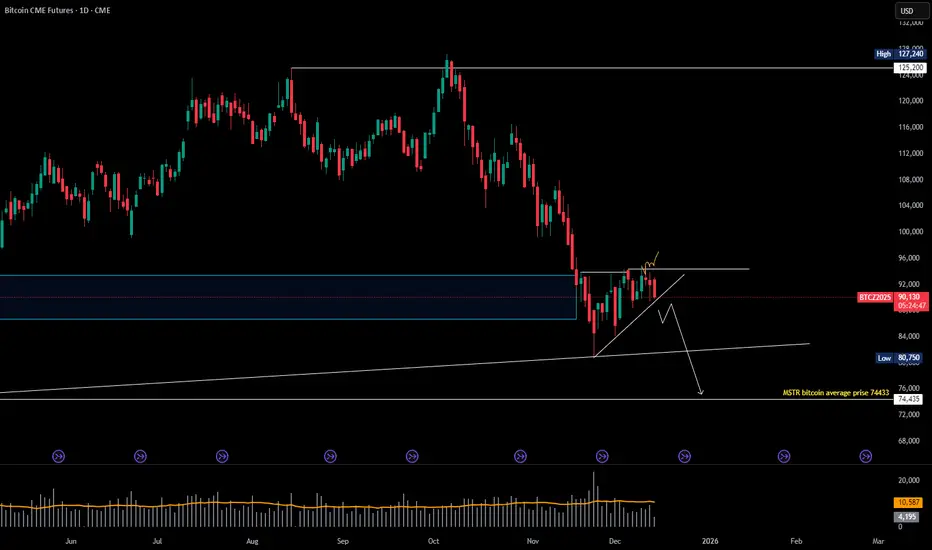
Bitcoin is waving a flag, but it's not the kind to saluteThe daily chart is indicating a textbook bear flag pattern breaking down.
A bear flag is a bearish continuation setup characterized by:
- Sharp sell-off (flagpole)
- Small upward/sideways consolidation (flag)
- Directional breakdown lower
This pattern often signals short-term downside momentum and

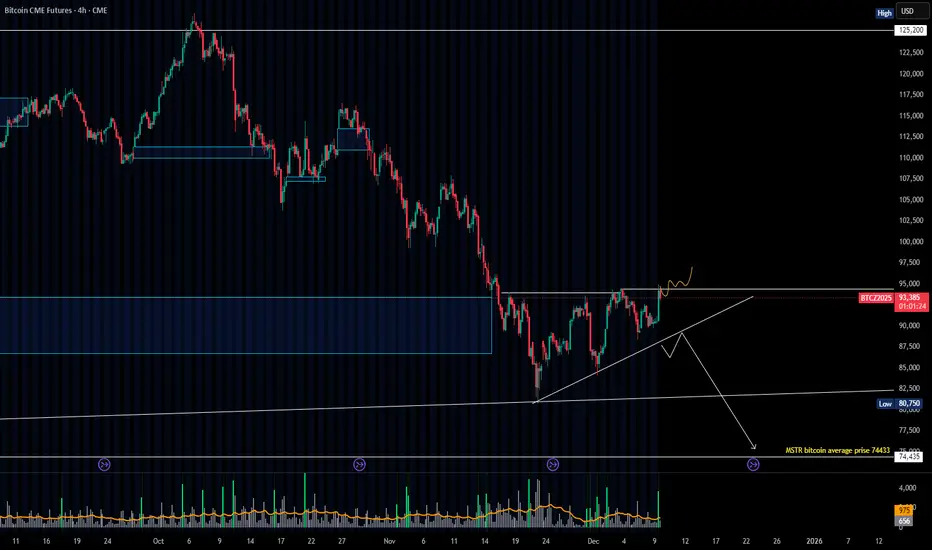
BTC CME: Sideways Structure and Key Levels AheadBTC CME continues to move within a sideways range, offering no clear trend direction at the moment.
As outlined earlier, the key zones remain unchanged:
Long confirmation: Break and consolidation above 95,000.
Short confirmation: Breakdown of the trendline below 90,000.
Currently, the asset is pr
max pain in sight for the bullsgm,
i've been entertaining a few ideas on btc, and this one comes to mind today.
the possibility of 1 more leg down, to take the rest of the longs that fomoed into the rally this week, and the few who managed to survive the drop from ath by averaging down mindlessly.
---
the way we bounced is ve

BTC CME: Key Level Retest and Liquidity SweepBTC CME demonstrated strong growth today on increased volume, reaching last week’s highs and sweeping liquidity.
Currently, the asset is trading directly inside last week’s high zone. I’m waiting for today’s daily close to define the next direction.
Bullish scenario: Daily close above the level wi
See all ideas
Displays a symbol's price movements over previous years to identify recurring trends.