Dont get trapped chasing the Opening gap Bitcoin Hello and Welcome
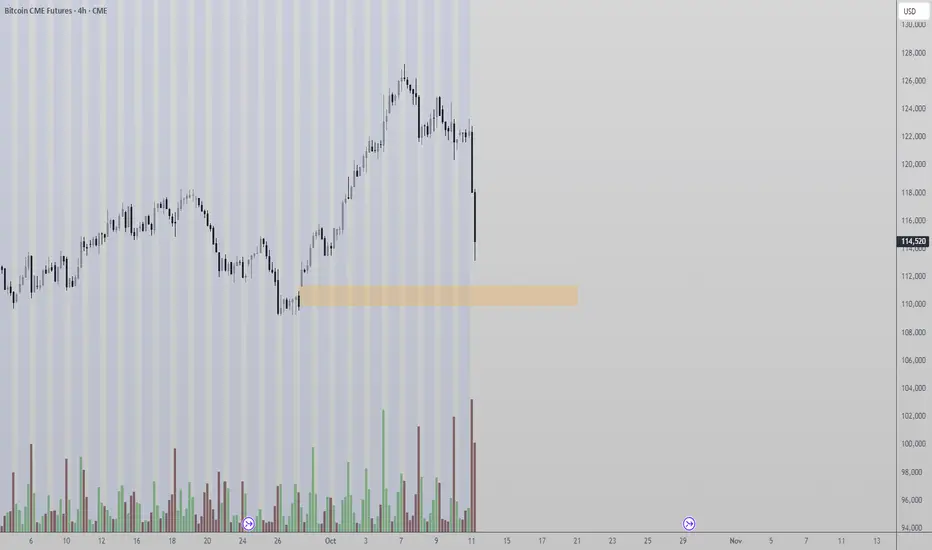
Here I present to you a quick theory on the Bitcoin CME open in the event we gap down and open in the 112K range.
This idea is just something to consider in the week ahead, with many traders destroyed as a result of Fridays crash and emotions running high going into the week
Related futures

Bitcoin CME Futures Gap Signals Potential Reversal ZoneBitcoin CME Futures have drawn traders’ attention as price action hovers around a critical gap zone. Historically, these gaps tend to act as magnets for price, often leading to retracements or reversals once filled. The recent move to $102K and subsequent rebound toward $112K marks a key technical e
Reviewed several markets10 7 2025 this is actually still on the 6th I will turn to the 7th and a half hour or so.
I looked at several markets including Lumbar... And oil which I don't particularly like right now. I took a quick look at silver which didn't really move since early this morning.
in many ways this is an aty

A simple Introduction to Footprint charts
Welcome to this educational video on footprint charts .
I decided to do this introduction because I feel it would benefit so many traders who are unfamiliar with this chart type and once understood it can serve as a very powerful additional confluence in your day to day trading .
I hope I have

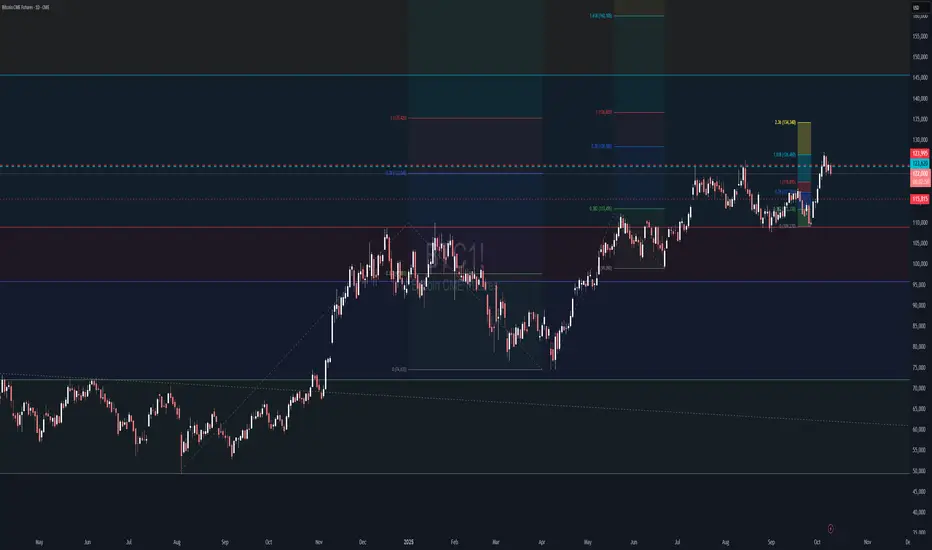
$BTC1! Price reaching interesting support of a GAP from November - December 2024.
Indicators decreasing and looking for an oversold zone.
Price looking for a strong support zone on this area, before reaching the target on the chartist rate figure... .
If this theory is confirmed, we can support our monthly

BTC1WEEK
PRICE: Pullbcak at current resistance, new all-time high at weekly candle close developing. Giving confirmation to the above, we can argue for the continuation of the bullish trend under the parameters of the monthly analysis.
RSI: In an overbought zone and looking for an all-time high, waiting

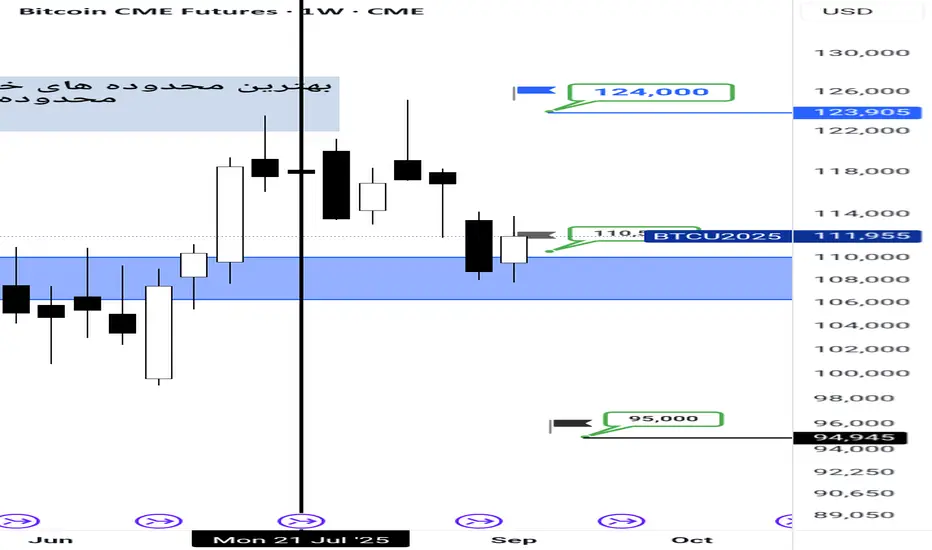
Bitcoin Analysis Before Reaching Historical Highs!!The chart you see before Bitcoin reached its historic high was done within the time frame of the vertical line on the chart! However, as I noted in Persian, it seems that Bitcoin will continue on its path within the specified ranges and the price target will again be in the range of $124,000 per Bit
$BTC CME GAP @ $111k - One Last Flush?FYI CRYPTOCAP:BTC CME GAP @ $111k
NBD ~3.5% down from here.
Would be best to fill sooner rather than later so that it's not laying around for sell pressure.
PA got rejected and closed the day below the 50MA which hopefully gives us one last flush before UpTober.
Maybe the government shutdown

BTC rally PeriodAS you see,btc follows circles from start to the end of rally.It may be look impossible but chart says so. Let's see in future.

Why its bullishGrayscale's GBTC outflows, often perceived as selling, are actually bullish for Bitcoin's market cycle. These outflows reflect investors redeeming shares from a high-fee trust (GBTC) and rotating into lower-cost ETFs like BlackRock's IBIT, which has absorbed massive inflows (e.g., ~$900M on October
See all ideas
Displays a symbol's price movements over previous years to identify recurring trends.
Frequently Asked Questions
The nearest expiration date for BTIC on Bitcoin Friday Futures is Nov 7, 2025.
Traders prefer to sell futures contracts when they've already made money on the investment, but still have plenty of time left before the expiration date. Thus, many consider it a good option to sell BTIC on Bitcoin Friday Futures before Nov 7, 2025.