Liquidity Zones Explained: Where Smart Money GoesMarkets don’t move randomly. Every candle, spike, or reversal happens for a reason and that reason is liquidity.
Liquidity is what fuels price movement. It’s where buy and sell orders are concentrated, and where large players execute positions without showing their hand.
Understanding where liquid
Related futures

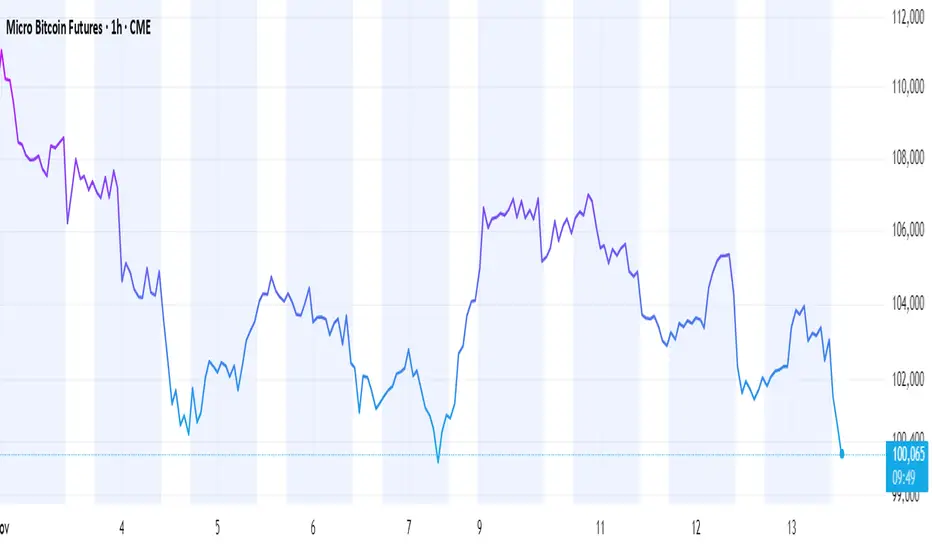
BTC Update📊 CRYPTOCAP:BTC Update
Remember guys — BTC can still move toward the $92,000 area 💰
This level lines up with the CME gap that could be filled 🔄
Nothing guaranteed, but it remains a possible target if the trend continues 📈

Diversified Futures Paper Trading Setup: 5 Instruments, BalancedDetails / Description:
Today, I set up a paper trading portfolio on TradingView using 5 instruments from different sectors/industries to practice diversification, risk management, and leverage.
Strategy Highlights:
Selected 1 instrument from each industry to reduce sector-specific risk.
CME
Bitcoin Technical Breakdown: Still Bearish We revisited Bitcoin We revisited Bitcoin recently and the technicals remain grim:
- 200-day MA erosion continues
- RSI stays low = persistent weakness
- Price & lagging line both below the Ichimoku cloud
- MACD still negative
- Lower highs, lower lows = downtrend intact
So why watch this chart?
If you're already short,

BTC Analysis | CME GapHello friends
Bitcoin’s critical gap between $91,500 and $92,500 could serve as a short-term correction target if selling pressure continues.
A gap that closes could set the stage for a bottom and a continuation of the uptrend.
The price’s reaction to this area will determine the market’s next di

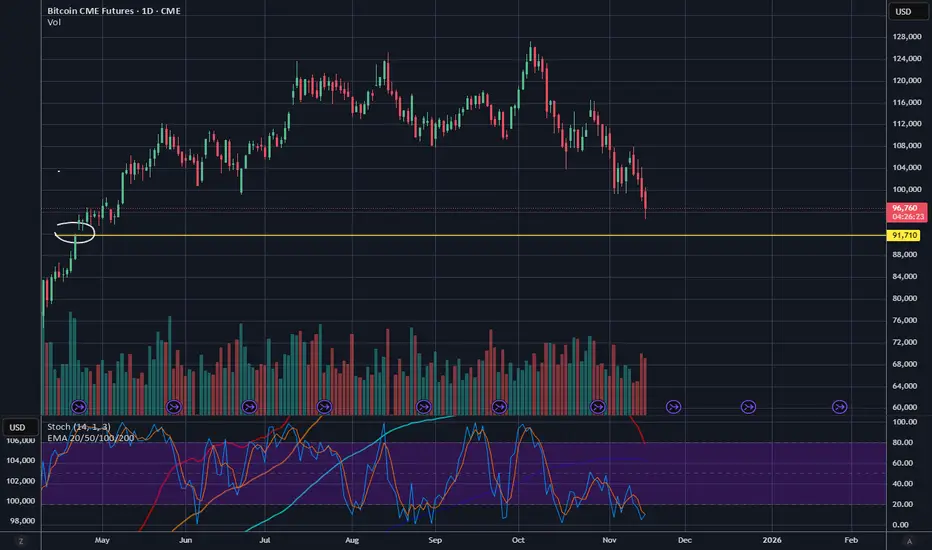
BTC Death Cross and Filling CME GapHello traders,
Well BTC is in a pickle.. Its lost 100K and the death cross is about to occur by Sunday 11-16-2025. A deathcross is when the 50DMA crosses the 200DMA. Sounds ominous but for bitcoin many times it has market the bottom before it reverses higher. Whats even more crazy is Bitcoin always

CME Gap closure at 92k early DecemberGotta close them all. Fractal analysis, an update to my previous chart.

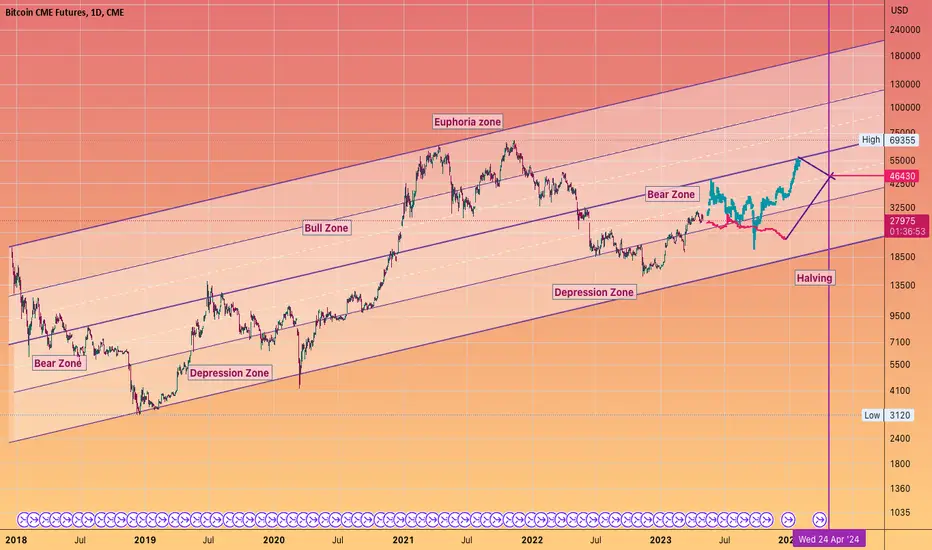
#BITCOIN pathways for the halveningroute 1
or route 2
or a new pathway (Most likely)
next April we will be at $50k
Bitcoin’s battle to stay above $100KLast time Bitcoin was at $100K, it ran up another $24K over the course of about 3 weeks. That retest of that price was a single day’s price action. Bitcoin has been hovering around $100K this entire week after falling. If it breaks below and closes then I can see some major selling pressure coming i

BTC CME - One final push down to close the gap?There is unfilled CME gap at $91,700 that remains unfilled. Could we have one more push down to fill it?
See all ideas
Summarizing what the indicators are suggesting.
Neutral
SellBuy
Strong sellStrong buy
Strong sellSellNeutralBuyStrong buy
Neutral
SellBuy
Strong sellStrong buy
Strong sellSellNeutralBuyStrong buy
Neutral
SellBuy
Strong sellStrong buy
Strong sellSellNeutralBuyStrong buy
A representation of what an asset is worth today and what the market thinks it will be worth in the future.
Frequently Asked Questions
The current price of Micro Bitcoin Futures (Apr 2026) is 97,035 USD — it has fallen −3.80% in the past 24 hours. Watch Micro Bitcoin Futures (Apr 2026) price in more detail on the chart.
Track more important stats on the Micro Bitcoin Futures (Apr 2026) chart.
The nearest expiration date for Micro Bitcoin Futures (Apr 2026) is Apr 24, 2026.
Traders prefer to sell futures contracts when they've already made money on the investment, but still have plenty of time left before the expiration date. Thus, many consider it a good option to sell Micro Bitcoin Futures (Apr 2026) before Apr 24, 2026.
Buying or selling futures contracts depends on many factors: season, underlying commodity, your own trading strategy. So mostly it's up to you, but if you look for some certain calculations to take into account, you can study technical analysis for Micro Bitcoin Futures (Apr 2026). Today its technical rating is strong sell, but remember that market conditions change all the time, so it's always crucial to do your own research. See more of Micro Bitcoin Futures (Apr 2026) technicals for a more comprehensive analysis.