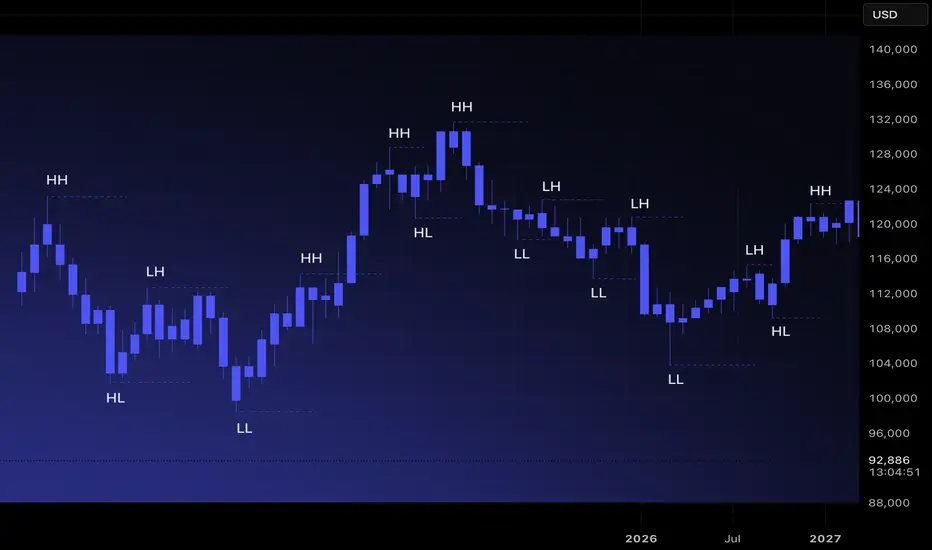
Market Structure 101: Navigating Price ActionMost traders jump directly into indicators, oscillators, or patterns. Yet every chart has a deeper foundation that determines direction long before any tool is applied. Market structure is that foundation. When you understand how price forms highs, lows, and transitions between them, you stop reacti
Related futures
Bitcoin CME Futures – Key Support Test With a Long-Term Target aBitcoin CME Futures has broken below several Fibonacci levels and is currently reacting inside a major demand zone between 88,000 – 82,000. This area represents the last strong bullish defense before a deeper correction.
The sell-off shows strong bearish momentum, but the long lower wick indicates

BTC over view. I've been away from the charts for most of the year but I feel like it's time. price hasn't really done anything significant still tradaing around the yearly open. Theres a lot of potential in the market, BTC dominance dinamic could be about to change.
I don't know if I'm back, but I'm definitely i

Triple Gap and yearly BounceThere's quite a bundle of supports here and if we get a bounce the target will most likely be the unclosed CME gap at 117k. The price could still go a bit lower but I don't think by that much. I don't expect this rally to be as strong as the last BTC idea I had but I expect alts to go up if we get a

BTC (MBT) on the way ot 86'000Price reacted very well at the white and red fork lines (see arrows).
We have left the white centerline, and now price is hovering around the red one. If we get an open and close below it, we’ll have a new target: the WL1 of the white fork, which unsurprisingly, lines up with the red L-MLH.
Rough

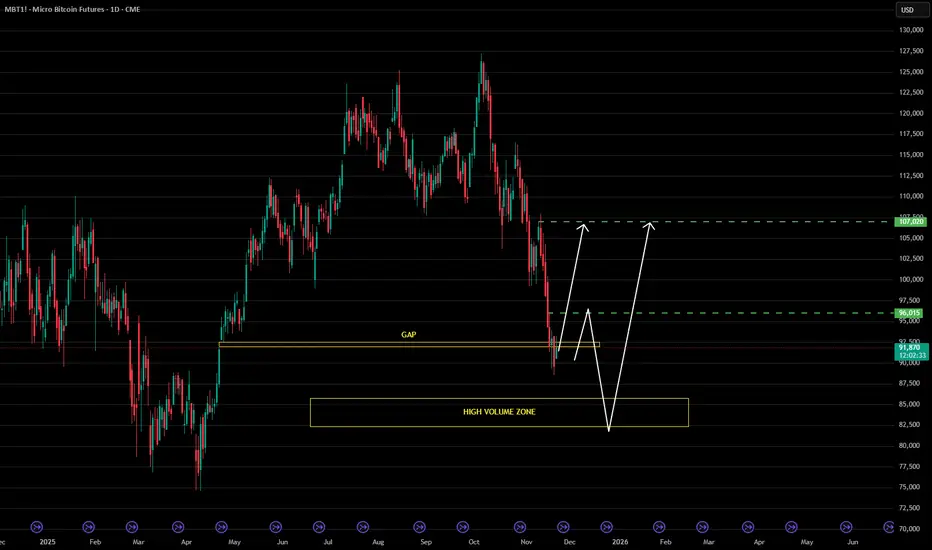
Bitcoin: Two Development Scenarios from Gap Closure ZoneCurrent Situation
Bitcoin has completed a sharp decline and is located in the critical gap closure zone. The chart shows two key technical elements: a resistance level in the upper part of the range and a high volume zone (HIGH VOLUME ZONE) significantly below current prices. Price has stopped preci
Bitcoin Holds 90k (For Now), 70k A Real PossibilityMy bearish bitcoin target outlined in the middle of October came to fruition this week. I update my levels and technical reasoning as to how it could still head for 70k after a potential bounce.
Matt Simpson, Market Analyst at City Index

BTC’s Toxic Relationship with Support LevelsMarket Prophecy is back
Price made a rejection on the weekly timeframe and successfully broke through daily support at 98,920. Now, it looks like BTC might pull a classic move—retracing to the 50–61.8% Fibonacci zone, just like its previous wave—before continuing its dramatic dive toward the next s

BTC Analysis | CME GapHello friends
Bitcoin’s critical gap between $91,500 and $92,500 could serve as a short-term correction target if selling pressure continues.
A gap that closes could set the stage for a bottom and a continuation of the uptrend.
The price’s reaction to this area will determine the market’s next di

Bitcoin at the Edge – What Comes Next?Over the past couple of months, Bitcoin has been navigating a complex mix of macro shifts, liquidity changes, and sector-specific catalysts that, in our opinion, have pushed the market into a critical decision zone. Sentiment has become increasingly divided: long-term structural bulls remain confide

See all ideas
A representation of what an asset is worth today and what the market thinks it will be worth in the future.
Displays a symbol's price movements over previous years to identify recurring trends.
Frequently Asked Questions
The nearest expiration date for Micro Bitcoin Futures (Apr 2024) is Apr 29, 2024.
Traders prefer to sell futures contracts when they've already made money on the investment, but still have plenty of time left before the expiration date. Thus, many consider it a good option to sell Micro Bitcoin Futures (Apr 2024) before Apr 29, 2024.