Liquidity Zones Explained: Where Smart Money GoesMarkets don’t move randomly. Every candle, spike, or reversal happens for a reason and that reason is liquidity.
Liquidity is what fuels price movement. It’s where buy and sell orders are concentrated, and where large players execute positions without showing their hand.
Understanding where liquid
Related futures

Bitcoin’s battle to stay above $100KLast time Bitcoin was at $100K, it ran up another $24K over the course of about 3 weeks. That retest of that price was a single day’s price action. Bitcoin has been hovering around $100K this entire week after falling. If it breaks below and closes then I can see some major selling pressure coming i

Everytime PA touched 200ema you have reboundedOver 400,000 BTC changed hands in 24 hours, dropping the price below $100K and shaking market confidence.
Technical analysis says a long a short-term bearish trend.
However everytime PA touched the 200 ema has touched PA has rebounded.
Bearish divergance has been indicating on OBV and RSI... has t

Bitcoin Bounce Underway, But Bears May Not Be Done YetMy initial 100k downside target has been reached. While we’re seeing the almost obligatory bounce from a key level, Bitcoin could still head towards 90k. I take a fresh look at Bitcoin futures and their correlation with Wall Street.
Matt Simpson, Market Analyst at City Index

The Double Bottom Trap That Traders Might Miss1. The Comfort Zone of Classic Patterns
Few formations attract traders’ attention like a double bottom. It’s one of those timeless chart patterns that promise hope after a long decline—a visual story of selling exhaustion followed by a bullish reversal.
But markets rarely reward what’s obvious. I

Bitcoin: from Pet Rock to Loan CollateralCME: Micro Bitcoin Futures ( CME:MBT1! ) and Micro Ether Futures ( CME:MET1! )
Last week, JPMorgan Chase Chairman and CEO Jamie Dimon acknowledged that crypto, blockchain, and stablecoins are "real”, and “we’ll all use them". This marks a notable shift in tone from the longtime Bitcoin critic.
I

BTC1! : Possible move to the CME Gapfill at 92kDouble top with a measured target close to the CME Gap at 92k.
There could be a wick down close to this area to close the gap and release stuck liquidity before the uptrend continues,

Bitcoin Technical Breakdown: Bearish Signals BuildingToday we’re taking a closer look at Bitcoin, which is showing increasingly negative technical signals across multiple timeframes. Let’s break it down:
Daily Chart: Confirmed Downtrend
• Bitcoin is now technically in a down move, defined by a sequence of lower reaction highs and lower reaction lows

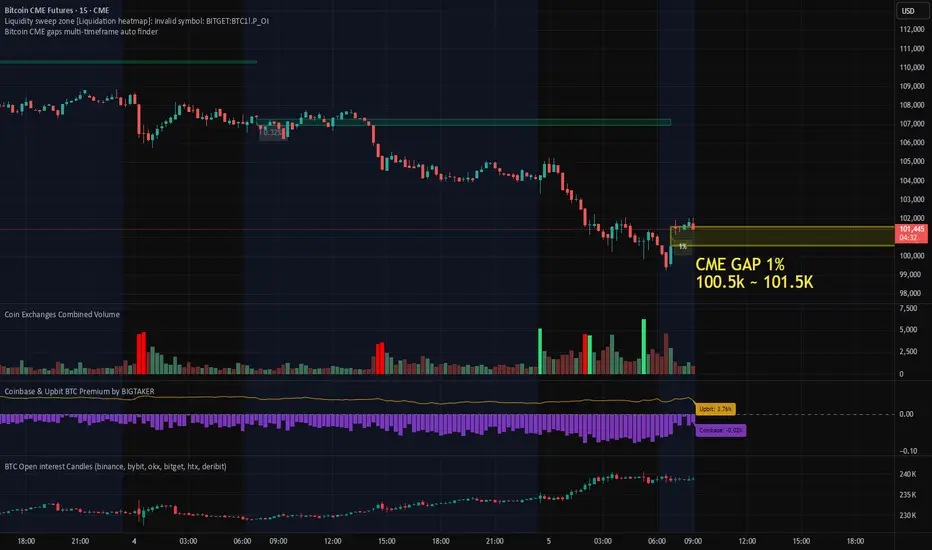
1% Bitcoin CME Gap Formed, Futures Market Data AnalysisThis morning, a ~1% gap formed on the Bitcoin CME futures chart.
Given that the gap occurred after a sharp decline, it’s important to consider the possibility of both a gap fill and a retest of recent lows in the short term.
The Coinbase Premium remains in negative territory, though it has shown sl
BTC CME CHART INDICATES A BEARISH NOVEMBER GOING BELOW 100K BTC has two bullish CME gap unfilled, very possible the banks and governments want to liquidated traders, but the only way to the bulls below the market has to go the market will have to go back below 100K,The easy algo and other technicals indicate the the market may push to the the all time high

See all ideas
Summarizing what the indicators are suggesting.
Neutral
SellBuy
Strong sellStrong buy
Strong sellSellNeutralBuyStrong buy
Neutral
SellBuy
Strong sellStrong buy
Strong sellSellNeutralBuyStrong buy
Neutral
SellBuy
Strong sellStrong buy
Strong sellSellNeutralBuyStrong buy
A representation of what an asset is worth today and what the market thinks it will be worth in the future.
Displays a symbol's price movements over previous years to identify recurring trends.
Frequently Asked Questions
The current price of Micro Bitcoin Futures (Dec 2026) is 110,190 USD — it has fallen −3.11% in the past 24 hours. Watch Micro Bitcoin Futures (Dec 2026) price in more detail on the chart.
Track more important stats on the Micro Bitcoin Futures (Dec 2026) chart.
The nearest expiration date for Micro Bitcoin Futures (Dec 2026) is Dec 24, 2026.
Traders prefer to sell futures contracts when they've already made money on the investment, but still have plenty of time left before the expiration date. Thus, many consider it a good option to sell Micro Bitcoin Futures (Dec 2026) before Dec 24, 2026.
Open interest is the number of contracts held by traders in active positions — they're not closed or expired. For Micro Bitcoin Futures (Dec 2026) this number is 3.00. You can use it to track a prevailing market trend and adjust your own strategy: declining open interest for Micro Bitcoin Futures (Dec 2026) shows that traders are closing their positions, which means a weakening trend.
Buying or selling futures contracts depends on many factors: season, underlying commodity, your own trading strategy. So mostly it's up to you, but if you look for some certain calculations to take into account, you can study technical analysis for Micro Bitcoin Futures (Dec 2026). Today its technical rating is strong sell, but remember that market conditions change all the time, so it's always crucial to do your own research. See more of Micro Bitcoin Futures (Dec 2026) technicals for a more comprehensive analysis.