BTC CME GAP (4H)Bitcoin has a CME gap in the $89,805 – $89,425 range
These gaps are usually filled before the price makes its next move.
Let’s see what happens.
For risk management, please don't forget stop loss and capital management
Comment if you have any questions
Thank You
Micro Bitcoin Futures (Dec 2026)
No trades
Related futures

max pain in sight for the bullsgm,
i've been entertaining a few ideas on btc, and this one comes to mind today.
the possibility of 1 more leg down, to take the rest of the longs that fomoed into the rally this week, and the few who managed to survive the drop from ath by averaging down mindlessly.
---
the way we bounced is ve

BTC CME: Key Level Retest and Liquidity SweepBTC CME demonstrated strong growth today on increased volume, reaching last week’s highs and sweeping liquidity.
Currently, the asset is trading directly inside last week’s high zone. I’m waiting for today’s daily close to define the next direction.
Bullish scenario: Daily close above the level wi
BTC Update (3 hr)MFI oversold on 3 hr, RSI probably hits it too. Then we get another bounce, but daily MFI is getting close to overbought, so I didn't play it.
So far it looks like it;s just drifting sideways.

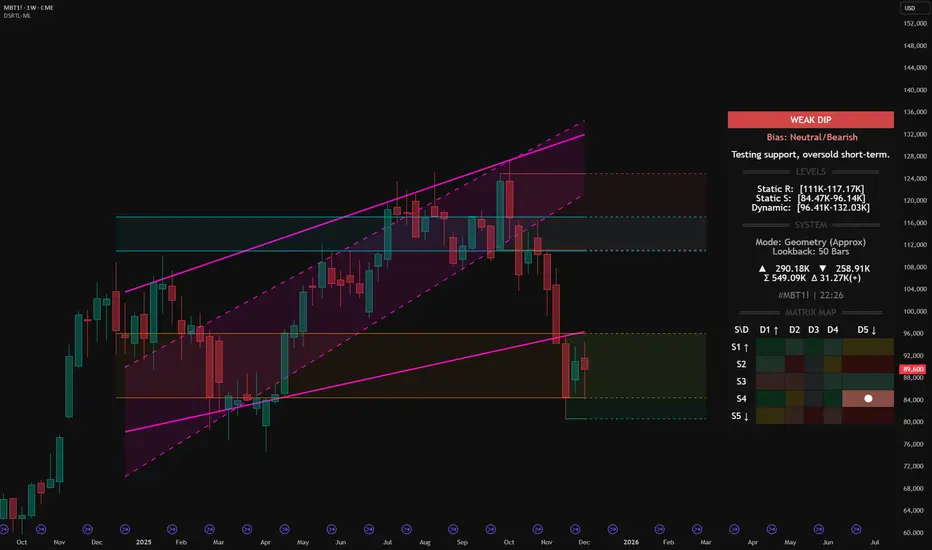
Micro Bitcoin Futures (MBT1!) – DSRTL‑ML Weak Dip at supportMicro Bitcoin Futures (MBT1!) – DSRTL‑ML Weak Dip at S4–D5 Support
We are analyzing the weekly structure of Micro Bitcoin Futures (MBT1!) using the institutional DSRTL‑ML support/resistance engine. On this bar the indicator classifies the state as WEAK DIP with a Neutral/Bearish bias and the syste
BTC UpdateLooks like MFI is headed back up on the 3hr chart so it probably gets a Friday pump. Silver (SI) and NASDAQ:NDX (NQ) futures went oversold Thu afternoon, there were better option plays than BTC.
(I posted the plots)
IBIT (BTC ETF) is on my tracking list, but I'll only trade it when it makes sens

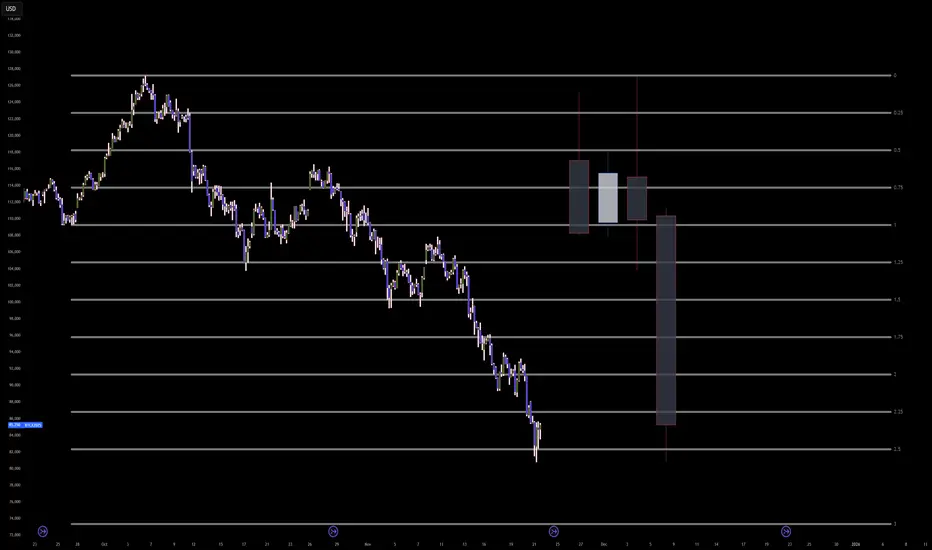
BTC CME Futures: The Capitulation Buy SetupSimply:
The logic here is simple.
Bitcoin has dropped too far and too fast.
We are currently hitting a major mathematical exhaustion point (the 2.5 Standard Deviation line).
At the same time, we are entering that big blue support box between 78k and 82k where the massive rally started earlier th
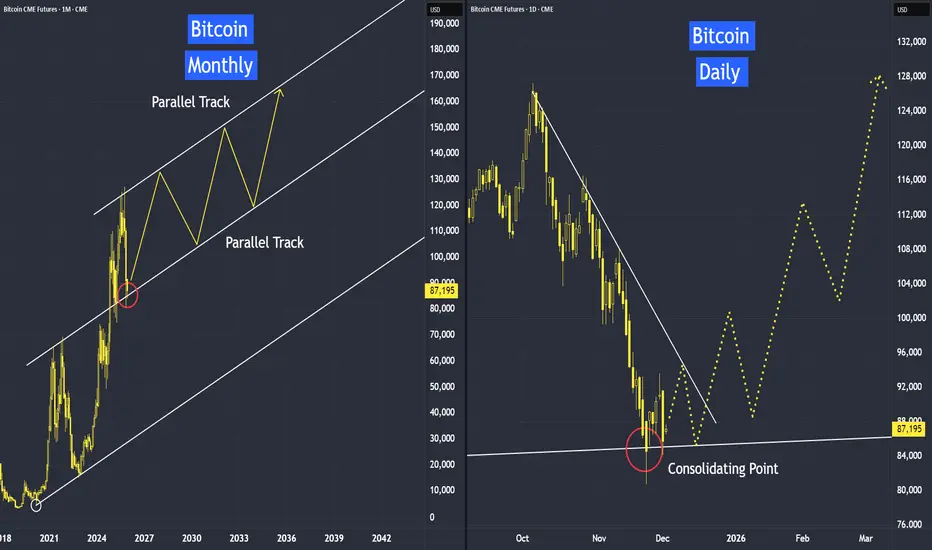
Different Timeframe Analysis - Bitcoin Back in July, I did a tutorial identifying the 120,000 level as a potential peak for Bitcoin, with the possibility of an open correction. Bitcoin subsequently formed a double top before pulling back to its recent low.
In my view, Bitcoin should continue to trend along this parallel channel.
Monthl
BITCOIN AL ALZA
The chart shows a trough area, where the price dropped very quickly. Theory indicates that it will rise again rapidly in the next few hours.

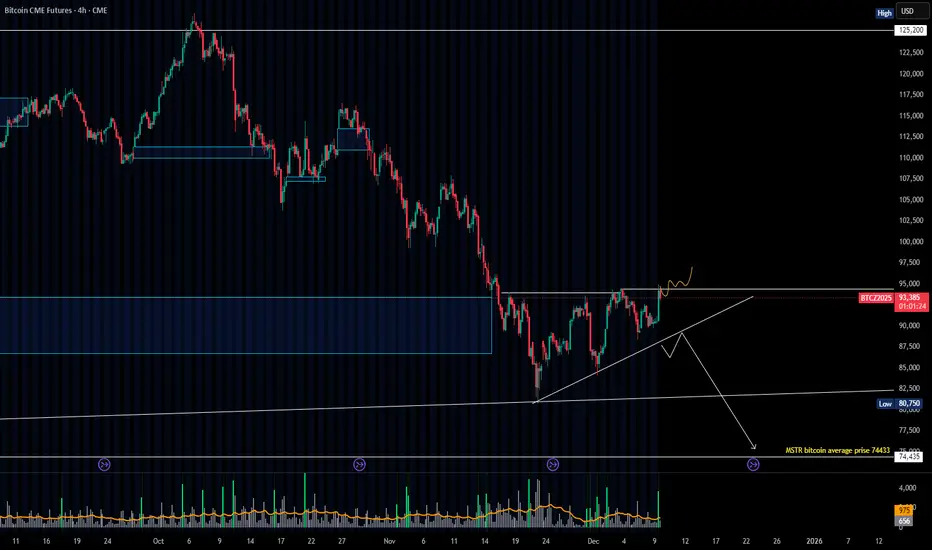
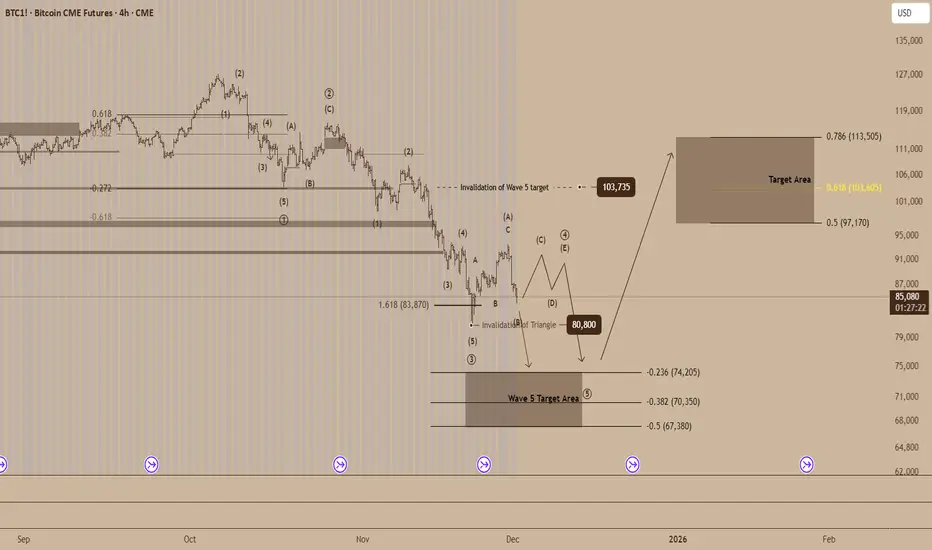
Bitcoin Futures Approach Crucial Triangle Structure Bitcoin CME futures are forming a technical pattern that points to a period of consolidation before a potential upward surge, provided that key support levels remain intact.
Recent price action indicates the development of a Wave 4 triangle, a structure that often appears when markets pause before
See all ideas
Summarizing what the indicators are suggesting.
Neutral
SellBuy
Strong sellStrong buy
Strong sellSellNeutralBuyStrong buy
Neutral
SellBuy
Strong sellStrong buy
Strong sellSellNeutralBuyStrong buy
Neutral
SellBuy
Strong sellStrong buy
Strong sellSellNeutralBuyStrong buy
A representation of what an asset is worth today and what the market thinks it will be worth in the future.
Displays a symbol's price movements over previous years to identify recurring trends.
Frequently Asked Questions
The current price of Micro Bitcoin Futures (Dec 2026) is 97,975 USD — it has fallen −0.74% in the past 24 hours. Watch Micro Bitcoin Futures (Dec 2026) price in more detail on the chart.
Track more important stats on the Micro Bitcoin Futures (Dec 2026) chart.
The nearest expiration date for Micro Bitcoin Futures (Dec 2026) is Dec 24, 2026.
Traders prefer to sell futures contracts when they've already made money on the investment, but still have plenty of time left before the expiration date. Thus, many consider it a good option to sell Micro Bitcoin Futures (Dec 2026) before Dec 24, 2026.
Open interest is the number of contracts held by traders in active positions — they're not closed or expired. For Micro Bitcoin Futures (Dec 2026) this number is 4.00. You can use it to track a prevailing market trend and adjust your own strategy: declining open interest for Micro Bitcoin Futures (Dec 2026) shows that traders are closing their positions, which means a weakening trend.
Buying or selling futures contracts depends on many factors: season, underlying commodity, your own trading strategy. So mostly it's up to you, but if you look for some certain calculations to take into account, you can study technical analysis for Micro Bitcoin Futures (Dec 2026). Today its technical rating is sell, but remember that market conditions change all the time, so it's always crucial to do your own research. See more of Micro Bitcoin Futures (Dec 2026) technicals for a more comprehensive analysis.