NQ - 9/4 1HRMonthly timeframe Pink
Weekly = Grey
Daily = Red
4hr = Orange
1hr = Yellow
15min = Blue
5min = Green
4 candles, 6 Levels, & MarketMeta
Range = 2 or consecutive candles of the same color.
Distribution Range - When price is above a distribution range it will act as support. When price is below, the SwingLow will be the boundary/entrance/exit of the range.
Distribution ranges consist of the 1st candle called the BackSide and last candle called the Frontside. Each has expectations.
BackSide candle (BS): expectation=strong reaction to price, support price. Hold price above it. Mark this level with a horizontal ray tool on the topside wick or topside body.
FrontSide candle (FS)
expectation = support price until trend reversal. Protects the SwingLow, exit of range.
To mark this level, place the horizontal ray tool on the topside wick or topside body.
SwingLow = the bottom side wick of the FrontSide Candle. Boundary of the range.
The Accumulation Range - When price is BELOW an accumulation range then these levels will act as resistance to price.
Inverse Backside (Inv.BS)= the first candle in the accumulation range. Its marked on the bottom side wick or body of the candle.
Its usually next to a Frontside candle. Traders like to see Inverse BackSide candles engulf Frontside candles and create an impulsive Fair Value Gap.
These f.V.G's next to FrontSide levels have higher probability than those that don't have the engulfing, F.V.G..
the last candle in the accumulation range is the Inverse FrontSide (Inv.FS)
marking the topside wick with the horizontal ray tool is to mark the SwingHigh Level. Mark the bottom side wick or body to display the Inv.FS level.
NQX1! trade ideas

E mini Nasdaq 100. Weekly Outlook. September 01, 2025CME_MINI:NQ1!
Expecting all out meltdown on Nasdaq. And the other two indexes. August was insane. But September will be extremely volatile

NQ1! 4H Technical SnapshotNQ1! 4H Technical Snapshot
NQ1! is currently consolidating within a symmetrical triangle formation on the 4-hour timeframe.
The price is testing the Fib Golden Level (50-61.8% retracement) along with the ascending trendline, which serves as immediate confluent support.
The descending trendline above has acted as resistance, limiting upside momentum and defining the upper boundary of this consolidation.
Should current support break, further downside targets include the 'Good Support' zone around 23,000-23,100, followed by the 'Key Support' area near 22,800-22,900.
Disclaimer:
The information provided in this chart is for educational and informational purposes only and should not be considered as investment advice. Trading and investing involve substantial risk and are not suitable for every investor. You should carefully consider your financial situation and consult with a financial advisor before making any investment decisions. The creator of this chart does not guarantee any specific outcome or profit and is not responsible for any losses incurred as a result of using this information. Past performance is not indicative of future results. Use this information at your own risk. This chart has been created for my own improvement in Trading and Investment Analysis. Please do your own analysis before any investments.

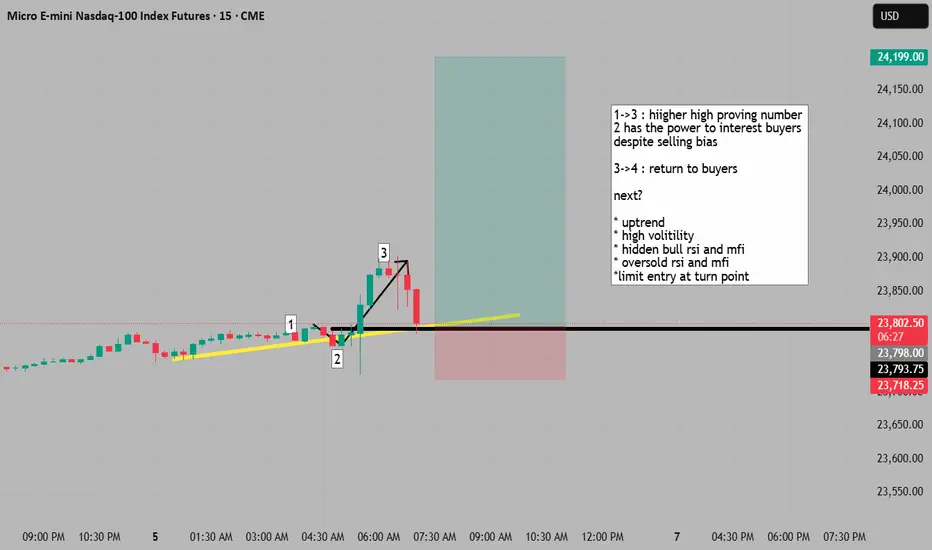
entry at markets edge for uptrend continuation idea 1->3 : hiigher high proving number
2 has the power to interest buyers
despite selling bias
3->4 : return to buyers
next?
* uptrend
* high volitility
* hidden bull rsi and mfi
* oversold rsi and mfi
*limit entry at turn point
NQ 01.09.25Looking for a bullish day today, targeting previous weekly opening price. I'm currently looking at Previous H6 Open (00:00) to look for longs to Asia Highs

NQ! - September 3rd, 2025 - PMThe market has been beating me up these last few sessions...
I trade NQ futures. Here are my 2 last days of trading.
Good trading to all

E mini Nasdaq 100. Daily Outlook and walkthroughCME_MINI:NQU2025
Explained the reasoning and the orderflow on NQ. Clean onesided delivery during New York Open

NQ FUTURES IDEA We are looking to test the top of 23,782 NQ but if we fall below 23,608 NQ we going short. I think we have a higher chance of going down below 23,782 NQ tomorrow. Because Wall Street is on edge heading into Friday’s nonfarm payrolls. Economists forecasting the U.S. economy added 75,000 jobs last month, a weak estimate that’s only slightly higher than the dismal 73,000 headline number in the July report. The unemployment rate is also projected to tick higher, to 4.3% from 4.2%. I know Las Vegas unemployment is one of the highest in the nation so things are not well so NQ will continue to have more volatility.

Stock Index Matrix; NQ, ES, YM Monthly UpdateThe August Non-Farm Payrolls report, due on Friday, is the centrepiece of the week and will follow a monthly private payrolls reading and job openings figures.
I am looking at the undervalued areas in price action when buying the stock indexes.
Monthly Nasdaq inefficiency: $22,582.00 - $22,083.00
Monthly S&P 500 Inefficiency:
$6,227.25 - $6,063.00
Monthly Dow Jones Inefficiency:
$43,911 - $42,999

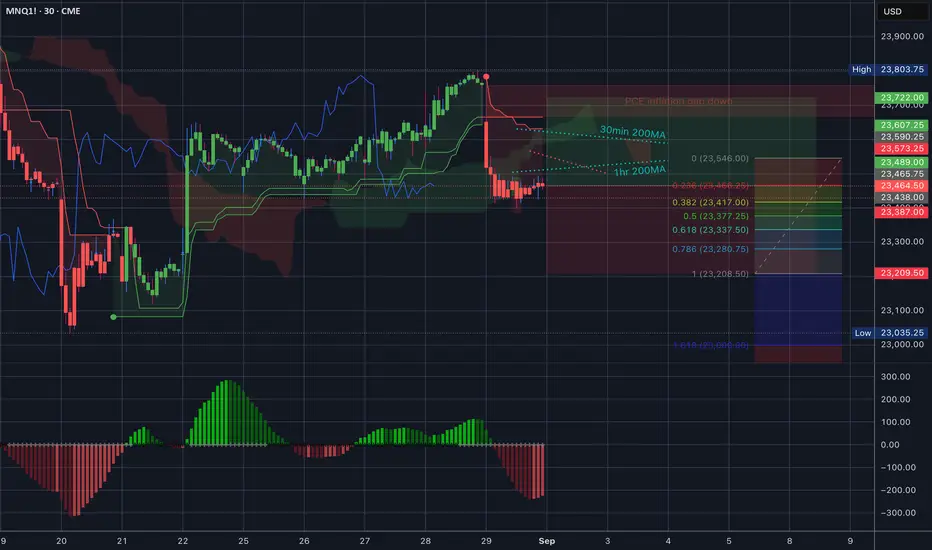
$NQ_F $MNQ_F Trading Range for 9.2.25
Ok, so we are heading into tomorrow after the three day weekend a little bearish. Friday every candle printed red and the 35EMA is above us facing down so definitely look to that as resistance.
Nasdaq is more bearish than S&P, that 30min 200MA has already turned down so DEFINITELY note that level.
Volatility map on the right for tomorrow’s range. Let’s go, y’all. I have officially been converted into a futures trader so new regular ticker right here.
August 2025 pnl
This month I ran 3 algos on the micro futures (MES & MNQ).
Z-Score Strategies (MES + MNQ)
• 25 trades in total
• 60% win rate
• Net P/L: $294 after fees
→ These trades showed steady performance, leaning on consistency with solid risk/reward.
MNQ DVD Strategy
• 8 trades total
• 50% win rate
• Net P/L: $237 after fees
→ Fewer trades, but higher expectancy ($31 per trade) — when this one hits, it pays well.
📈 Takeaway:
The Z-Score setups gave more consistency, while the DVD algo added bigger pops per trade. Running them together balances steady gains with higher payoff opportunities.

NQ structure break down / bullish structure 4h time frame break down on NQ, respecting higher lows on the 4h signaling potential move towards all time high.
on the opposite bearish scenario, a 4h full body candle closing bellow 23,400 can signal a new lower low signaling a downtrend .
thank you for watching , let me know your thoughts

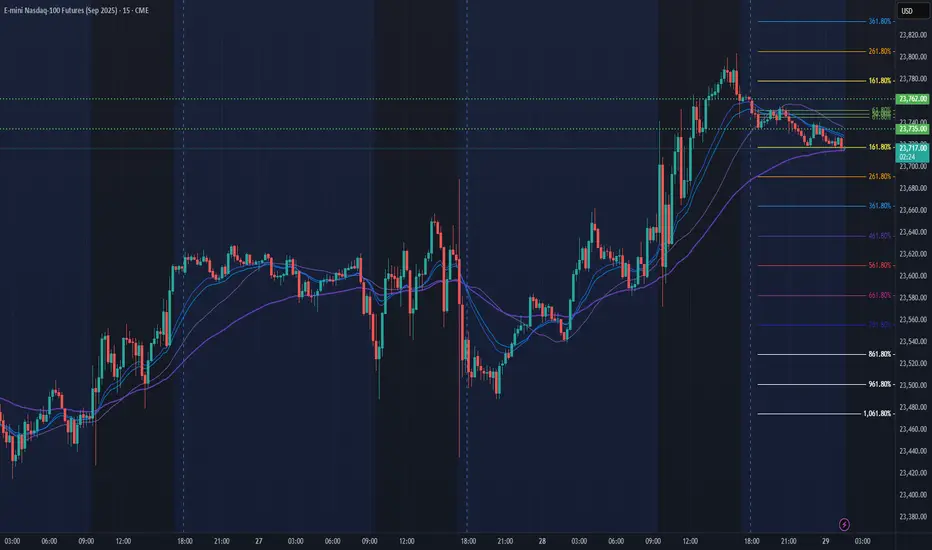
NQ Power Range Report with FIB Ext - 8/29/2025 Session (Correct)CME_MINI:NQU2025
- PR High: 23762.00
- PR Low: 23735.00
- NZ Spread: 60.5
Key scheduled economic events:
08:30 | Core PCE Price Index (YoY|MoM)
09:45 | Chicago PMI
Month end ahead of early close Monday
Session Open Stats (As of 12:45 AM 8/29)
- Session Open ATR: 283.13
- Volume: 16K
- Open Int: 286K
- Trend Grade: Long
- From BA ATH: -1.4% (Rounded)
Key Levels (Rounded - Think of these as ranges)
- Long: 24382
- Mid: 23239
- Short: 22096
Keep in mind this is not speculation or a prediction. Only a report of the Power Range with Fib extensions for target hunting. Do your DD! You determine your risk tolerance. You are fully capable of making your own decisions.
BA: Back Adjusted
BuZ/BeZ: Bull Zone / Bear Zone
NZ: Neutral Zone
MNQ Futures 29 AUGBullish to start off NY session. Possible drop in the hours leading to market close.

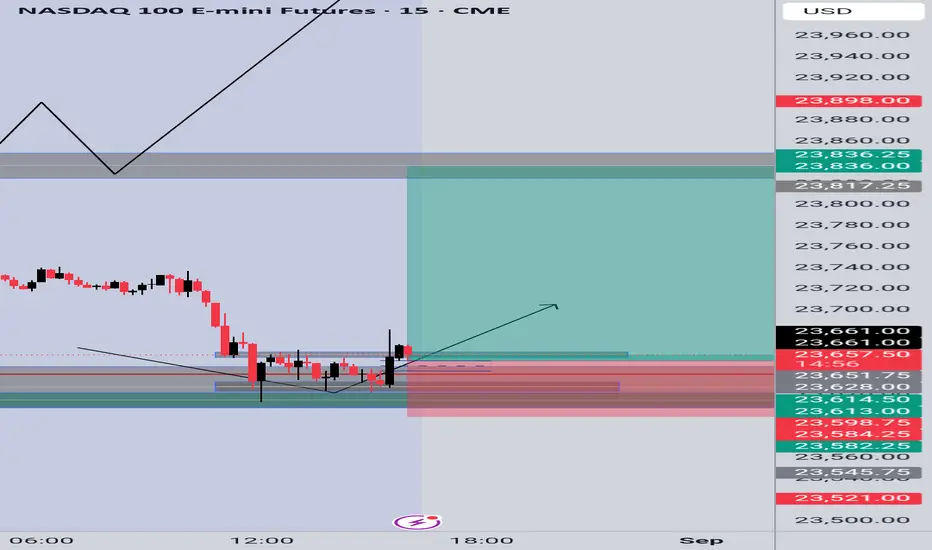
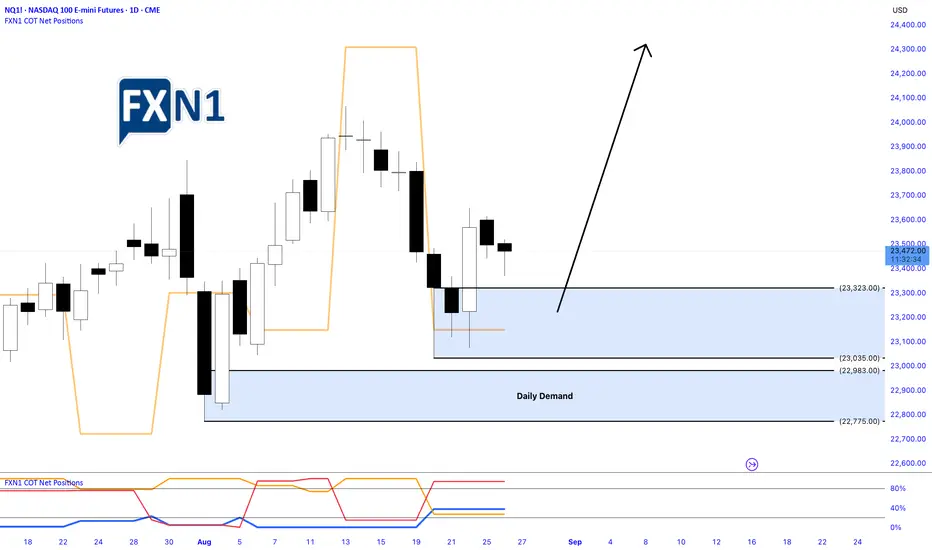
Nasdaq Pulls Back After Friday’s Rally: Identifying Demand ZoneYesterday, the Nasdaq underwent a pullback following a robust bullish surge on Friday. During this correction, a fresh Daily Demand Zone emerged on the chart, signaling potential support levels. Traders are now eyeing this area as an opportunity to position for a possible new high, should the market retrace further today. The current outlook favors a long setup, with anticipation of a continued upward move contingent on the price respecting the identified demand zone.
✅ Please share your thoughts about NQ1! in the comments section below and HIT LIKE if you appreciate my analysis. Don't forget to FOLLOW ME; you will help us a lot with this small contribution.
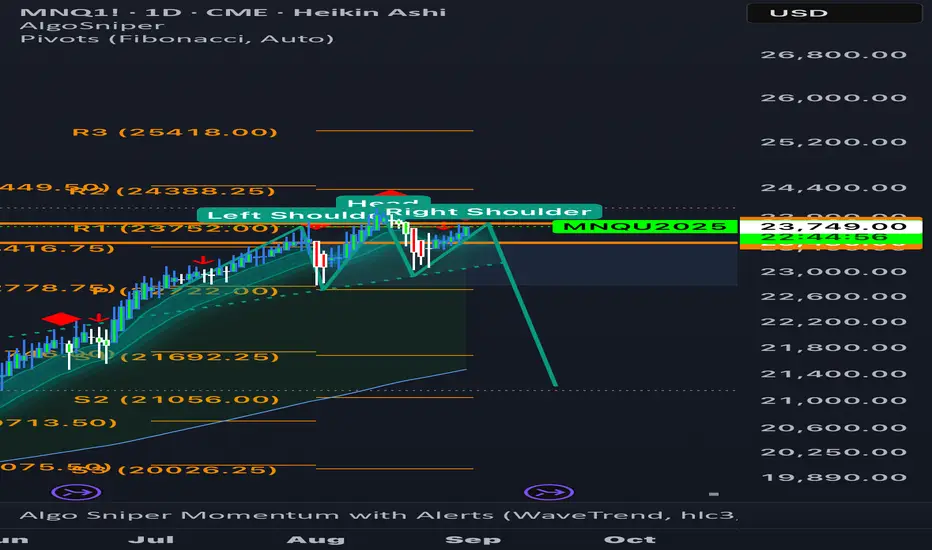
Possible head and shoulders pattern. Based on market structure we will see how our head and shoulders plays out.
NQ: 242nd trading session - recapDefinitely an experimental session with a lot of new things to learn. Todays circumstances were for real insane

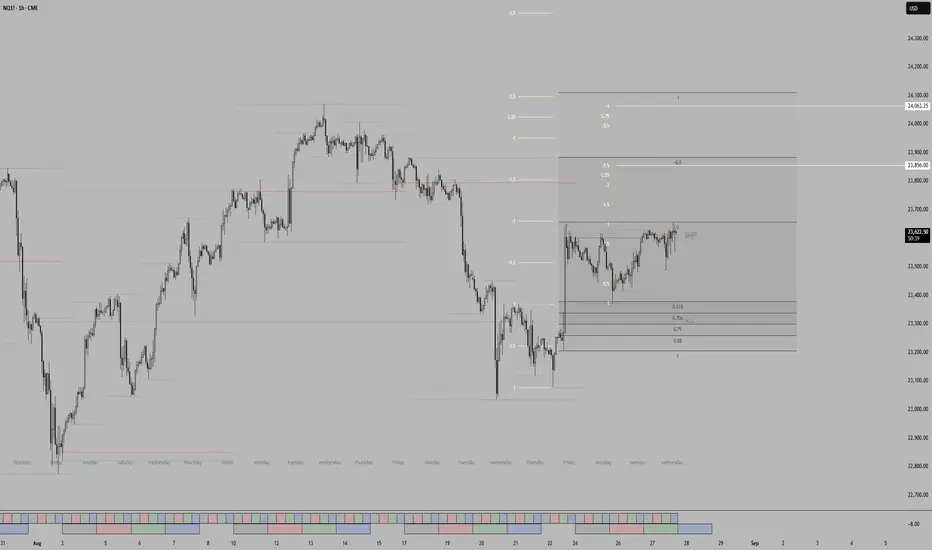
New ATHs incoming? NFP numbers the catalyst?NQ1 is showing short-term bullish momentum, rebounding from 23,000 to 23,600. Key resistance sits at 23,856 and again at 24,000–24,100. A clean breakout above 24,100 could open the door toward 24,300+, but reaching 24,500 by Sept. 5 would likely require a strong catalyst. Probability of hitting 24,500 in the next week remains low (about 15–20%) despite the current upward bias.
IFVG NQ LONG bullish bias here going into Asia / Tokyo session, Looking At the 15m and 5m FVG to get into a long position, slight EMA Bias NQ & ES keep ranging above the 15m 200ema, Predicting it respects the $23,843.00 price range and uses that as the draw to buy side liquidity (BSL)

MNQ Prop Account Risk Management – From $50K to $300K
1) Core funding rules (simple & strict)
Account inputs
Acct = account size
TTD = trailing drawdown buffer your prop gives (e.g., Apex $50K → $2,500)
tickValue and tickSize depend on the product (for MNQ: tickSize = 0.25, tickValue = $0.50, $2.00 per index point)
Budgeting
Daily loss cap (never exceed):
DailyCap = 0.10 × TTD (≈ 10% of TTD)
→ $50K example: 0.10 × 2,500 = $250/day
Per-trade risk (normal):
RiskTrade = 0.50 × DailyCap (≈ 50% of daily)
→ $50K example: 0.50 × 250 = $125/trade
Max trades per day (if all losers):
DailyCap / RiskTrade → typically 2 losses max. Stop trading.
Tip: if you’re warming up or drawdown is tight, use RiskTrade = 0.33 × DailyCap (3 bullets per day).
Position sizing
Choose a stop distance in points from your 15s setup (tight range, reduces variance).
For MNQ:
RiskPerContract = StopPoints × $2.00
Contracts = floor( RiskTrade / RiskPerContract )
Trailing drawdown protection
Hard daily stop: auto-flatten when Unrealized+Realized <= -DailyCap.
Two-strike rule: 2 consecutive full-risk losses → walk away.
No add-to-loser; scale-in only if the first risk is reduced (BE+ or partials).
2) Timeframe workflow (why 15s works)
Context / bias: 10–15-minute chart → trend, key levels, session regime.
Execution: 15-second chart → micro pullback, CHoCH/confirm, ALGTP setup zones.
Psychology: the 10–15m avoids overreacting; 15s keeps risk tight.
Risk discipline: 15s makes it easy to place objective small stops (e.g., 10–20 points MNQ), aligning with prop TTD constraints and avoiding rule violations.
3) Concrete numbers (MNQ examples)
Assume MNQ (Micro NQ):
$2.00 per point per contract (0.25 tick = $0.50)
Three example stops from 15s structure: 10 / 15 / 20 points
Risk per contract
10 pts → $20
15 pts → $30
20 pts → $40
Position sizing formula
Contracts = floor( RiskTrade / (StopPoints × 2) )
4) Scaling plan by account size
I’ll assume TTD ≈ 5% of account (matches Apex 50K→2.5K). If your prop’s TTD differs, just plug your TTD into the same formulas.
Account TTD (≈5%) DailyCap = 10% TTD RiskTrade = 50% of Daily MNQ contracts (10 / 15 / 20-pt stop)
$50K $2,500 $250 $125 6 / 4 / 3 (=$120/$120/$120 used)
$100K $5,000 $500 $250 12 / 8 / 6
$150K $7,500 $750 $375 18 / 12 / 9
$250K $12,500 $1,250 $625 31 / 20 / 15
$300K $15,000 $1,500 $750 37 / 25 / 18
How to read: For the $50K plan with a 20-point stop, Contracts = floor(125 / 40) = 3.
With 15-point stop: floor(125 / 30) = 4. With 10-point: floor(125 / 20) = 6.
Important fine-tuning
If your fills slip or you trail early, reduce Contracts by 1 to keep real risk ≤ plan.
In fast conditions, switch to 10-second (ALGTP’s funding preset) or even 5-second for entries. It shrinks stop distance yet still respects the 10–15m bias.
5) Trade plan checklist (ALGTP flow)
When to trade
Timeframe panel (your “snow” focus): higher-timeframe bias aligned (10–15m green for longs / red for shorts).
Price is above Setup Trigger and confirms at CHoCH/Confirmation Trigger (for longs), or symmetric for shorts.
Momentum not exhausted (avoid entries directly into TP3/TP4 clouds).
When not to trade
Opposite bias on 10–15m.
Entering right into Capital Defense / Max Exhaustion zones.
After 2 full-risk losses or when DailyCap is reached.
Entry & management
Entry at Setup Trigger or micro retest on 15s.
Initial stop just beyond Capital Defense (or last micro-swing).
Partial TP ladder: TP1 (momentum hold), TP2 (intensity), trail to BE+, then leave a runner toward TP3/TP4.
Trailing: switch to smart trailing only after TP1; before that, protect initial risk.
6) Simple formulas you can keep on your desk
DailyCap = 0.10 × TTD
RiskTrade = 0.50 × DailyCap
Risk/contract = StopPoints × $2.00 // MNQ
Contracts = floor( RiskTrade / Risk/contract )
Example (50K, TTD 2,500):
DailyCap = 250
RiskTrade = 125
Stop 15pt → Risk/contract = 15 × 2 = $30
Contracts = floor(125 / 30) = 4
If you also trade MES (Micro S&P): tick $1.25 (0.25 pt), so $5 per point. Replace $2.00 with $5.00 in the formula.
7) Why this is prop-friendly
Keeps risk anchored to TTD, not to account notional.
Forces few, high-quality attempts (2–3 bullets max/day).
15s (or ALGTP’s 10s funding preset) compresses stop distance, making the same TTD support more contracts without violating rules.
The 10–15m bias prevents revenge trading and wrong-direction scalps.

A good set up for Nasdaq100Nasdaq graphic shows a clear set up for either long or short. Its already in the resistance are that might be a new support or not, Just wait a confirmation candle. Watchout your risk by putting stop loss tightly. Be prepared for profit !! Good luck

NASDAQ100 - Update As anticipated, price returned to key support. I've, added more on a retest of the demand zone. Patience pays.