28 August 2025There were few very clean setups. However, 9:30 open was very volatile.
Setup: Inversions FVG
New: unemployment
NQX1! trade ideas

IVFG NQ LONGbullish bias here going into Asia / Tokyo session, Looking At the 15m and 5m FVG to get into a long position, slight EMA Bias NQ & ES keep ranging above the 15m 200ema, Predicting it respects the $23,843.00 price range and uses that as the draw to buy side liquidity (BSL)

NQ: 242nd trading session - recapDefinitely an experimental session with a lot of new things to learn. Todays circumstances were for real insane

Nq & Es After hours comment 25-08-2025Good evening everyone,
As you noticed, price did not reach the lower levels we were anticipating, and therefore no valid long opportunities were triggered. This was always a possible outcome, and it simply means that we missed a trade — something that is part of everyday trading.
I had mentioned that I was expecting a temporary move down, but at no point did I suggest looking for short opportunities. The reason is exactly what we saw today: price did not need to drop significantly before moving higher.
For tomorrow, there is still a chance of a temporary decline before the market continues to push upward.
See you here again tomorrow, before the market open.
⚠️ Disclaimer: This analysis reflects personal market observations and is for educational purposes only. It does not constitute financial advice.

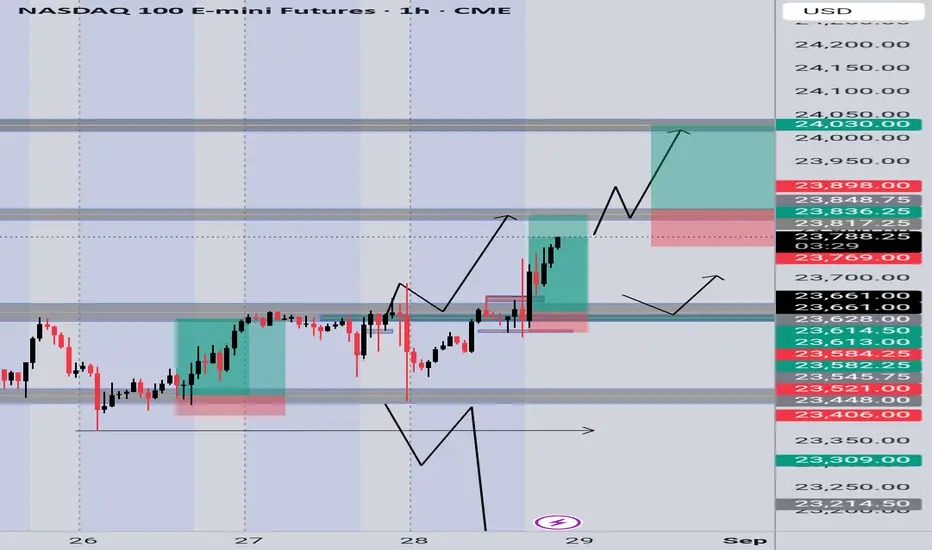
NASDAQ100 Update✅ Congratulations to everyone who caught the resistance breakout 🎉 – that level has now flipped into support 🔄.
📌 My plan:
Looking to buy more on continuation if we break higher 🔼
Or wait for a retest back to support to load more longs 💹
Bias remains bullish as long as support holds
NQ: 241st trading session - recapShould've definitely waited for the better setup. I ended up with +$0 because I scaled down after my inital loss.
Overall the trade was in the A tier, nothing perfect but it was alright

Nq & Es After hours comment 27-08-2028 Good evening everyone,
As you can clearly see, the target has been achieved exactly as anticipated. Price dipped slightly, then provided solid long opportunities, and afterward rallied strongly to the upside.
See you all tomorrow here, shortly before the market open, for the daily outlook.
Wishing you a good evening.
⚠️ Disclaimer: This analysis reflects personal market observations and is for educational purposes only. It does not constitute financial advice.

NQ Short (08-18-25)Friday did not lift and the O/N is at low, look for anu reg session selling to gain some strength under the DZ. Looking for 400 point range this week and break lower can move 1,000 points under the DZ. Expect Tricks/Tweets (damage spin) and more Tweets early this week. Low volume buying should turn into high volume selling. Washington Street Asset Management will have its work cut out over the next month or so and may be why we got propped up.

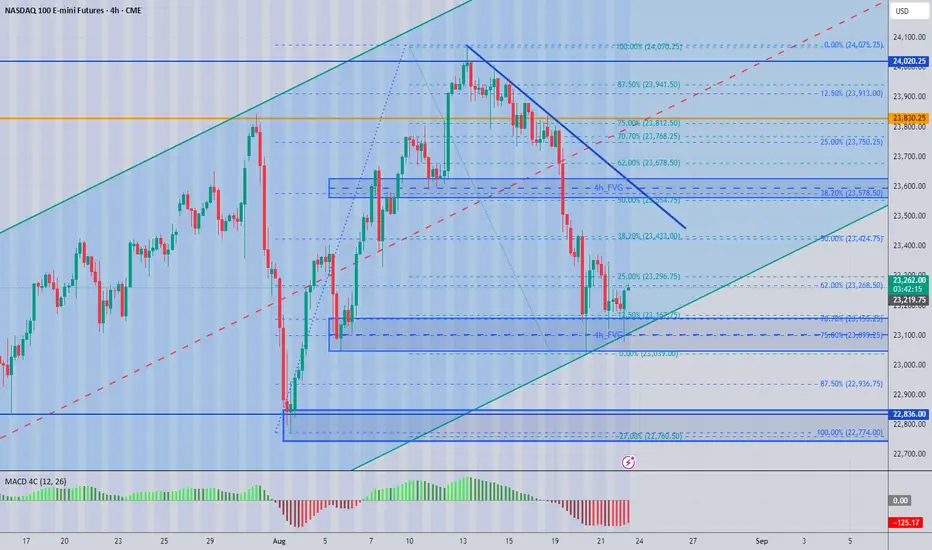
NASDAQ BULLISH4hr bull flag/golden pocket let’s see when it breaks out but def lookin for upside only

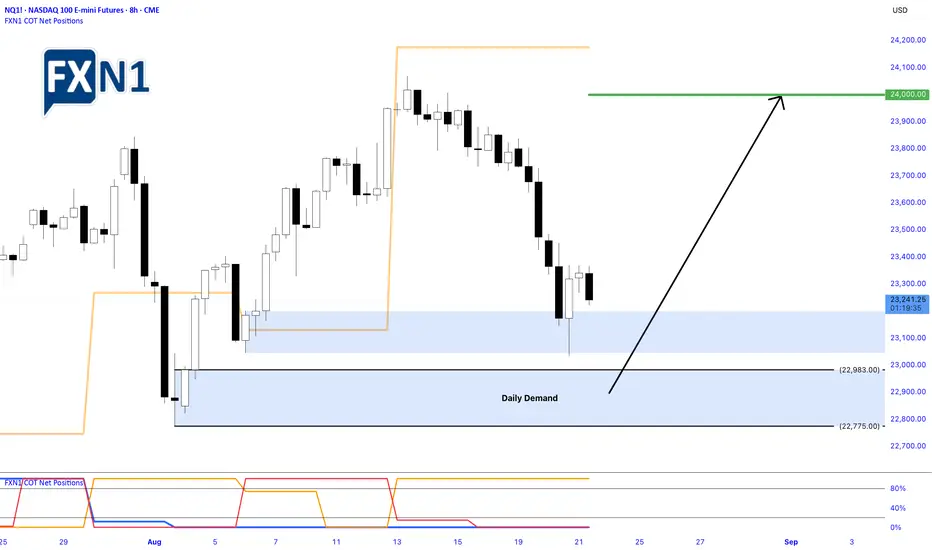
Nasdaq Bounces Off Demand Zone: Opportunities for a Bullish Rev.Yesterday, the Nasdaq experienced a notable rebound from the daily demand zone around 23,201, signaling buying interest at that level. However, as the EU trading session commenced, the index quickly shifted to a bearish impulse, reflecting ongoing market uncertainties and cautious sentiment among traders.
Key Levels and Opportunities
Despite the short-term pullback, the chart presents a compelling opportunity for traders to consider a "buy low" approach near the next demand zone at approximately 22,983. If the market finds support there, it could set the stage for a recovery, with the potential for the Nasdaq to rally back toward the 24,000 mark or even higher.
Market Outlook and Analyst Projections
Analysts remain optimistic about the index’s prospects, with many projecting a strong finish to the year. The Nasdaq, known for its volatility and lucrative trading opportunities, continues to attract traders seeking to capitalize on its upward momentum. As always, projections are optimistic, but the current technical setup suggests that there could be a favorable risk/reward ratio for those willing to position for a rally.
Final Thoughts
In a market characterized by rapid shifts and unpredictable moves, identifying key demand zones and monitoring reaction levels is crucial. The upcoming sessions could provide a prime entry point for those looking to buy dips, with the potential for the Nasdaq to forge ahead into the year’s final stretch with gains.
✅ Please share your thoughts about NQ1! in the comments section below and HIT LIKE if you appreciate my analysis. Don't forget to FOLLOW ME; you will help us a lot with this small contribution.
NQ may pullback before creating new highsThe bulls want to push the market higher while the bear wants a 2nd leg down on the daily. PA loses 20EMA then reverses up and we are approaching September where catalyst will help push the market to create new highs. We may retrace from here then move up. My bias is super bullish however not eliminating the potential of a small retracement. i.e. 50% retracement then pushes up. Just my thought process. Cheers
NQ short After yesterdays big move lower into the US open driven by under performing mega cap stock and possible profit taking ahead of Jackson Hole later this week, we've broken through the previous uptrends confirmed higher low and have left behind some nice levels to retrace back into.
Well confirmed hourly trendline
Low volume area and previous support turned resistance
Fibonacci retracement 50-61.8%
Lower timeframe entry/trigger (TBC)
This trade would need to be taken with caution and fairly strict in-trade management as price has entered a slightly higher TF fib retracement against the trade direction
Would only be looking to enter the trade if a clear entry point is provided and broken. This could be the break of a counter trendline or preferably the breakout of a 5min higher low and a retest of a short term fib retracement

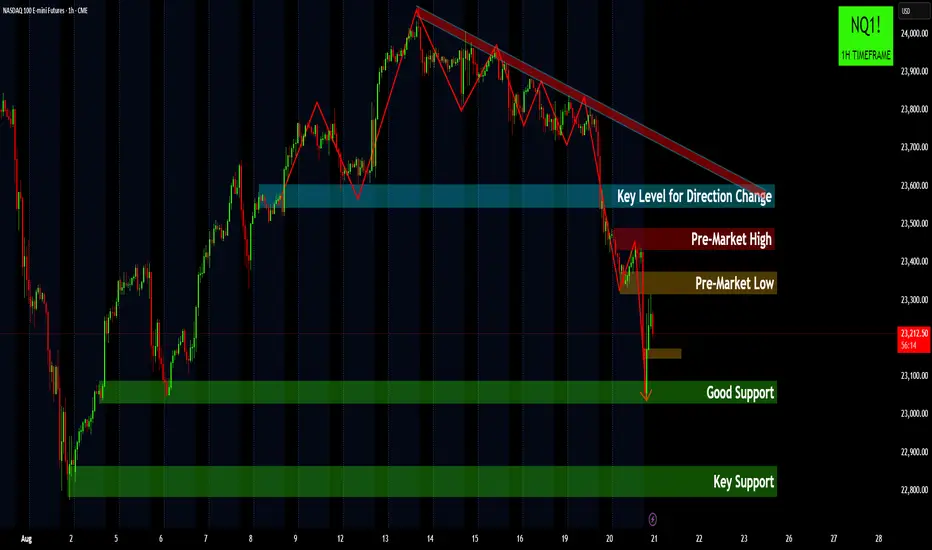
NASDAQ 100 Futures: Bearish Momentum Accelerates Below Key LevelThe NASDAQ 100 Futures are in a confirmed downtrend , having decisively broken below the critical 23,600 "Key Level for Direction Change." Price is currently targeting the "Good Support" zone around 23,100, following a rejection from recent "Pre-Market Highs" and "Lows."
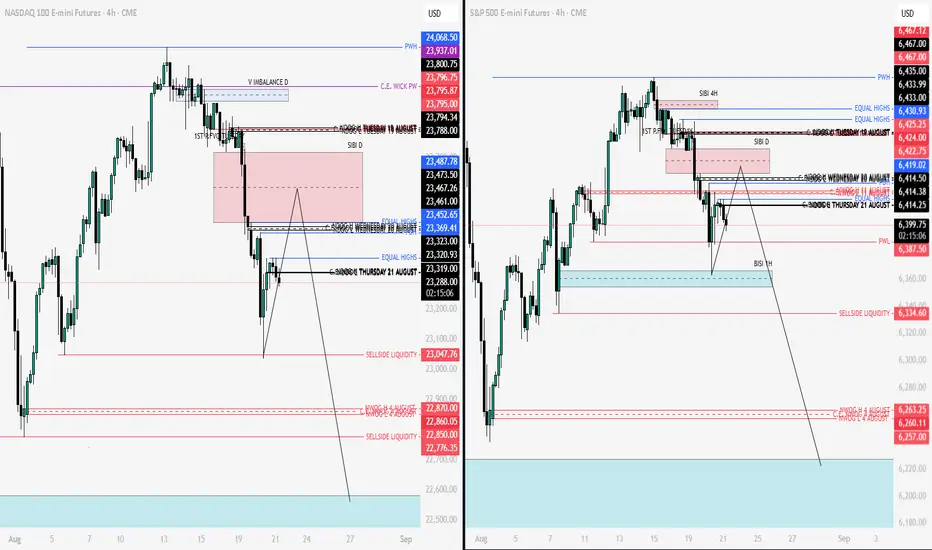
Nq & Es Key levels & Scenarios 21-08-2025Good morning everyone,
My overall bias remains bearish, but at the moment we are trading within a discount area. This means that with the market open at 09:30 NY time, we may see potential high-probability long setups, with the main target being the SIBI on the daily chart.
So while the broader bias is to the downside, it is important to also take advantage of short-term moves to the upside, as price may need to rise first before continuing lower.
Wishing you all a successful trading session.
⚠️ Disclaimer: This analysis reflects personal market observations and is for educational purposes only. It does not constitute financial advice.
NQ - August 22 2025 - Before the open
So yesterday was an inside day, which means we traded inside the previous days range (failed to break previous days high or low).
23,000 is a very strong support. If it breaks with conviction there is no real support until about 22,500.
FUNDAMENTALS : I think we will need a strong fundamental reason for 23,000 to break down. Something such as Powell saying they wont cut rates in September. The market is keeping an eye on inflation data and employment because these will determine if they cut or not.
Rate cut scenarios:
1. If inflation spikes due to tariffs as we saw in most recent PPI report, I think they may hold rates.
2. If employment drops a lot (bad NFP report, most importantly unemployment rate goes up) that may force them to cut in September.
3. If inflation drops near 2%, they will likely cut in September regardless of if employment data is good or bad.
***Keep in mind the market is sort of expecting inflation due to tariffs, so if inflation holds steady or is slightly better than expected that maybe enough for them to cut in September.
TECHNICALS : So far we have strong buying near 23,000 level but for the last 3 days buyers are lacking conviction at lower and lower prices. (Selling near 23,300).
Good trading :)

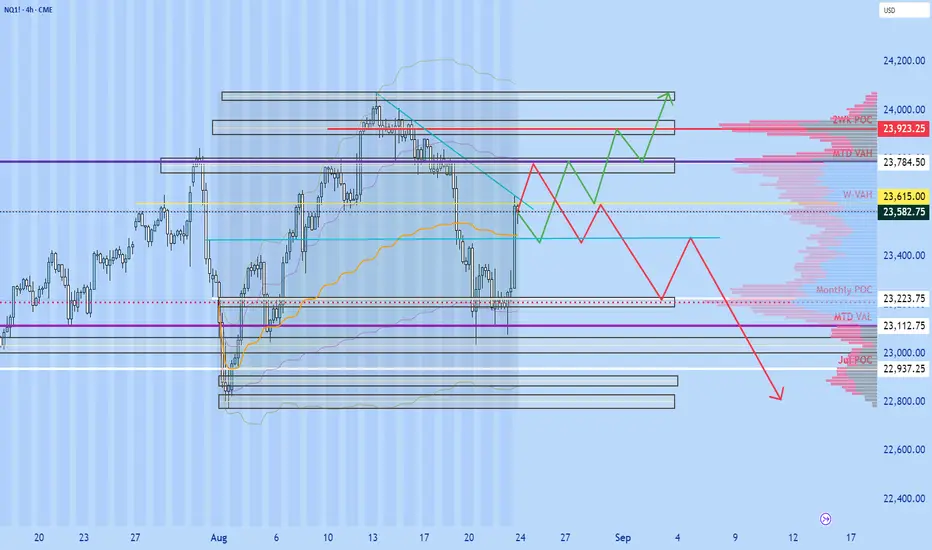
NQ Levels and set up for today With Jackson Hole upon us, we're going to get some explosive moves. I have mapped out my thoughts on the 4H chart. Good luck, be careful out there
NASDAQ (NQ1!): Started Retracing Last Week. Will It Continue?Welcome back to the Weekly Forex Forecast for the week of Aug 18 - 22nd.
In this video, we will analyze the following FX market: NASDAQ (NQ1!) NAS100
The NASDAQ reached ATHs Tuesday, and retraced for the rest of the week. Will there be some
follow through to open next week? Wait for the market to tip its hand and show you strength or weakness.
If the highlighted +OB fails, look for sells.
If the OB holds, buys until a bearish BOS takes place.
Enjoy!
May profits be upon you.
Leave any questions or comments in the comment section.
I appreciate any feedback from my viewers!
Like and/or subscribe if you want more accurate analysis.
Thank you so much!
Disclaimer:
I do not provide personal investment advice and I am not a qualified licensed investment advisor.
All information found here, including any ideas, opinions, views, predictions, forecasts, commentaries, suggestions, expressed or implied herein, are for informational, entertainment or educational purposes only and should not be construed as personal investment advice. While the information provided is believed to be accurate, it may include errors or inaccuracies.
I will not and cannot be held liable for any actions you take as a result of anything you read here.
Conduct your own due diligence, or consult a licensed financial advisor or broker before making any and all investment decisions. Any investments, trades, speculations, or decisions made on the basis of any information found on this channel, expressed or implied herein, are committed at your own risk, financial or otherwise.

$MNQ - 08/19/2025H4 Close Below > Bearish
M15 -FVG > Bearish
M5 IFVG > Bearish
M1 FVG Entry > Bearish
Time > H4 10 AM Open

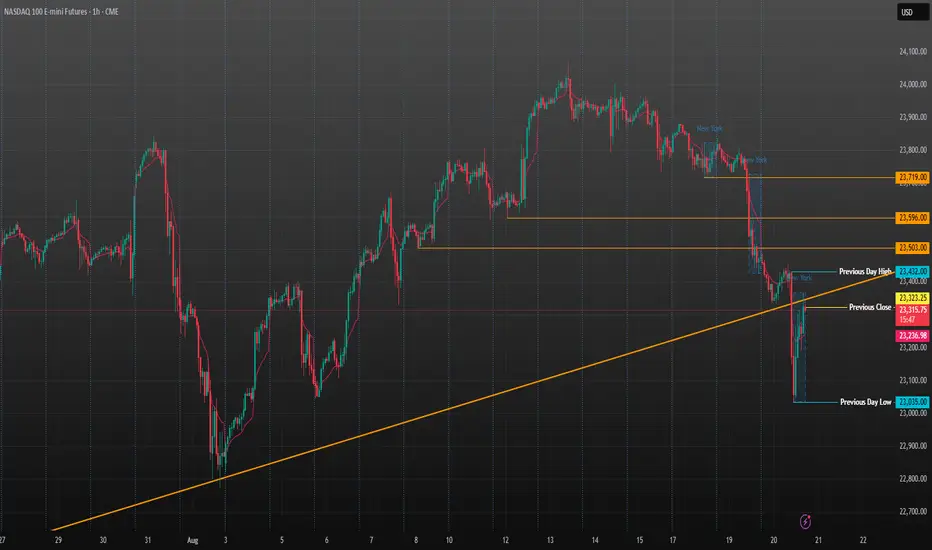
NQ - 2025 August 20 after the close
If we regain the downtrendline we go back to restest 23,500 and if we cant hold above the trendline we will try to retest todays lows.
Seeing how quickly the dip was bought back today I would lean towards a break back above the downtrend and retest of 23,500.
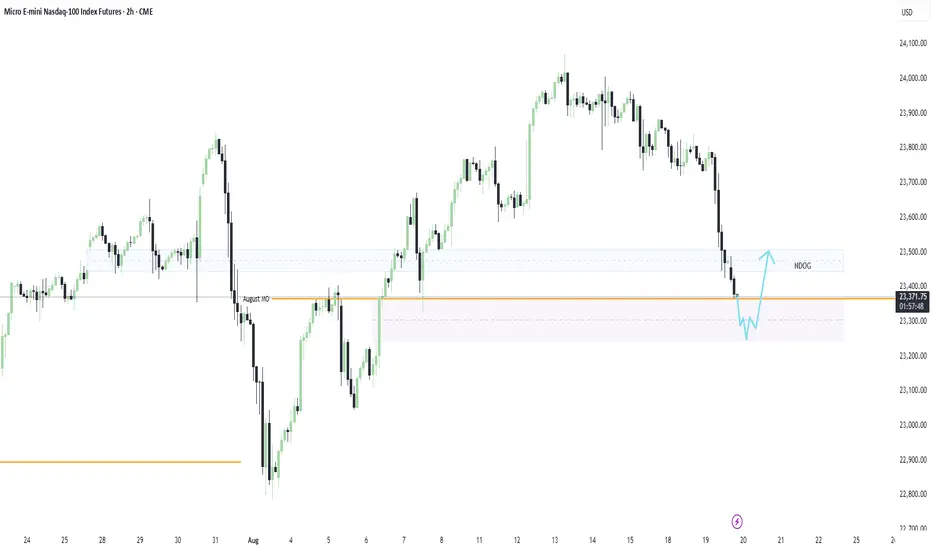
Gap Fill & Reversal Long IdeaI am anticipating a strong move through the August Monthly Open, with price sweeping the lows and targeting the 4H gap at 23,303.50. Once that level is tagged, I’ll be watching for signs of a reversal, ideally an inverse head and shoulders formation to shift bias back to the upside.
My target: a clean push toward the NDOG zone at 23,478.00
Nq ShortAfter taking a short position with the target I previously shared, I am now looking for a potential long opportunity — applying a scalping approach on Nasdaq.
⚠️ Disclaimer: This analysis reflects personal market observations and is for educational purposes only. It does not constitute financial advice.

Future Analysis Nas & Dow 08/18/25Hey there ✌
Until now, I was mainly known among German-speaking traders, as I have been conducting my swing trades in Nasdaq futures (performance +110%, win rate 60%, average RR 2.83 in 42 trades) for about 7 months and my swing trades in Dow Jones futures (performance +103%, win rate 53%, average RR 6.58 in 19 trades) here at TV in an open, transparent manner and in advance.
For my analyses, I use a unique approach in which I embed price action and volume into a market mechanical structure to determine where institutional trading is most likely to have its average positions. I trade four different zones:
PDZ (Priority-Demand): Long-Level
PSZ (Priority-Supply): Short-Level
PDBZ (Priority-Demand-Break): Short-Level
PSBZ (Priority-Supply-Break): Long-Level
My approach only works when I have a crystal-clear market structure. I don't trade in ranges because I lack a clear market structure or market trend. True to the motto “It's better not to trade than to trade badly,” I only made 42 trades on the Nasdaq in seven months and 19 trades on the Dow in four months.
I also use the zones presented here as key levels for my intraday trading.
I love talking about the markets and exchanging ideas with other traders of all levels, and I know that there are many different approaches to successful trading. That's why I want to bring a little more positivity to the toxic trading industry, where everyone always thinks that only their own way works. So feel free to comment and ask me questions 🙌🙌
------------------------------------------------------------------
Performance Nasdaq (NQ/MNQ)
Total number of trades: 42
Starting Balance: $15'000.00
Net Gain/Loss: $16'531.74 (110.21%)
Balance: $31.531.74
Win: 59.52%
Average winning trade: $870.76
Average losing trade: -$308.07
------------------------------------------------------------------
Performance Dow Jones (YM/MYM)
Total number of trades: 19
Starting Balance: $5'000.00
Net Gain/Loss: $5'180.42103.61%)
Balance: $10'180.42
Win: 52.63%
Average winning trade: $600..13
Average losing trade: -$91.21
-------------------------------------------------------------------
You can find detailed journals of all trades from the two portfolios shown here, including links to the respective trade recommendations/analyses, in the link in my bio.

Nq & Es Key Levels 19-08-2025Good Morning everyone.
Looking at the charts today, we notice that the situation has not changed much compared to yesterday—we are still trading around the same levels. This means that directional bias remains unclear, making it important to see how the market opens at 09:30 in order to reassess.
We are currently in a zone where price could either rise sharply before falling, or drop first and then recover. Therefore, after the market opens:
If price moves down, I will look for long opportunities.
If price moves up into the key levels I have marked on the chart, I will look for short setups.
Things may become clearer after 10:00, where higher-probability setups could form.
At the moment, we are trading within a premium zone, which naturally favors short positions. However, caution is required as market conditions can shift quickly during the session.
On the chart, I’ve highlighted the sensitive key levels I’m watching.
I wish you all good and disciplined trading.
