Nq ShortAfter taking a short position with the target I previously shared, I am now looking for a potential long opportunity — applying a scalping approach on Nasdaq.
⚠️ Disclaimer: This analysis reflects personal market observations and is for educational purposes only. It does not constitute financial advice.
NQX1! trade ideas

NQ Long IdeaI am not a Indices guy this is my Idea for NQ/ES We have retraced to discounted levels and OTE levels with Premium Array

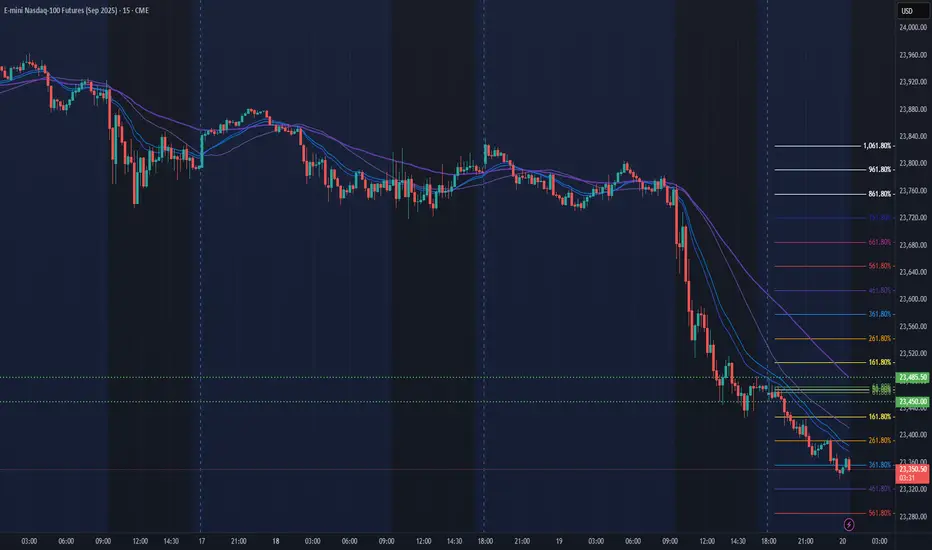
NQ Power Range Report with FIB Ext - 8/20/2025 SessionCME_MINI:NQU2025
- PR High: 23485.50
- PR Low: 23450.00
- NZ Spread: 79.5
Key scheduled economic events:
10:30 | Crude Oil Inventories
14:00 | FOMC Meeting Minutes
Session Open Stats (As of 12:35 AM 8/20)
- Session Open ATR: 282.07
- Volume: 38K
- Open Int: 287K
- Trend Grade: Long
- From BA ATH: -2.9% (Rounded)
Key Levels (Rounded - Think of these as ranges)
- Long: 24382
- Mid: 23239
- Short: 22096
Keep in mind this is not speculation or a prediction. Only a report of the Power Range with Fib extensions for target hunting. Do your DD! You determine your risk tolerance. You are fully capable of making your own decisions.
BA: Back Adjusted
BuZ/BeZ: Bull Zone / Bear Zone
NZ: Neutral Zone
19 August 2025Clean shorts presented several times today.
Same inversion FVGs.
For the first time I took 1h inversion short.
Need to focus on leaving the trades alone.

NQ 4H Bounce off the 200EMAI trade time based LQ primarily so the idea is pretty self explanatory. Hit me up if you want to talk about it

NQ: 237th trading session - recapNo scalp today either. I'm starting to worry again due to lack of trades. Some months I don't even trade at all, which is NOT GOOD.
I need to do something about that...
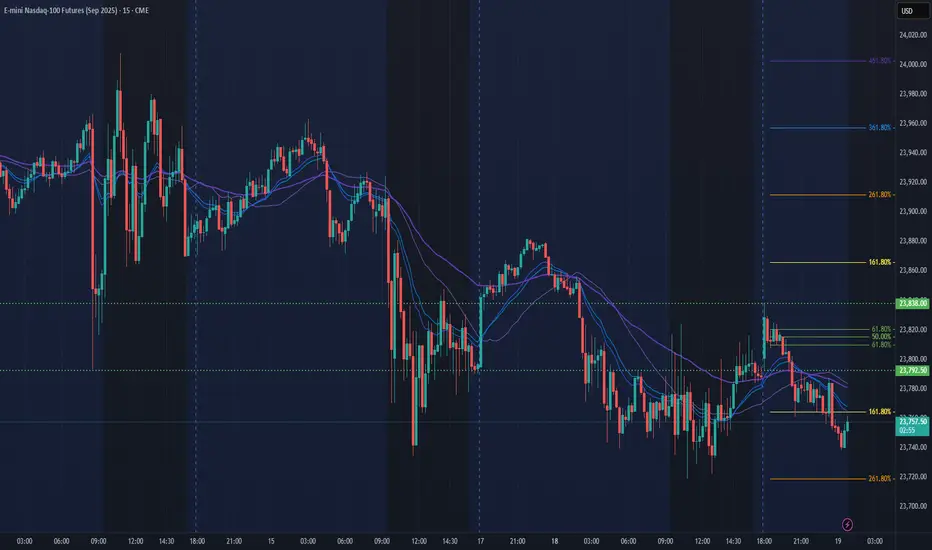
NQ Power Range Report with FIB Ext - 8/19/2025 SessionCME_MINI:NQU2025
- PR High: 23838.00
- PR Low: 23792.25
- NZ Spread: 102.25
No key scheduled economic events
Session Open Stats (As of 12:45 AM 8/19)
- Session Open ATR: 269.98
- Volume: 22K
- Open Int: 293K
- Trend Grade: Long
- From BA ATH: -1.3% (Rounded)
Key Levels (Rounded - Think of these as ranges)
- Long: 24382
- Mid: 23239
- Short: 22096
Keep in mind this is not speculation or a prediction. Only a report of the Power Range with Fib extensions for target hunting. Do your DD! You determine your risk tolerance. You are fully capable of making your own decisions.
BA: Back Adjusted
BuZ/BeZ: Bull Zone / Bear Zone
NZ: Neutral Zone
NQ Futures Daily Plan – August 19, 2025NQ Futures Daily Plan – August 19, 2025
NQ remains in a 3-day balance structure ahead of tomorrow’s housing data (8:30 ET) and this week’s Fed Symposium. Price continues to rotate inside balance, with 23,827 acting as the bull/bear pivot.
Key Levels:
• 🔼 23,980–24,000 → Breakout trigger
• 🔼 23,900–23,940 → Upside acceptance zone
• ⚖️ 23,827 → Line in the sand
• 🔽 23,760–23,770 → Weekly pivot support
• 🔽 23,742.50 → 3-day balance low
• 🔽 23,700 → Downside target if balance fails
Plan:
• Range trade between 23,770–23,940 = scalping zone.
• Break above 23,940 = target 24,000.
• Break below 23,742.50 = target 23,700.

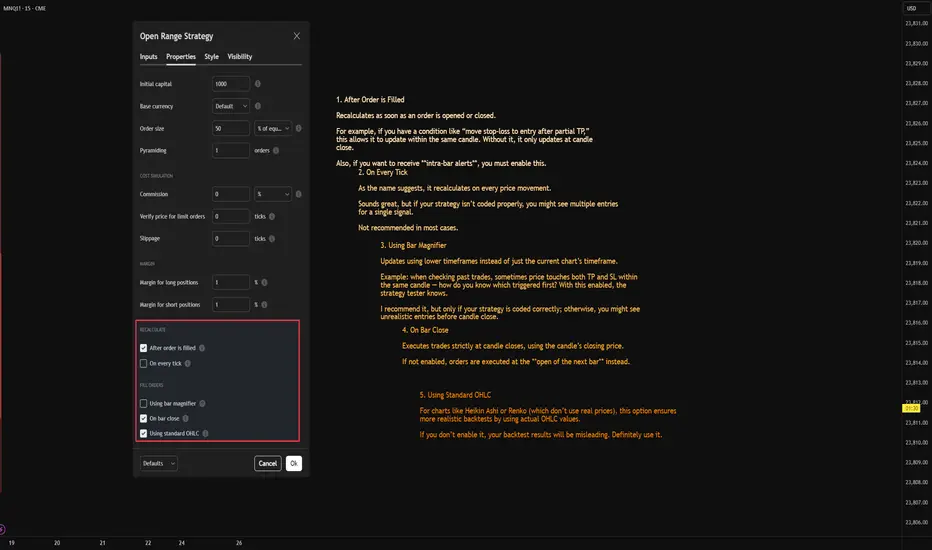
Do you really know what these Strategy Properties checkboxes do Hi everyone,
I'm a Pine script developer and i’ve noticed that many people don’t fully understand what the checkboxes in the **Strategy Properties** section of TradingView actually do. So I’d like to quickly explain them with practical examples:
1. After Order is Filled
Recalculates as soon as an order is opened or closed.
For example, if you have a condition like “move stop-loss to entry after partial TP,” this allows it to update within the same candle. Without it, it only updates at candle close.
Also, if you want to receive **intra-bar alerts**, you must enable this.
2. On Every Tick
As the name suggests, it recalculates on every price movement.
Sounds great, but if your strategy isn’t coded properly, you might see multiple entries for a single signal.
Not recommended in most cases.
3. Using Bar Magnifier
Updates using lower timeframes instead of just the current chart’s timeframe.
Example: when checking past trades, sometimes price touches both TP and SL within the same candle — how do you know which triggered first? With this enabled, the strategy tester knows.
I recommend it, but only if your strategy is coded correctly; otherwise, you might see unrealistic entries before candle close.
4. On Bar Close
Executes trades strictly at candle closes, using the candle’s closing price.
If not enabled, orders are executed at the **open of the next bar** instead.
5. Using Standard OHLC
For charts like Heikin Ashi or Renko (which don’t use real prices), this option ensures more realistic backtests by using actual OHLC values.
If you don’t enable it, your backtest results will be misleading. Definitely use it.
My suggestion:
- Always keep After Order is Filled and Using Standard OHLC enabled.
- If your past trades look clean (no strange early entries), also use Bar Magnifier for more accurate results.
Thanks for reading, stay safe out there!
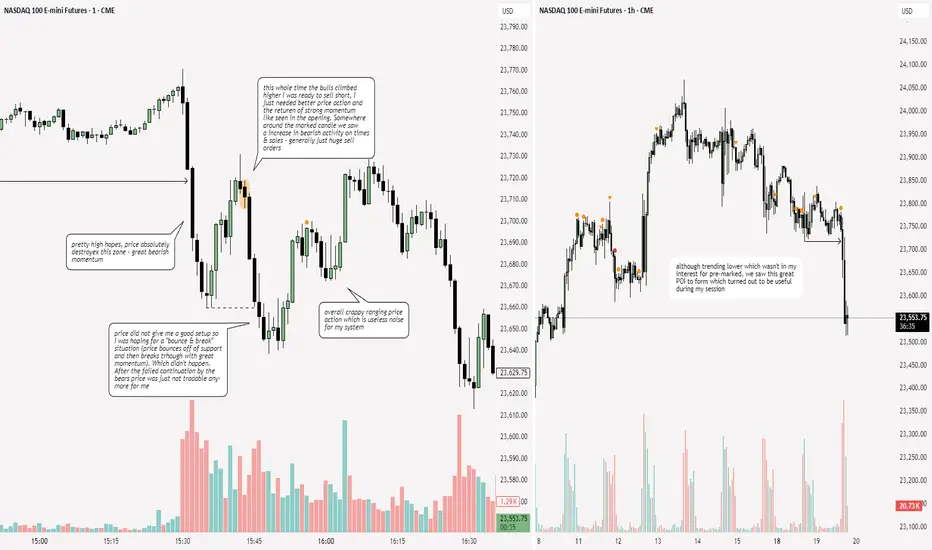
18 AUGUST 20253 Trades today. I was not looking to take any trades today because of no news and price is very choppy on a no news day. However, few very clean setups were present on LTF.
SMT
1h FVG
Inversion

NQ: 236th trading session - recapGood session - usually mondays are boring ash, but twith the times & sales event it really made a difference. Too bad prica action was sloppy
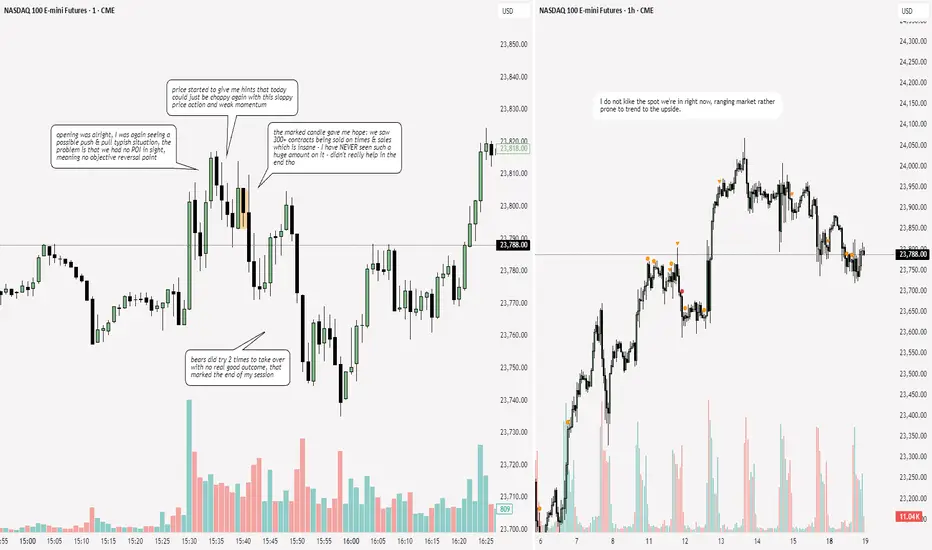
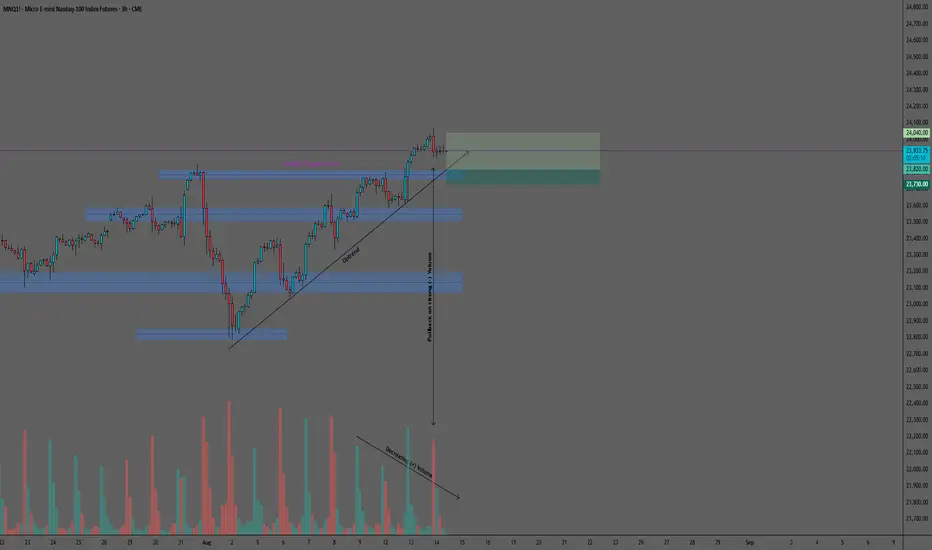
MNQ (Micro Nasdaq 100 Futures) Trade Setup – 3H TimeframeMNQ: Likely Retest of Nearest Support in Uptrend with Rebound Toward All-Time High
MNQ has been in a sustained uptrend since August 4, 2025, forming a clear sequence of higher highs and higher lows supported by constant positive volume inflow. On August 12, price broke above both the 23,800 resistance zone and the 23,848 all-time high following major news, with the breakout supported by strong buying volume.
The 3-hour chart shows that after the breakout, momentum has slowed and positive volume has gradually declined. A sharp spike in negative volume on August 13 suggests selling activity near the new high zone, increasing the likelihood of a pullback toward the 23,800 area—a strong liquidity level and former resistance now acting as support.
Illustrative Setup: A Buy Limit order at 23,820 positions the entry near the top of the 23,800 support zone, aiming to capture a rebound in line with the prevailing uptrend. A Stop Loss at 23,730 sits just below the support level, providing a clear invalidation point. The Take Profit target at 24,040 is set near the August 13 new all-time high (24,069), offering a favorable 2.44:1 reward-risk ratio.
Key considerations: The combination of an intact uptrend, a well-defined, strategic support zone, and the potential for a technical retest creates a bullish setup with multiple confirmations. However, given the proximity to all-time highs, traders should watch for volatility and / or potential consolidation before any new significant move takes place. Monitoring intraday volume dynamics can provide additional confirmation before entry.
This analysis is provided solely for educational and entertainment purposes and does not constitute any form of financial or investment advice. Always manage your risk and trade responsibly.
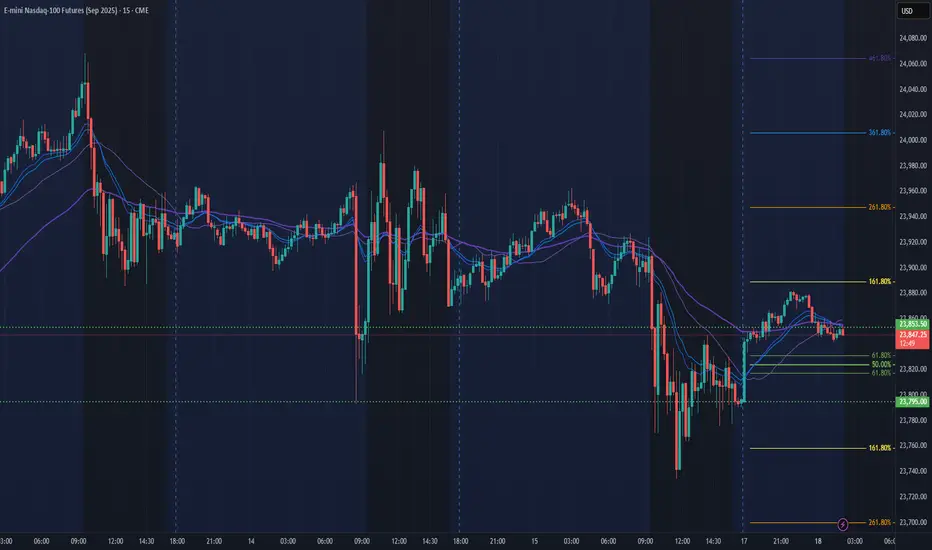
Nq & Es Analysis 18-08-2025Good evening everyone, I’m back to share some key levels and potential scenarios for NASDAQ and S&P.
We notice that price has recently made a small pullback after last week’s reaction at the all-time highs (ATHs). At the moment, there are multiple levels where price could react, and we are positioned in a very critical zone.
I have no directional bias for today. The best approach is to wait for confirmation of what the market is actually trying to show us, and observe how the opening session develops. This will help us better understand how to use the key levels I have highlighted on the chart.
⚖️ Remember:
In premium zones, we look for short setups.
In discount zones, we look for long setups.
For today, I am simply observing without giving any specific scenario. Trade carefully and I wish you all a successful session.

NQ Power Range Report with FIB Ext - 8/18/2025 SessionCME_MINI:NQU2025
- PR High: 23853.50
- PR Low: 23795.00
- NZ Spread: 131.0
No key scheduled economic events
Session Open Stats (As of 12:25 AM 8/18)
- Session Open ATR: 277.67
- Volume: 17K
- Open Int: 291K
- Trend Grade: Long
- From BA ATH: -0.9% (Rounded)
Key Levels (Rounded - Think of these as ranges)
- Long: 24382
- Mid: 23239
- Short: 22096
Keep in mind this is not speculation or a prediction. Only a report of the Power Range with Fib extensions for target hunting. Do your DD! You determine your risk tolerance. You are fully capable of making your own decisions.
BA: Back Adjusted
BuZ/BeZ: Bull Zone / Bear Zone
NZ: Neutral Zone
E-mini Nasdaq-100 Trading Setup for sellers ^)We have completed cup and handle pattern here...
So after the price is still high!
We may see some price gain additional, something like 13-18% .
So we have two option here for the sellers, wait and sell from marked point 1 or 2 .
P.S. This is very long time range position. ( Something like 200-800 day ).
Have a profit in your day!
Thanks.

Monday NQ Daily Plan | August 18, 2025NQ Daily Plan | August 18, 2025
Market Context & Key Levels for the Day Ahead
Market Context
On Friday, NQ continued to coil below 24,000, with an RTH profile that leaned b-shaped (long liquidation).
Overnight action set up balance around 23,750–23,950, echoing the broader multi-day consolidation following the CPI-driven breakout.
The 5D VPOC has shifted higher into the 23,875 area, which confirms short-term strength in the context of last week’s breakout. Value is moving higher with price — bullish unless acceptance back inside old balance occurs.
The current 3-day balance range runs from 23,750 up to 23,975–24,000 (balance high).
Balance Guidelines (Applied to NQ)
In balance, fade extremes (short near highs, long near lows) unless strong acceptance develops.
Breakouts:
Sustained trade above 24,000 = follow buyers higher into discovery.
Sustained trade below 23,750 = follow sellers lower toward downside magnets.
Failed Breakouts:
If price pokes outside balance but returns inside, bias shifts to target the opposite end of balance.
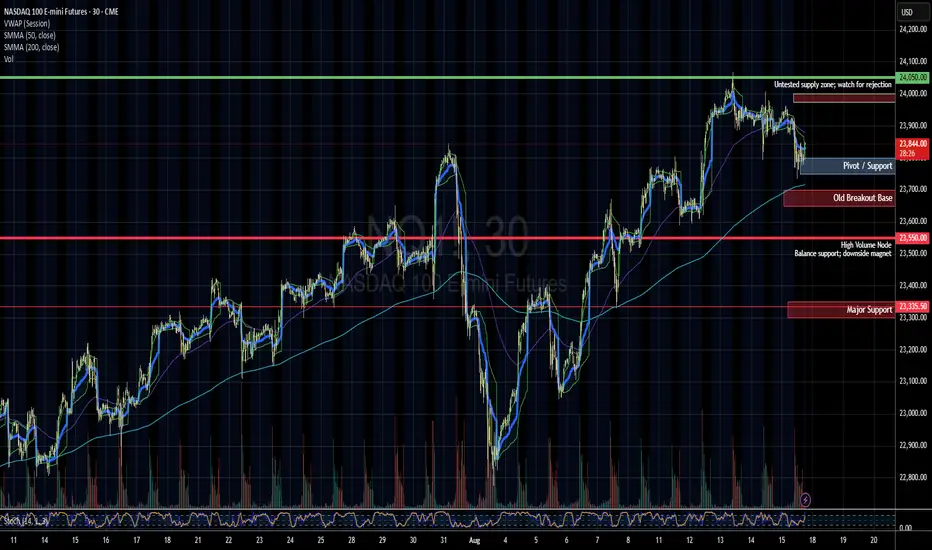
Key NQ Levels for Monday
Level Context / Bias
24,050 (FUT) Final Upside Target if breakout holds
23,975–24,000 (UT2) Balance High / Breakout Trigger
23,925–23,950 (UT1) First upside resistance / acceptance zone
23,800–23,825 Pivot Support (line in the sand)
23,750 Lower edge of 3-day balance
23,700–23,675 (DT1) Support if balance fails
23,550 (FDT) High Volume Node / Downside Magnet
🎯 Trade Scenarios
Bullish (Continuation of Breakout)
Hold above 23,800–23,825 → push into 23,925 → 23,975–24,000.
Acceptance above 24,000 opens 24,050+ (FUT).
Bearish (Failed Breakout / Breakdown)
Lose 23,800 / 23,750 → rotate down to 23,700–23,675.
Sustained selling opens test of 23,550 (FDT).
Neutral (Balance Rotation)
Between 23,750–23,950, expect chop → fade extremes until news or order flow confirms breakout.
Confirmation via VIX & Macro
Watch VIX 16.0 / 14.0 equivalents in NQ volatility measures.
A breakout above 24,000 with volatility compressing = stronger confirmation.
Breakdown below 23,750 with volatility expanding = confirmation of weakness.
Monday’s NAHB Housing Index (10 AM ET) and overnight China/Japan data may provide early catalysts.
Summary for Monday:
NQ sits inside a 3-day balance (23,750–23,975).
Above 24,000 → breakout continuation toward 24,050+.
Below 23,750 → sellers target 23,700 then 23,550.
Expect rotations within balance until housing data or broader macro headlines provide direction.

NQ Futures | Key Levels & Catalysts (Aug 18–22, 2025)NQ futures are coiling between 23,750–23,950, following last week’s breakout attempt that stalled near 24,000. This week’s catalysts could set the tone for the next directional move.
Key Levels
24,050 → Supply zone (watch for rejection).
23,975–24,000 → Breakout trigger.
23,800–23,825 → Pivot support.
23,750 → Line-in-the-sand for bulls.
23,550 → Downside magnet if 23,750 fails.
Major Catalysts
Mon (Aug 18): NAHB Housing Confidence.
Tue (Aug 19): Housing Starts + Home Depot earnings.
Wed (Aug 20): Lowe’s earnings, FOMC Minutes.
Fri (Aug 22): Powell speaks at Jackson Hole.
Housing data + retail earnings will offer an early read on consumer and housing strength, while Jackson Hole is the wildcard for rates and liquidity.
Trade Scenarios
Bullish → Hold 23,750–23,800, break above 24,000 → target 24,050–24,150.
Bearish → Lose 23,750, sell momentum toward 23,550, possibly 23,300.
Neutral → Chop between 23,750–23,950 until catalysts break balance.
Bias : Stay patient in the balance zone. Housing + retail earnings set the tone early, but Powell’s Jackson Hole speech decides the week.
ABC Correction in Play: Watching 23,920 Then Drop Toward 23,380📝 Idea Write-Up (casual & short for TradingView):
Looks like we could be setting up for a classic ABC correction here.
A (23,587 zone): Price may dip into the green demand area before bouncing.
B (23,920 area): Possible relief rally back into resistance.
C (23,380 target): If sellers step back in, we could see the final leg lower toward the demand below.
Main structure is: drop → bounce → continuation lower.
If price reclaims and holds above 23,920, then the bearish ABC outlook gets invalidated.
⚠️ Disclaimer:
This is just a market idea, not financial advice. Always trade with proper risk management.

#202533 - priceactiontds - weekly update - nasdaq e-miniGood Day and I hope you are well.
comment: Neutral. Bull flag but market is holding above the breakout price around 23800. Bears need a strong move below 23600 for more downside and if bulls stay above 23800, we can only assume sideways to up movement. I doubt we get another leg up but I have been wrong on that couple of times now. No longs for me above 23500. Only interested in a breakdown for 23400ish or 23000.
current market cycle: bull trend - peak bubble
key levels for next week: 22800 - 24100
bull case: Bulls remain in full control but a bigger pullback is expected. Until that happens, we can continue up since market is living on momentum and it’s still going strong. For a change bulls need to be trapped and that has not happened since April. Every dip buy was profitable but I do think it’s way beyond overdone and moronic to buy above 23000.
Invalidation is below 22700
bear case: Bears still do not have anything here. It doesn’t ever matter if we print 24000 or stay below 23848, until we see big bear bars closing on their lows again, this is likely going higher and bears can not hold short here where the strategy is hope. Nothing has changed last week. Bears need big red bars closing on their lows and trapping late bulls.
Invalidation is above 24100
short term: Neutral at best. Bears not doing enough and btfd is still going strong. Could easily do another test for 24100 before turning but I would not be surprised if we grind down to 23400ish and test the trend line again.
medium-long term - Update from 2024-08-10: Bear trend did not start last week. Sad but ok. I am still only interested in seeing this bubble popping.

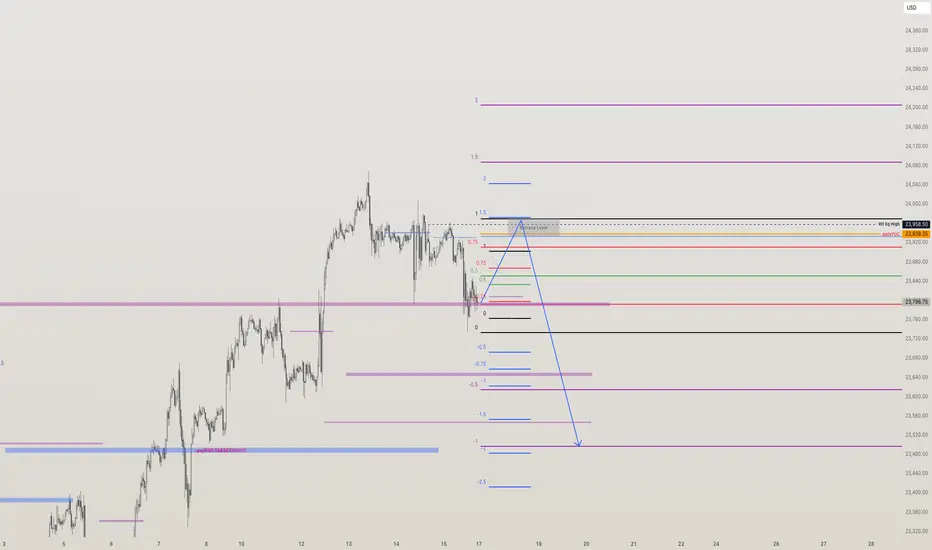
MNQ Trade IdeaCurrent Price: 23,796 (Green Line)
Setup Analysis
Price is approaching the Buy Signal level with defined premium zones. Current positioning suggests potential for upward momentum from key support levels.
Trade Parameters
• Buy Entry: 23,827 (Buy Signal Level)
• Target 1 (TP1): 23,946
• Target 2 (TP2): 24,065
• Stop Loss: 23,608
• Risk/Reward: Approximately 1:2.5 to 1:4
Key Premium Zones
• Premium Buy Area: 23,707 - 23,608
• Premium Sell Area: 24,064 - 24,163
Trading Strategy
🔍 Price Action Focus: Observe price behavior at all key levels:
• Buy Entry (23,827): Wait for confirmation before entering
• TP1 (23,946): Monitor for continuation or reversal signals
• TP2 (24,065): Watch price action near premium sell zone
• SL (23,608): Respect the stop loss level
💡 Flexible Approach:
• Entry decisions should be based on price action at these levels
• Consider short-term reversal trades at key levels with appropriate position sizing
• Premium zones offer opportunities for counter-trend plays with proper risk management
⚠️ Risk Management:
• Position size appropriately for your account
• Honor your stop loss at all times
• Take partial profits at TP1
• Adjust position size for reversal trades in premium zones
This is not financial advice. Trade at your own risk and always do your own research.

NQ Bearish Setup after reaching Rejection levelNQ Bearish Setup after reaching Rejection level.
Expecting price to reach old VWAP level purge poor high and hit high volume to then retrace and potentially reverse to mitigate naked POCs.
NQ daily retracement level reached - potential upcoming longsNQ retraced excatly to the 0.705 Fib level and into the daily order block. A valid POI for a swing low formation that can turn into a MMSM to new ATHs.
During the retracement nice trendline liquidity was built that can be used during the new bullish swing.

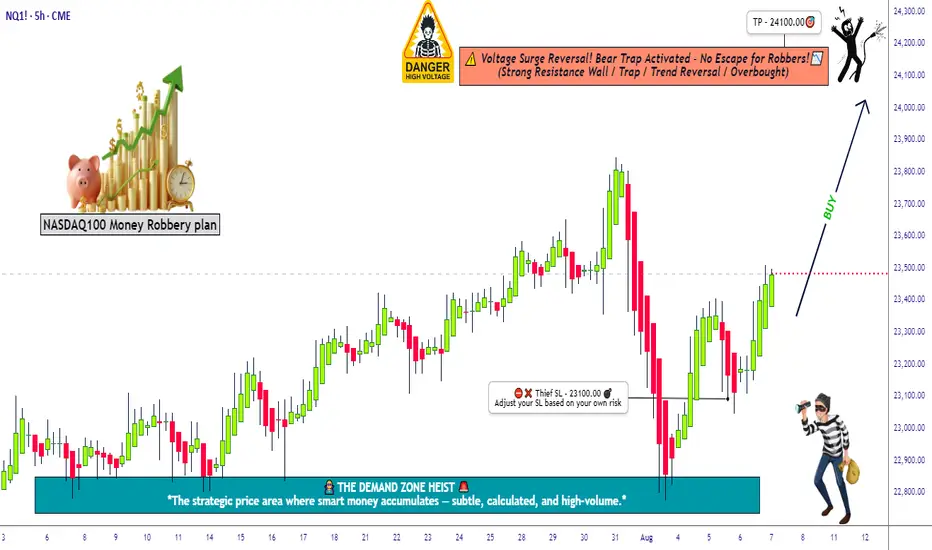
Robbing the Nasdaq Futures | NQ1! Plan with Precise Targets💥🚨NQ1! “E-Mini Nasdaq 100” Heist Alert 🚨💥
🎯Thief Trader Bullish Takeover Plan🕵️♂️📈
🌍 Dear Global Looters & Market Bandits, 💰💸💎
It's time to crack the vaults of the Nasdaq 100 Futures (NQ1!) — Thief-style! No mercy. No fear. Just profits. 🔥
🔓 The digital vault is open — we’re layering multiple limit orders like pros to snatch the tech treasure chest. This isn’t just a trade…
👉 This is an organized robbery of Wall Street’s most elite index. 🏦🕶️
💎 Entry Point = Anywhere on the Grid!
Set your buy limit orders at juicy dips — 15m / 30m / 1H zones, support bounces, or wherever the chart whispers "steal me." 🎧📉
⏰ Stay alert — we don’t chase, we trap. 🐍
🛑 Stop Loss = 23100.00
Set it & forget it below key swing low.
You’re not in this heist to bleed. Risk small. Layer tight. Protect the stash. 🛡️💼
🎯Target = 24100.00
That’s the exit zone before the feds (aka market makers) catch on.
Be smart — take profit early if the heat gets real. 🚓🚨
🧠Strategy Mode: Layering Limit Orders
Thief never enters with one shot. We layer in like ghosts — scaling into value zones, controlling the risk, and building power before liftoff. 🚀📊
This ain’t gambling — it’s structured robbery with exit plans. 🎯💼
🧲 Scalpers & Swingers Welcome!
⚔️ Got big capital? Smash the levels and ride the breakout.
💼 Small cap thief? Ride with the swing crew — safer, smoother, more stealthy.
📍Always use Trailing SL — never let the market take back what you stole. 💰
📰 Market Sentiment: Bullish Bias 😈
AI hype. Earnings season. Rate cuts. You name it — it’s all fueling the Nasdaq rocket.
We’re riding momentum, not hope. This ain’t luck — it’s Thief precision execution.
🔔 Pro Thief Tips:
⚠️ Avoid entries during high-impact news.
🚀 Use alerts. Monitor VIX + QQQ.
💻 Watch for liquidity zones & trap setups.
🚀💣 Smash that 🔥Boost Button🔥 if you love robbing the market like a pro!
Help grow the Thief Trading Crew — one like = one stolen candle from the whales. 💵🦈
We rob institutions, not each other. 💯🤝
Stay locked in — next heist plan coming soon. 📡📈
#NQ1 #Nasdaq100 #EminiFutures #ThiefTrader #RobTheMarket #LayeringStrategy #SmartMoneyMoves #BullishPlan #WallStreetHeist #TradingViewSetup