SP500, Euro, GOLD & Ether H1 - Daily Trade SetupsIn this update we review the recent price action in the SP500, Euro, Ether & Gold futures markets and identify the next high-probability trading opportunities and price objectives to target. To review today's video analysis, click here!
Related futures

ETHUSD Fractal Inverse H&S H1/D1 - Daily Trade SetupsIn this update we review the potential for a fractal inverse head & shoulders scenario looking at the Daily & Intraday price action and identifying the next high probability trading opportunity and price objectives to target. To review today's video analysis click here!

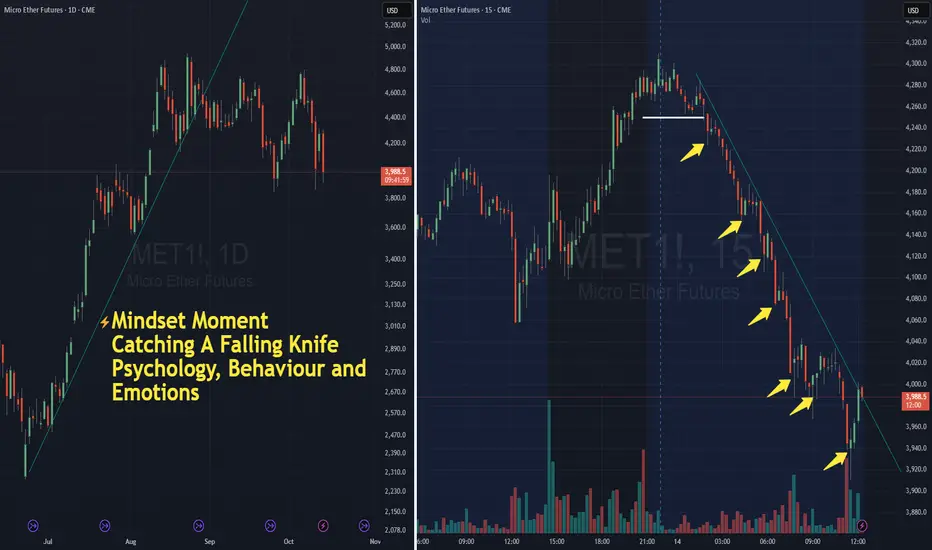
Catching a Falling Knife - The Illusion of OpportunityNOTE – This is a post on mindset and emotion. It is NOT a trade idea or system designed to make you money. My intention is to help you preserve capital, energy, and focus — so you can execute your own trading system with calm and confidence.
A sharp selloff.
Price is plunging.
The chart looks like
BTC1 & ETH1 Daily Trade Setups 1/10/25in this update we review ht ercent price action inBitcoin & Ether futures and identfy the next high probability trade setups and price objectives to target. To review todays video analysis click below!

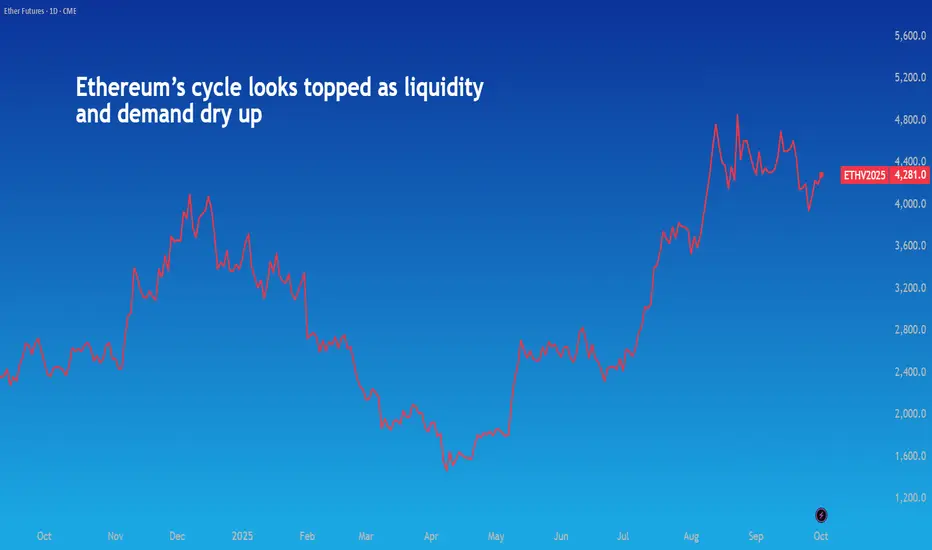
Ethereum’s cycle looks topped as liquidity and demand dry upCrypto bull markets tend to follow a script: Bitcoin outperforms Ethereum, the latter catches up along with altcoins, eventually ending its bull rally after hitting an all-time high.
In 2025, that pattern repeated, and Ethereum now looks caught at the end of its run. The network’s liquidity is va
ETHUSD - Expect a bounce ... now? lets go above ATHLong time no see !
I was in vacations with the cult of the CME Gap that I joined
Soooo, Eth took some logic profits, it was a quasi straight line from 2400 to 4800 (not mentionning that its coming before from under 1500), a 10% correction is totally ok
we are actually in the middle of the last CM

ETH1!GAP AND 0.61 FIBBO INTERESTING POINT REMEMBER GAP CLOSE ALWAYS gap´always close all chart is similar . review by backtesting.

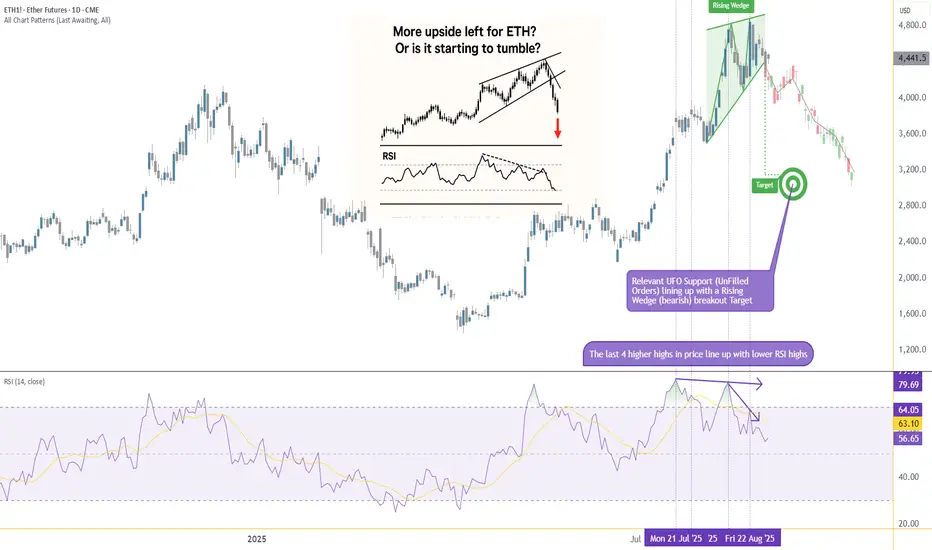
From Strength to Weakness: ETH Validates a Key Bearish PatternIntroduction (Market Context)
Ether Futures (ETH) and Micro Ether Futures (MET) have been at the center of market attention since April 2025, when prices staged a remarkable rally of more than +250%. This surge was not just a technical phenomenon—it came in the wake of major macro events such as L
GC1, SI1, BTC1 & ETH1 Daily Trade SetupsGC1, SI1, BTC1 & ETH1 Daily Trade Setups
In this update we review the recent price action in Gold, Silver, Bitcoin & Ether futures and identify the next high probability trade setups and price objectives to target. To review todays video analysis click below!

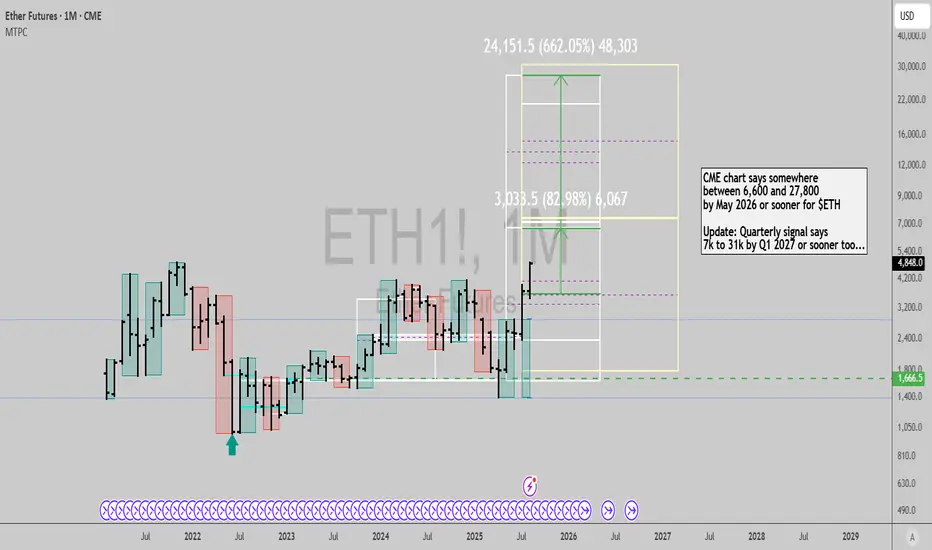
Ether futures: Quarterly signal and new ATH...GN gents,
As you know, I've been bullish ETH for a while now, although I had hedged partially in the last few days ahead of the correction we had, but now started deploying cash I raised again. Ether futures chart from CME shows more conservative targets than stop given that it has more limited dat
See all ideas
Displays a symbol's price movements over previous years to identify recurring trends.