From Shutdown Relief to AI Anxiety — Two Narratives Driving ESMarket Theme
The week began on a strong footing, driven by a bullish Sunday reopen in ES after news broke that the 43-day government shutdown was set to end, following the Senate’s late-night support for a potential agreement on November 9th. This relief catalyst created early upside momentum, pus
Related futures

/ES1! Analysis towards openingJust purchased Trading View Premium today and I've been playing around some of the features they offered, when I realized looking at the cummulative delta that there is a divergence and passive sellers have been absorving throughout the friday session. I guess when they are done accumulating their s

here is the clean price action i am short on this till yesterday mid day !! trade setup is up !! everything is alligned now just go for the short
ES Gap AlertFutures are up but they all gapped up which means that has to fill, but you guys know that by now, lol. It is headed down right now.
Not sure what the pattern will be because market will be closed Thu and half day on Fri, and day after Thanksgiving is usually low volume trading.
We'll see what fu
The Truth About Timeframe Analysis (No One Wants to Tell You)*You’re not confused because the market is chaotic.
You’re confused because your framework is garbage.*
🔥 Timeframes Don’t Lie — But Traders Do
Let’s be real:
You jump between timeframes looking for “confirmation,”
but all you’re really doing is collecting excuses.
1H looks bullish
15M looks l
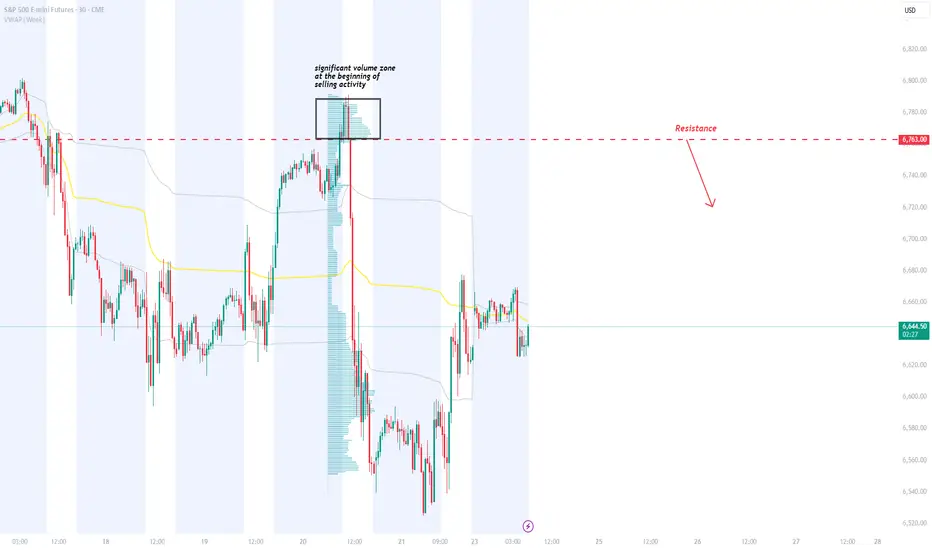
ES 6763: Heavy-Volume Resistance + FVG Confluence Short SetupPrice is approaching a strong resistance on ES at 6763. This level sits at the start of a heavy-volume zone created during a major selloff, where sellers built short positions and are likely to defend again. A bearish Fair Value Gap aligns with the same level, adding strong confluence. If price pull
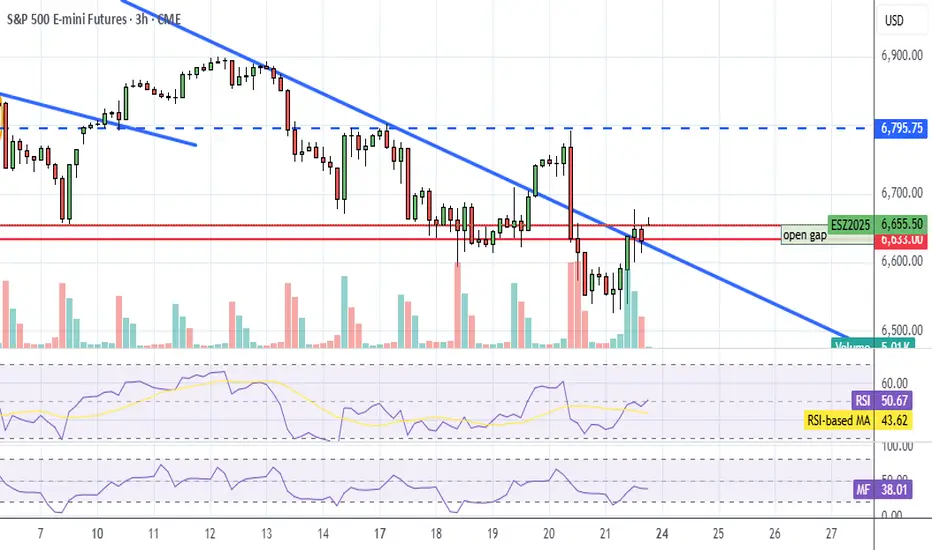
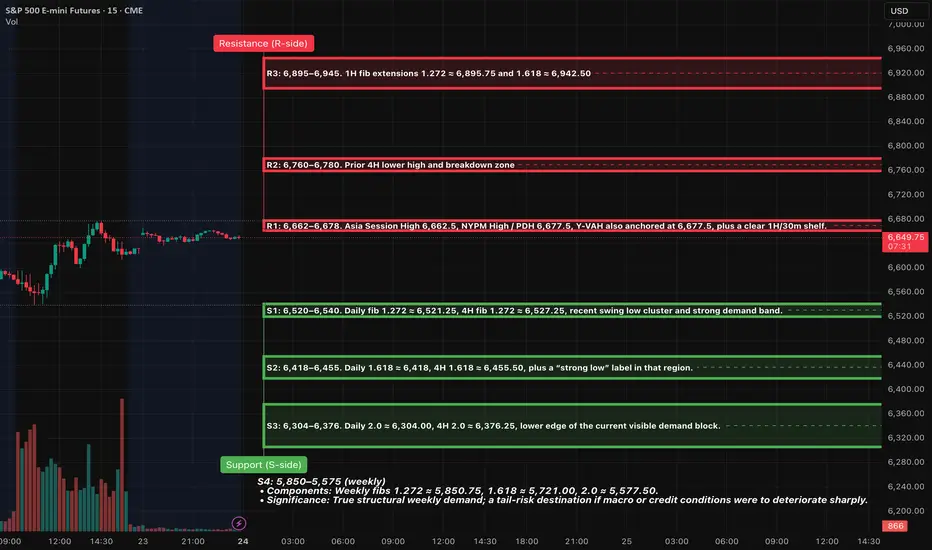
ES (SPX, SPY) Week Ahead Analysis - (Nov 24th - 28th)Executive Overview
Equity markets, particularly the E-mini S&P 500 (ES), are currently navigating a broader weekly uptrend, yet have entered a phase of short-term correction after encountering resistance around the 6,900 to 7,000 level. Presently, prices hover near 6,660, finding support from a ro
ES UpdateIndicators still show a melt up, but there's a gap below and usually the market has a red day after a holiday pump week, so watch out for Monday.
Opted to sell my GLD calls and going cash for the weekend.
It's usually not a good idea to place any trades on a half day anyways.

ES Gap AlertIndex futures all threw a gap up on the Thanksgiving break. If it doesn't fill Friday, it'll probably fill Monday.
Don't recommend going long on the half day trading.

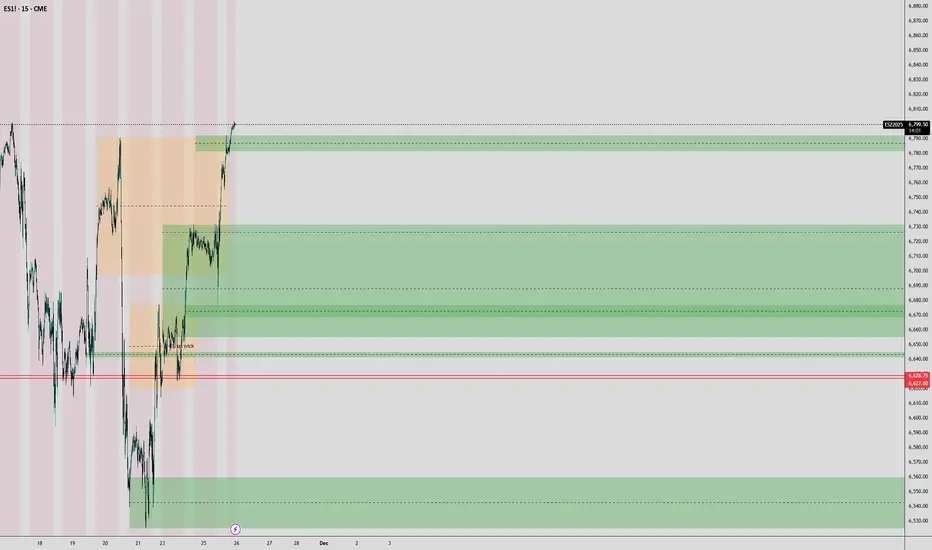
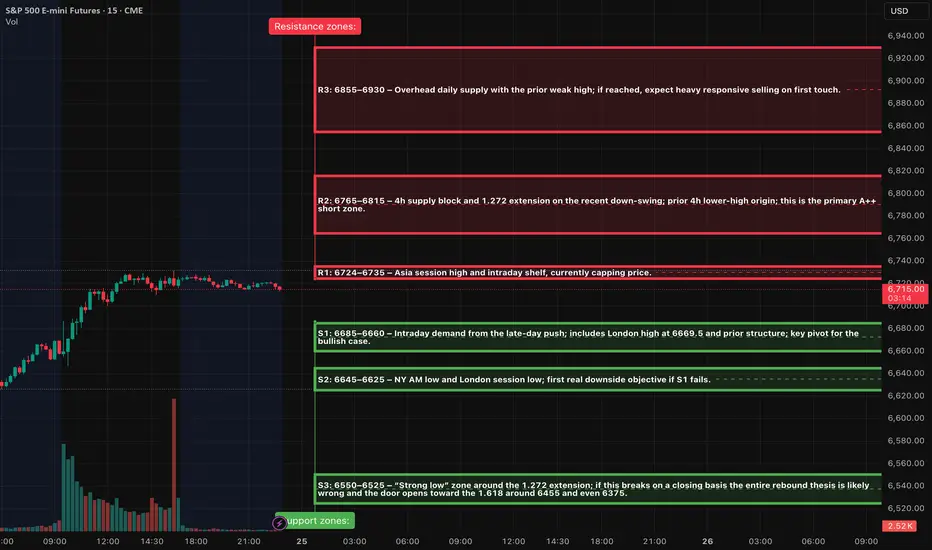
ES (SPX, SPY) Analysis, Levels, Setups for Tue (Nov 25th)Market Outlook: Analyzing Technical Trends and Economic Indicators
The recent rebound from the 6520–6450 support zone has generated a constructive short-term outlook. However, the market now approaches a significant supply area in the 6800 range. While the immediate trend appears to favor modest g
See all ideas
Summarizing what the indicators are suggesting.
Neutral
SellBuy
Strong sellStrong buy
Strong sellSellNeutralBuyStrong buy
Neutral
SellBuy
Strong sellStrong buy
Strong sellSellNeutralBuyStrong buy
Neutral
SellBuy
Strong sellStrong buy
Strong sellSellNeutralBuyStrong buy
A representation of what an asset is worth today and what the market thinks it will be worth in the future.
Frequently Asked Questions
The current price of E-mini S&P 500 Futures (Jun 2030) is 7,855.00 USD — it has risen 0.40% in the past 24 hours. Watch E-mini S&P 500 Futures (Jun 2030) price in more detail on the chart.
Track more important stats on the E-mini S&P 500 Futures (Jun 2030) chart.
The nearest expiration date for E-mini S&P 500 Futures (Jun 2030) is Jun 21, 2030.
Traders prefer to sell futures contracts when they've already made money on the investment, but still have plenty of time left before the expiration date. Thus, many consider it a good option to sell E-mini S&P 500 Futures (Jun 2030) before Jun 21, 2030.
Buying or selling futures contracts depends on many factors: season, underlying commodity, your own trading strategy. So mostly it's up to you, but if you look for some certain calculations to take into account, you can study technical analysis for E-mini S&P 500 Futures (Jun 2030). Today its technical rating is strong buy, but remember that market conditions change all the time, so it's always crucial to do your own research. See more of E-mini S&P 500 Futures (Jun 2030) technicals for a more comprehensive analysis.