Day 80 — From Green to Red: The Danger of OverstayingEnded the day -$256 trading S&P Futures. I was actually up +$250 early in the session, but I made the mistake of itching for more after playing it safe with small gains all week. I decided to size up to 6 contracts on a Buy signal that looked solid, but the market had other plans. We saw a "flash cr
Related futures

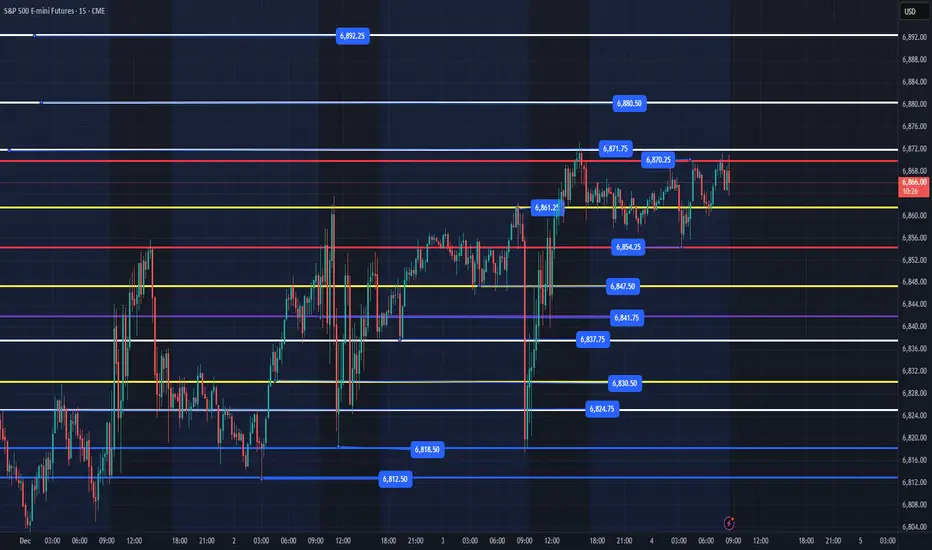
ES - December 5th - Daily Trade PlanDecember 5th- Daily Trade Plan - 7:30am
*Before reading this trade plan, if you did not read yesterday's take the time to read it first! (You can view the posts in the related publication section) *
If my posts provide quality information that has helped you with your trading journey. Feel free to

ES1 - Can A Fartcoin Predict A FOMC CorrectionThis is not a high certainty call but there are warning in lower dominance meme coins that may perhaps be signalling bearish action in the crypto that may be part of a canon to signal bearish action post FOMC.
So, a speculative call, but I have adjusted risk based on this.
This analysis is shared

ES - December 4th - Daily Trade PlanDecember 4th- Daily Trade Plan - 8:30am
*Before reading this trade plan, if you did not read yesterday's take the time to read it first! (You can view the posts in the related publication section) *
If my posts provide quality information that has helped you with your trading journey. Feel free to
Day 81 — 100% Signal Accuracy & Back in RhythmEnded the day +$287.49 trading S&P Futures. After the stress of the last few sessions, I’m finally feeling better and getting back into a solid rhythm. Today was one of those rare days where the system was absolute perfection—we went 6 for 6 on the signals. With the market clinching a 4-day winning

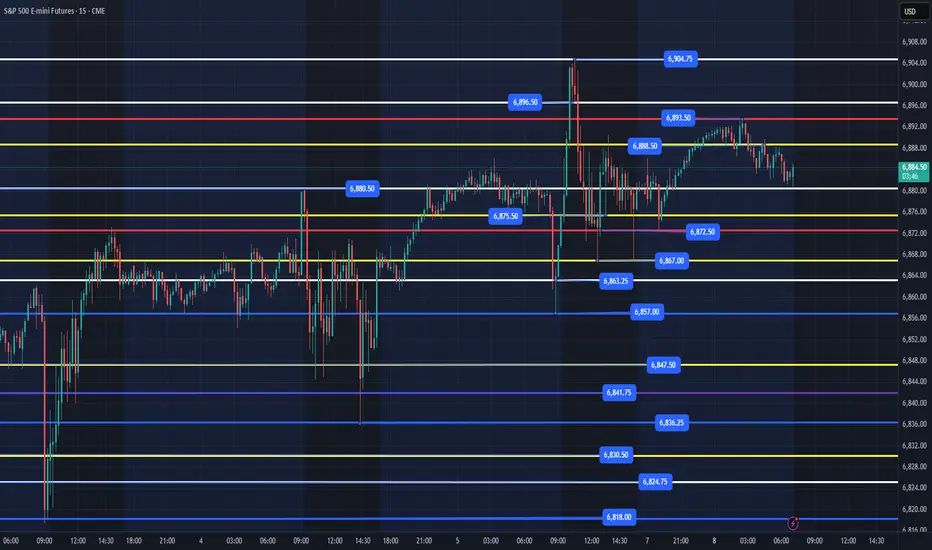
ES - December 8th - Daily Trade PlanDecember 8th- Daily Trade Plan - 7:10am
*Before reading this trade plan, if you did not read yesterday's take the time to read it first! (You can view the posts in the related publication section) *
If my posts provide quality information that has helped you with your trading journey. Feel free to
ES - December 11th - Daily Trade PlanDecember 11th- Daily Trade Plan - 6:45am
*Before reading this trade plan, if you did not read yesterday's take the time to read it first! (You can view the posts in the related publication section) *
If my posts provide quality information that has helped you with your trading journey. Feel free t

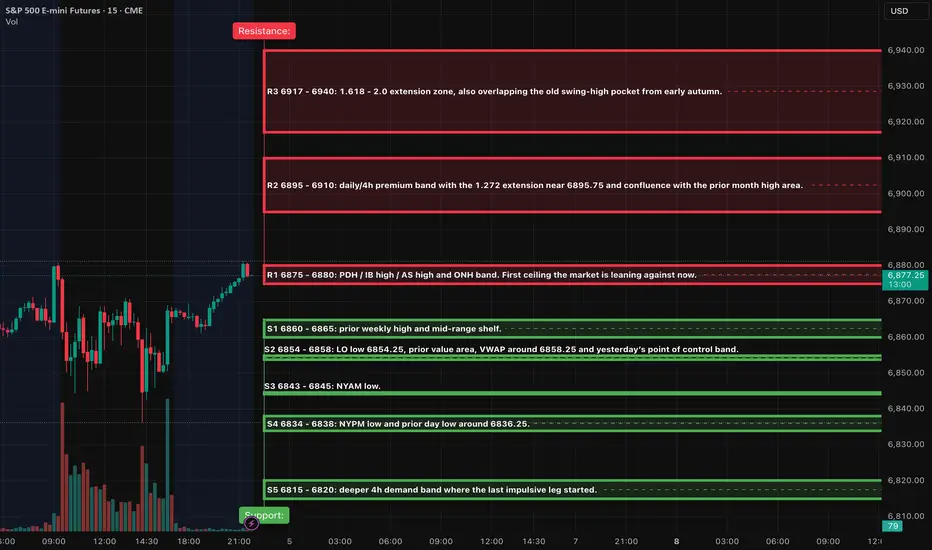
ES (SPX, SPY) Analysis, Key-Zone, Setups for Fri (Dec 5th)Market Overview
The daily trend remains firmly upward, with prices pressing against the November swing-high band, characterized by a sequence of higher lows and a gradual ascent toward previous peaks. Momentum indicators on both the daily and 4-hour charts are on the rise, yet they have not entere
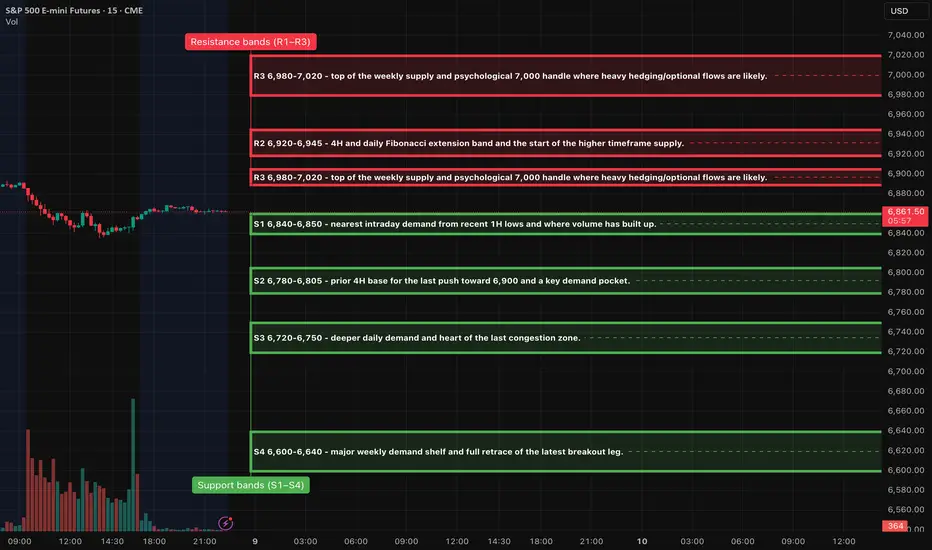
ES (SPX, SPY) Analysis, Key-Zones, Setups for Tue (Dec 9th)ES Market Overview (Daily/4H/1H)
The daily trend in the ES market remains bullish, with prices consistently above the most recent higher low while approaching a significant multi-month supply zone characterized by the 6,980-7,020 range. Although momentum has moderated, it has not completely revers
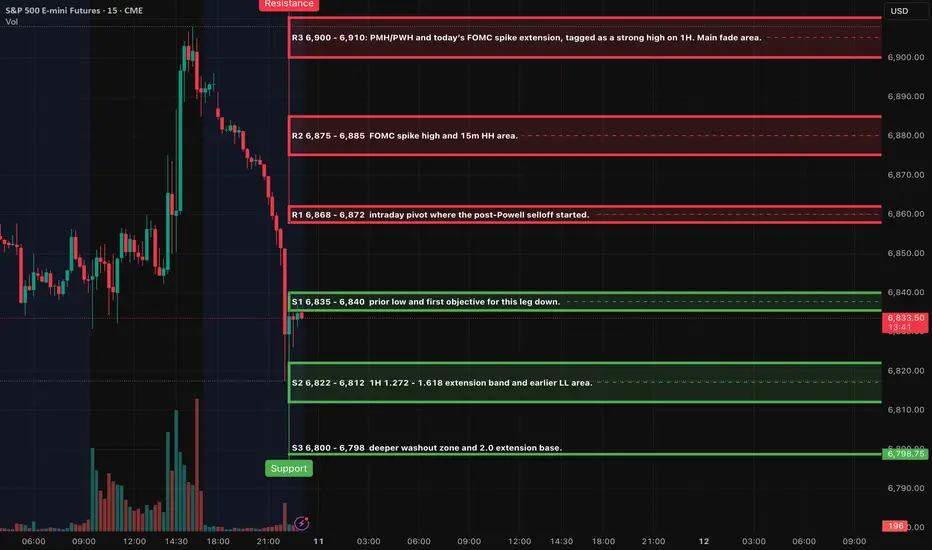
ES (SPX, SPY) Analysis, Key Levels for Thu (Dec 11th)The recent market decline has evolved into a significant liquidation wave rather than a standard pullback. Following the FOMC's interest rate cut and Jerome Powell's cautious commentary, the E-mini S&P 500 (ES) initially surged to a post-Fed high around 6,908 but then experienced a sharp reversal. T
See all ideas
A representation of what an asset is worth today and what the market thinks it will be worth in the future.
Displays a symbol's price movements over previous years to identify recurring trends.
Frequently Asked Questions
The nearest expiration date for E-mini S&P 500 Futures (Jun 2017) is Jun 16, 2017.
Traders prefer to sell futures contracts when they've already made money on the investment, but still have plenty of time left before the expiration date. Thus, many consider it a good option to sell E-mini S&P 500 Futures (Jun 2017) before Jun 16, 2017.