Day 64 — Trading Only S&P Futures | 6/7 Signal AccuracyRecap & Trades
Day 64 — a clean, structured trading day.
Started small with team trades from Bia’s setups, and when we hit the bottom of the day, I saw the double bottom support and multiple buy signals align.
That was the cue. I went long, set a 20-point trailing stop, and let the algo handle the rest.
Sometimes, the best play is not to overtrade — just trust your plan.
Lesson & Mindset
When you’re in sync with your system, execution becomes effortless.
The double bottom setup plus confluence from team signals made this a high-confidence day.
This is how professional consistency looks — smaller, cleaner, smarter.
News & Levels
Markets dipped after fresh layoff reports hit — Dow down 300, VIX spiked — but the bounce off key support shows resilience.
Tomorrow’s levels: Above 6835 bullish, below 6810 bearish.
Trade ideas

I Made $911 Trading S&P Futures | Day 65 Market BreakdownI made $911 today trading S&P Futures.
It didn’t come easy — I barely slept last night, and my overnight orders failed around 3 AM.
So I reset, stepped back, and waited for the one setup I’ve been tracking all week — the 6666 support bounce.
Here’s how it played out, and what the VX Algo system showed me before the move.
Pre-market sentiment was mixed. We had lingering shutdown headlines and low liquidity early in the session.
But structurally, the market was leaning bullish on higher timeframes — meaning any deep dip would likely get bought.
I had my eye on 6666 since last Friday as a key level.
That’s where gamma support, 5-min MOB, and prior structure all aligned — a textbook reversal zone.
When we got the VXAlgo ES X1 and NQ X3 buy signals near that level, I went long.
Used smaller sizing at first, added into strength, and locked profits using a trailing stop.
The bounce hit perfectly, and I was able to walk away green.
Even though I made money, I caught myself getting a bit greedy lately.
It’s a reminder — consistency comes from execution, not expectation.
The market will give you what it gives — your job is to wait for alignment and trade clean.
3 out of 4 signals worked today for at least 5 points each.
Tomorrow’s levels: Above 6822 bullish, below 6782 bearish.

ES UpdateRTY filled the gap, ES left open a small 1 pt gap, and NQ did not fill the gap at all. Really strange.
Anyways, 3 hr indicators moving up and Europe rallying. I'm not bullish though, might just take the week off.

Trading Rejection Strategy- A Visual Backtest💡 Overview
Here is everything you need to know about the strategy. But before you study it any further, all the visuals are at the end of this post- so don't miss that part.
This setup is built upon simple beliefs:
▶Price always remembers its key levels- Previous Day’s High (PDH), Previous Day’s Low (PDL)
▶Strong support/resistance zones often act as liquidity magnets.
▶When price revisits these areas and fails to break through, it gives us a clear rejection and that’s where the edge lies.
⚙️ Core Conditions
➡Price rejects PDH or PDL
➡Price retests a breakout / breakdown zone
➡Price rejects a tested support / resistance level
➡Timeframe: 15-Minute
➡Type of trade: Intraday only
➡Only one trade per day
🎯 Trade Plan
🔘Entry: One tick above/below the Pin Bar or reversal candle close
🔘Stop Loss: Just beyond the high/low of the rejection candle
🔘Target: Next liquidity zone (recent 15m swing or PDH/PDL)
🚫 Avoid Trading When:
➡No rejection at liquidity levels
➡Risk > 20 points
📊 October Backtest Results
(1 trade per day, tested manually)
Total trades taken= 14
Winners= 6
Losers= 8
Total points made out of winner= 263
Total points lost in losers= 75
Net points made= 188
🧠 Takeaway
Even though the backtest covers only October, the results are encouraging.
The logic is built on price behavior around institutional levels, and that tends to hold steady across time.
📈 Try extending the backtest further:
If results remain consistent, this could become a reliable rejection-based intraday setup worth adding to your toolkit.
Here is a visual to guide to all the Entries, Exits and about how it went.
Enjoy the charts and do let me know what you think about this strategy or if I missed an opportunity ;)
📣Disclaimer:
Everything shared here is meant for education and general awareness only. It’s not financial advice, nor a recommendation to buy, sell, or hold any asset. Do your own research, manage your risk, and make sure you understand what you’re getting into.
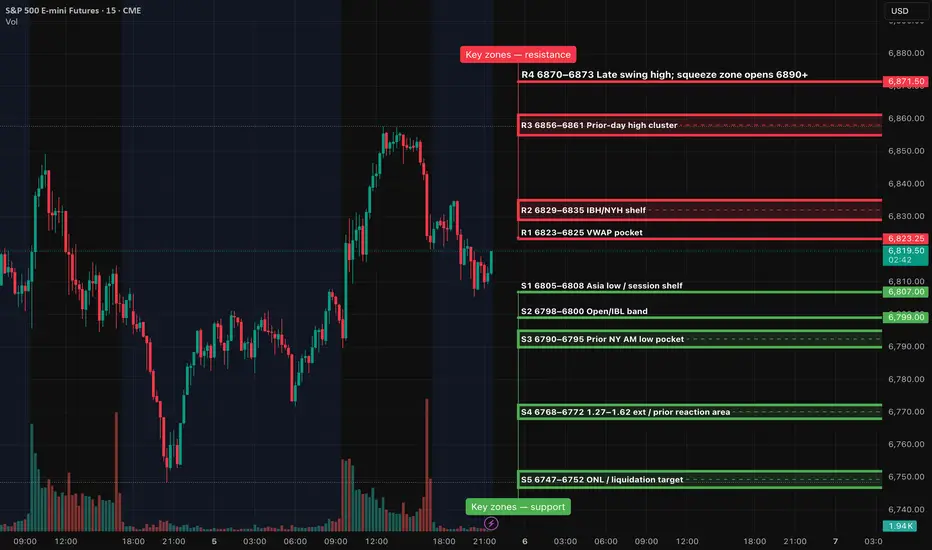
ES (SPX, SPY) Analysis, Key Zones, Setups for Thu (Nov 6)The daily trend has softened following the formation of a lower high. Analysis of the 4-hour chart indicates a bounce that encountered resistance near the 6860–6870 range, subsequently retreating to the 6810 support level. As we look ahead to tomorrow's trading, consider the 6805–6808 range as the key intraday “threshold” while the 6830–6835 zone will serve as the first significant resistance level to watch.
Setups (Level-KZ Protocol 15/5/1; NY KZ 09:30–11:00 & 13:30–16:00 ET)
1. Acceptance long from support
Trigger: 15m holds S1 6805–6808 → 5m reclaim 6823 VWAP → 5m close above 6830.
Entry: 6831–6834 on first 1m HL after the 5m re-close.
SL: 6821 (hard) or 15m trigger-wick −0.25–0.50 pt.
TP1: 6856–6861 (≥2R gate).
TP2: 6870–6873.
TP3: 6890–6895 if squeeze.
Management: No partials before TP1; at TP1 close 70%, set 30% runner to BE; no trail before TP2.
2. Rejection fade short from resistance
Trigger: Pop into 6856–6861, stall, then 5m full-body re-close back below 6856 with 1m LH.
Entry: 6850–6854.
SL: 6864.25 (hard) or 15m wick +0.25–0.50.
TP1: 6830–6832.
TP2: 6823 VWAP.
TP3: 6805–6808.
Note: If 5m re-claims 6861 after entry, exit early; setup invalid.
3. Breakdown continuation short
Trigger: 5m body close below 6805 with retest fail from beneath.
Entry: 6800–6803.
SL: 6810.75 (hard) or 15m wick +0.25–0.50.
TP1: 6790–6795.
TP2: 6768–6772.
TP3: 6747–6752.
Note: If reclaim and 5m closes back above 6808, cancel.
4. Breakout continuation long
Trigger: 5m acceptance above 6861 and hold on retest.
Entry: 6862–6865 on first 1m HL.
SL: 6853.25.
TP1: 6870–6873.
TP2: 6885–6890.
TP3: 6905–6912.
Note: If acceptance fails (5m body back under 6861), flip bias back to fade R3.
Event map for Thursday (ET)
FOMC meeting Day 1 (runs Thu–Fri; Fed is not affected).
EIA Weekly Natural Gas Storage 10:30.
Most BLS/DOL macro releases (e.g., Productivity & Costs, Weekly Jobless Claims) are suspended during the shutdown. Expect fewer 8:30 prints and thinner liquidity until the cash open.
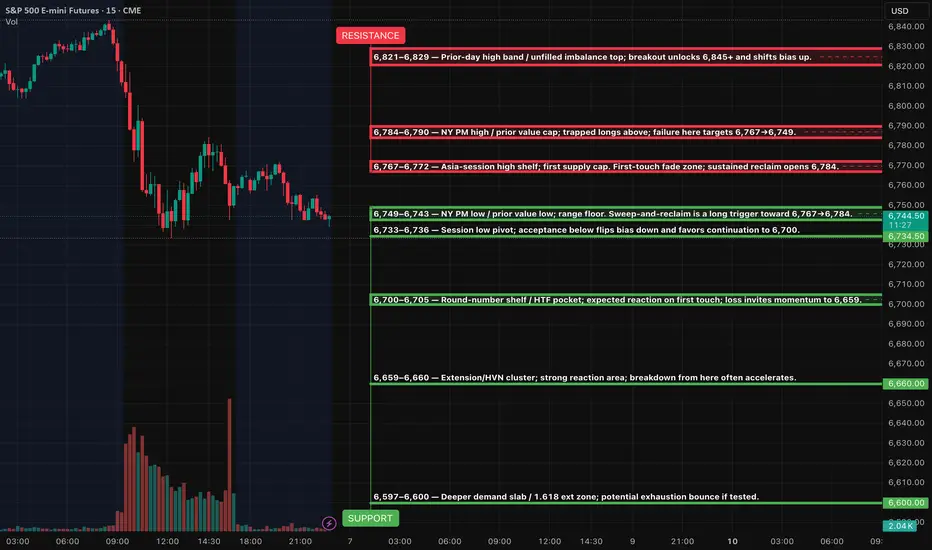
ES (SPX, SPY) Key Levels, Analysis and Setups for Fri (Oct 7th)EVENTS (ET, unaffected by shutdown): 3:00am NY Fed Williams speech; 7:00am Fed Vice Chair Jefferson speech; 10:00am Univ. of Michigan Consumer Sentiment (prelim); 2:00pm Fed G.19 Consumer Credit. Employment Situation report is postponed due to the shutdown (treat as no 8:30am print).
SETUPS (Level-KZ Protocol 15m→5m→1m)
ES LONG (A++) — 6,767 reclaim → 6,784 → 6,821
Entry: 6,768–6,772 after a 5m close and hold above 6,767 with 1m HL confirmation.
Hard SL: 6,755.
TP1: 6,784. TP2: 6,821. TP3: 6,845 if momentum persists.
ES SHORT (A++) — 6,784–6,790 pop-and-fail → 6,749 → 6,733
Entry: 6,782–6,789 on a 15m rejection close back inside the band followed by a 5m re-close down.
Hard SL: 6,796.
TP1: 6,767. TP2: 6,749. TP3: 6,733.
ES LONG (A+ Bounce) — 6,742–6,749 sweep & instant reclaim → 6,767 → 6,784
Entry: 6,750–6,753 after a swift reclaim and 1m HL.
Hard SL: 6,740.
TP1: 6,767. TP2: 6,784. TP3: 6,821.
ES SHORT (A+ Continuation) — 6,733 breakdown & retest → 6,700 → 6,659
Entry: 6,732–6,728 on 15m acceptance below 6,733 and a 5m LH retest.
Hard SL: 6,744.
TP1: 6,700. TP2: 6,659. TP3: 6,597.
KILL-ZONES & MANAGEMENT
Asia 20:00–00:00 optional and lighter size, London 02:00–05:00 optional, NY AM 09:30–11:00 primary for entries, Lunch 12:00–13:00 manage only, NY PM 13:30–16:00 allows second push or reversal plays. Daily guardrails: stop at −2R net or lock in ≥+3R net.
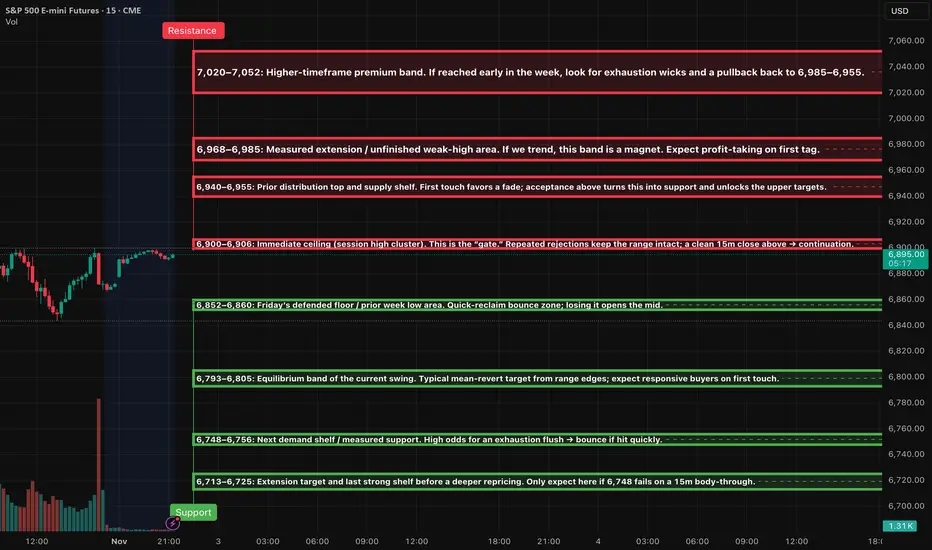
ES (SPX, SPY) Week Ahead Analysis, Nov 3rd - Nov 7thMarket Context
The price is currently positioned just below a key near-term resistance level at 6,900–6,906, following a sharp reversal on Friday from around 6,845. The daily and 4-hour structures indicate an incomplete "weak-high" area above, but the 1-hour momentum has just shifted upward from oversold conditions. As we move into the Asia/London sessions, I anticipate a balance formation within the upper half of the previous session unless we see a decisive 15-minute close above 6,906.
Short — Rejection Fade at 6,900–6,906
Trigger: 15m rejection close back below the band → 5m re-close down with a lower high → 1m first pullback fail.
SL: Above the 15m wick high +0.25–0.50.
TP1: 6,880 → 6,860 (≥2.0R gate). TP2: 6,805.
Notes: If a retest holds below 6,900, add on a fresh 1m LH.
Short — Rejection Fade at 6,940–6,955
Trigger: Same 15m→5m→1m sequence as above.
SL: Above the band’s 15m wick +0.25–0.50.
TP1: 6,900 gate; TP2: 6,880–6,860; stretch TP3: 6,805.
Long — Acceptance Continuation above 6,906
Trigger: 15m full-body close above 6,906 → 5m pullback holds and re-closes up → 1m HL entry.
SL: 5m pullback low −0.25–0.50.
TP1: 6,940–6,955; TP2: 6,968–6,985; stretch TP3: 7,020–7,052.
Notes: If 6,906 holds as support on retest, consider scaling on a clean 1m HL.
Long — Quick-Reclaim Bounce at 6,852–6,860
Trigger: Sweep/flush below the band and instant reclaim (1–3m), confirmed by a 5m re-close up → 1m HL entry.
SL: Below the sweep low −0.25–0.50.
TP1: 6,900 gate; TP2: 6,940–6,955.
Long — Quick-Reclaim Bounce at 6,793–6,805
Trigger: Same reclaim logic; prefer fast tag → quick pop.
SL: Below the 5m reclaim low −0.25–0.50.
TP1: 6,860; TP2: 6,900; optional TP3: 6,940.
Long — Exhaustion Flush Bounce at 6,748–6,756 (stretch 6,713–6,725)
Trigger: Fast liquidation into the band + momentum divergence → 5m reversal close → 1m HL entry.
SL: Below the exhaustion low −0.25–0.50.
TP1: 6,793–6,805; TP2: 6,860; trail only after TP2.
Short — Continuation Below 6,852
Trigger: 15m body-through below 6,852 that holds on retest → 5m LH → 1m pullback entry.
SL: Above the 15m break wick +0.25–0.50.
TP1: 6,805; TP2: 6,756; stretch TP3: 6,725.
KILL-ZONES & EXECUTION NOTES
Primary execution windows: NY AM 09:30–11:00 and NY PM 13:30–16:00. London 02:00–05:00 optional, reduced size. Asia optional, smallest size.
Stops & viability: Anchor hard SLs to the relevant 15m wick; only take plays where TP1 ≥ 2.0R. Max two attempts per level per session. At TP1: close 70%, set 30% runner to BE; no trailing before TP2.
WEEK AHEAD GAME PLAN
If Monday holds above 6,860 and forms a higher low, the outlook is modestly bullish, aiming for a move toward 6,940–6,955 early to mid-week. A decisive daily close above 6,955 would suggest a rally into the 6,968–6,985 range, with the potential to extend further to 7,020–7,052 later in the week.
Conversely, if the price falls back below 6,852, the scenario shifts to a mean-reversion week, targeting 6,805 and then 6,756, with 6,713 as a potential stretch target.
ES (SPX, SPY) Analysis, Levels, Setups for Wed (Nov 5th)News & timing (ET): ADP 8:15; ISM Services PMI 10:00; EIA Crude 10:30. Release status: all three are scheduled to run (not shutdown-affected).
Bias & context: Short-term trend remains lower after a sequence of 15m lower-highs/lows and failure to hold 6,793–6,805. Expect dip-buys to be sold unless 6,860+ is reclaimed and defended.
Overnight → NY forecast:
Base path: probe 6,748–6,756 into Asia/London, bounce to 6,793–6,805, then decide at NY open. Lose 6,748 on momentum and the magnet becomes 6,713–6,725.
Alt squeeze: reclaim and hold above 6,852–6,860, push to the 6,900–6,906 “gate”, then 6,940–6,955. Only above 6,955 can 6,968–6,985 and 7,020–7,052 come into play.
Bear extension: clean break and 15m body acceptance below 6,713–6,725 opens 6,660s (deeper extension) before any meaningful bounce.
Key-Zones
Resistance (top→bottom):
7,020–7,052 premium band (W3 major; first touch favors profit-taking)
6,968–6,985 measured-extension / weak-high pocket (W2)
6,940–6,955 prior distribution top / supply shelf (W2)
6,900–6,906 immediate ceiling “gate” (W2 pivotal)
Support (top→bottom):
6,852–6,860 defended floor / quick-reclaim bounce zone (W2)
6,793–6,805 swing-equilibrium magnet (W2)
6,748–6,756 next demand shelf / measured support (W2)
6,713–6,725 extension target and last strong shelf before deeper repricing (W3)
Setups (Level-KZ Protocol 15/5/1)
Rejection Fade (short): sell 6,852–6,860 or 6,900–6,906 after a 15m rejection close back inside → 5m re-close in your favor; use the 15m wick +0.25–0.50 pts as hard SL. TP1 = next opposing MAJOR level (e.g., 6,805 then 6,756).
Acceptance Continuation (long): only after a full-body 15m close above 6,860 and a 5m pullback that holds; target 6,900–6,906 → 6,940–6,955; invalidate on a 15m close back below 6,852.
Quick-Reclaim Bounce (Tier-2): flush into 6,748–6,756, instant reclaim on 1–5m, enter on first HL; TP1 = 6,793–6,805; invalidate on a 15m close back below the shelf.
Exhaustion Flush (Tier-3): if 6,748 breaks with force and a 15m body holds below, sell the first 1–5m LH; TP1 = 6,713–6,725; runner eyes 6,660s if momentum persists.
Risk & management (use consistently):
Instructions: only take a setup if TP1 ≥ 2.0R using the 15m-wick SL.
At TP1: close 70%, set 30% runner to BE; runner aims TP2 at the next major level.
No trailing before TP2. Time-stop 45–60m if neither TP1 nor SL hits. Max 2 attempts per level per session.
Kill-zones (ET): London 02:00–05:00 (optional ½–¾ size); NY AM 09:30–11:00 (primary); NY PM 13:30–16:00 (primary). Manage only 12:00–13:00.
What flips decision:
Bullish: sustained 15m acceptance above 6,860 then above 6,906 turns path toward 6,940–6,955 → 6,968–6,985.
Bearish: 15m acceptance below 6,748 invites 6,713–6,725; losing that level opens 6,660s before any notable bounce.

Week 11.03 - 11.07 Prep Last Week :
Last week we opened on a gap above Value and made a push over Edge top where we found our top and larger sellers for the week. Return to above VAL provided selling back into and eventually under the Edge. Holding under the Edge got us under MAs and changed the trend from uptrend to downtrend on 30m and 1h Time Frames, 2hr and 4hr frames only changed into correction without fully changing into downtrend. Holds under the Edge also provided good sells into lower VAH/Value for the gap fill towards end of the week when we got Month End profit taking but we were not able to fill the gap, instead we ran out of Supply Friday Midday and got end of the week short covering which drove price back out Value without filling the gap or staying in Value.
This Week :
So far this week we have again opened over Value and have been balancing between VAH and Edge in Globex, right now Edge again provided good sell back towards VAH and it may seem like it can continue selling but this will be the area to be careful at, at least to start the week as we are starting New Month, New week and it would be best to see what order flow we get, of course it is possible that we just continue lower right away but also this could be an area where we will see more covering above the Gap which can keep price over it and eventually once selling slows down could give another rotation towards/into and possible over the Edge.
As mentioned last week we are currently inside 915 - 875 +/- Intraday Range with 900 - 890 being its mean and price can stay within this range until it accepts under 870 - 65 areas without popping back over 75 then we know we have accepted in lower Intraday Range of 870 - 830 and can continue through its targets which would be 855 - 845 Mean area and down into/towards 830 - 20s. If we do hold this current range we are in then it is still possible that it will bring more buying as buyers like to start getting in once price holds which could still push us up towards/over the Edge and maybe even back towards above VAL, how far over Edge we get would be determined by order flow IF it happens but this will be the spots to be careful on the long side instead of getting excited for new ATH or continuation over previous one even if we take it out. Our bigger sellers will still be lurking over the Edge and closer to above VAL which means if we see a push out we could either see a quick or after consolidation return back under the Edge.
For price to change things back into stability or strength from here we would need a strong push over VAL with Medium/Larger MAs following behind us for support to be able to hold the price in/around new Value to show acceptance in New Hourly Range, unless this happens we have to keep thinking that top is in for now and look for return trips away from it which would make price want to return to previous Value.
If we do get strong selling continuation today/tomorrow through 70 - 65 and keep it under then of course we will go with that and keep targeting the Mean/Gap fill and push under the Mean but unless you see clear selling under 70 - 65 careful looking for too much continuation from here early on, it might take few days to decide what we will do and get ready for a good move into lower Value which maybe happen either from above the Edge or once we hold under it long enough and change trend on 2hr and 4hr Frames.

ES - November 6th - Daily Trade PlanNovember 6th- Daily Trade Plan - 6:25am
*Before reading this trade plan, IF, you did not read yesterdays, or the Weekly Trade Plan take the time to read it first! (You can see both posts in the related publication section) *
If my posts provide quality information that has helped you with your trading journey. Feel free to boost it for others to find and learn, also!
My daily trade plan and real-time notes that I post are intended for myself to easily be able to go back and review my plan and how I did from an execution perspective.
--------------------------------------------------------------------------------------------------------
Since we continue to chop around in this range between 6770-6850, I will not get into too much detail about yesterday's price action as you can take a look at my trade plan from yesterday and read through the notes and what my expectation were and levels, we had to execute the trade plan!
Today we have ADP Employment numbers, PMI & ISM with tomorrow being the Jobs Report!
Our overnight low is 6804 and our high is 6835. As of typing this plan, you can clearly see that we have made lower lows, and lower highs overnight, so far. We are in a tight 30 pt range and bigger picture, I have talked this week about how 6856-60 a big resistance. I have also stated that 6690-95 is our level that needs to hold to keep the bigger picture bull case intact.
I expect a lot of choppy/trapping today and tomorrow. IF price does clear 6870, we should run back to new highs. IF price loses 6750, my expectation is that we test 6719, 6680.
Until we clear 6870, the current trend is for price action to lose 6750 and create a new lower low.
Key Levels Today -
1. Loss of 6807 and reclaim
2. Loss of 6792 and reclaim
3. Loss of 6773 and reclaim
4. Loss of 6749 and reclaim
IF price clears 6835 (Overnight high) prior to 9:30am open, we could see some FOMO and chasing at the open. IF price does fall back into the overnight range, I would be careful as we could head lower.
Key Support Levels - 6823, 6807, 6792, 6773, 6765, 6758, 6750
Key Resistance Levels - 6835, 6843, 6849, 6857, 6867, 6873
Until price creates a higher high, I have to defer to the current micro trend which is the probability of price to continue lower.
I will post an update around 10am EST.
----------------------------------------------------------------------------------------------------------------
Couple of things about how I color code my levels.
1. Purple shows the weekly Low
2. Red shows the current overnight session High/Low (time of post)
3. Blue shows the previous day's session Low (also other previous day's lows)
4. Yellow Levels are levels that show support and resistance levels of interest.
5. White Levels are previous days session High/Low

ES - November 4th - Daily Trade PlanNovember 4th- Daily Trade Plan - 6:20am
*Before reading this trade plan, IF, you did not read yesterdays, or the Weekly Trade Plan take the time to read it first! (You can see both posts in the related publication section) *
If my posts provide quality information that has helped you with your trading journey. Feel free to boost it for others to find and learn, also!
My daily trade plan and real-time notes that I post are intended for myself to easily be able to go back and review my plan and how I did from an execution perspective.
--------------------------------------------------------------------------------------------------------
Yesterday we had some great levels that hit and followed through. I stated in my trade plan that "IF we lose, 6843, we will probably flush pretty quickly lower"
Overnight we saw this and our overnight low is 6785 and high is 6882. That is about a 100pt move overnight. I have mentioned many times that the bigger picture trend is up and that would not change unless we lose 6690. We have to respect the trend and look for prices to move higher. When we get a nice sell off like we have overnight, we need to retest the levels above and see if we can continue higher. Bears are fully in control and until 6918 is retaken, we have to expect selling on any back tests of higher prices.
Key Levels Today -
1.Loss of 6812 and reclaim (Micro level reclaim)
2. Loss of 6785 and reclaim
3. Loss of 6801 and reclaim (IF 6785 is the low for the day, this might be the best spot to grab points before it moves higher)
4. Below the overnight low and 6776 and reclaim is next level lower of interest
5. Loss of 6767 and reclaim
Key Support Levels - 6812, 6801, 6792, 6785, 6776, 6773, 6767
Key Resistance Levels - 6824, 6830, 6837, 6843, 6849, 6862-65
My general lean today is that we can back test 6843, 6862-65. I will be looking for a pullback to 6801 level and reclaim to grab some points. The only other option will be looking for a base to be built at one of the levels in yellow and create a strong support that provides an opportunity to enter long for a level-to-level move. 6824 resistance is a good spot to long for a move up the levels. It could be a tricky level to engage as it will probably take a few attempts to clear. Once it clears, it should move quickly up the levels to back test 6843, 6862-65.
I will post an update around 10am EST.
----------------------------------------------------------------------------------------------------------------
Couple of things about how I color code my levels.
1. Purple shows the weekly Low
2. Red shows the current overnight session High/Low (time of post)
3. Blue shows the previous day's session Low (also other previous day's lows)
4. Yellow Levels are levels that show support and resistance levels of interest.
5. White shows the trendline from the August lows

ES - November 3rd - Daily Trade PlanNovember 3rd - Daily Trade Plan - 7:15am
*Before reading this trade plan, IF, you did not read yesterdays, or the Weekly Trade Plan take the time to read it first! (You can see both posts in the related publication section) *
If my posts provide quality information that has helped you with your trading journey. Feel free to boost it for others to find and learn, also!
My daily trade plan and real-time notes that I post are intended for myself to easily be able to go back and review my plan and how I did from an execution perspective.
--------------------------------------------------------------------------------------------------------
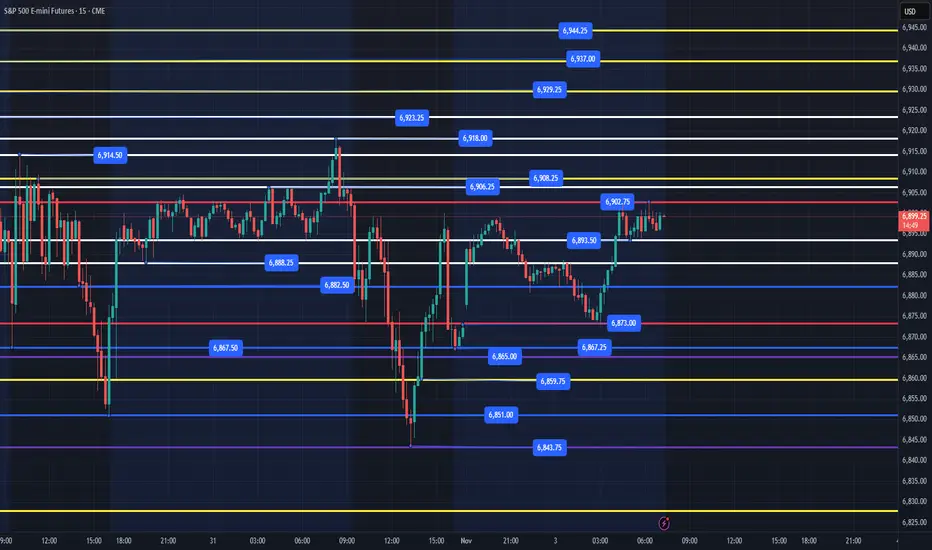
Last week price took out the prior week's low of 6865 and finished the day right at 6867. We gapped up last night and our overnight high is 6902 and our low is 6873 and closed the gap from the Sunday evening open. We still have a gap to be filled from last Sunday's open around 6824 area.
Price is currently building a nice base at the 6893 level, and this is the same level that we had on Friday that broke out and then we sold off after the open. We can see that we have a lower low from Friday at 6843 and 6918 is the high. Technically, price needs to reclaim 6918 to continue higher.
Key Levels Today -
1. Loss of 6893 and reclaim
2. Loss of 6882 and reclaim
3. Loss of 6873 and reclaim
4. Loss of 6867 and reclaim
5. Loss of 6851 and reclaim
6. Loss of 6843 and reclaim
Below these levels and we will probably be selling off pretty hard, and I would probably let price find a support level below and build a base to move higher.
Key Support Levels - 6893, 6888, 6882, 6873, 6867, 6859, 6851, 6843
Key Resistance Levels - 6902, 6908, 6914, 6918, 6923, 6930, 6944, 6953
As of writing this post, 6893 has been building a nice base that should give us a move higher, any price action that clears 6902 prior to 9:30am open, and then can't hold that level, we should expect price to potentially move lower.
Let's see what happens at the open, but my general lean is that IF price can clear 6918, it should give us higher prices in the coming days. IF we lose, 6843, we will probably flush pretty quickly lower.
I will post an update around 10am EST.
----------------------------------------------------------------------------------------------------------------
Couple of things about how I color code my levels.
1. Purple shows the weekly Low
2. Red shows the current overnight session High/Low (time of post)
3. Blue shows the previous day's session Low (also other previous day's lows)
4. Yellow Levels are levels that show support and resistance levels of interest.
5. White shows the trendline from the August lows
ES - November 5th - Daily Trade PlanNovember 5th- Daily Trade Plan - 6:30am
*Before reading this trade plan, IF, you did not read yesterdays, or the Weekly Trade Plan take the time to read it first! (You can see both posts in the related publication section) *
If my posts provide quality information that has helped you with your trading journey. Feel free to boost it for others to find and learn, also!
My daily trade plan and real-time notes that I post are intended for myself to easily be able to go back and review my plan and how I did from an execution perspective.
--------------------------------------------------------------------------------------------------------
I wrote yesterday "My general lean today is that we can back test 6843, 6862-65. I will be looking for a pullback to 6801 level and reclaim to grab some points. The only other option will be looking for a base to be built at one of the levels in yellow and create a strong support that provides an opportunity to enter long for a level-to-level move. 6824 resistance is a good spot to long for a move up the levels. It could be a tricky level to engage as it will probably take a few attempts to clear. Once it clears, it should move quickly up the levels to back test 6843, 6862-65."
Institutions were buying at the 6800 level between 8:30am-9:30am and we flushed down to 6786, reclaimed and then went higher and back tested to 6849 and then started to sell off in the afternoon. This is a typical bear market type of price action where price is being sold into strength, and we continue to make lower lows and lower highs. I would get used this type of price action as we could continue to see this over the coming months.
----------------------------------------------------------------------------------------------------------
Overnight low is 6749 and the high is 6807 with 6800 being heavy resistance that needs to clear for us to continue up the levels. IF price does head higher, we should test 6810, 6823. Technically IF price wants to continue higher, we need to clear 6849.
IF price does not clear 6800 and we lose 6749, we will need to see if price can react at 6734 or lose 6719 and reclaim to back test 6750 and potentially try to go higher.
I have said over the past few weeks that we have to remain bullish unless we lose the 6690 level. Last week we closed at the prior week lows and so far, we are trending to potentially do the same this week if price can hold 6690.
Key Levels Today -
1. Loss of 6775 and reclaim (This has been tested as I write this post, so will be weaker on next attempt)
2. Loss of 6765 and reclaim
3. Loss of 6758 and reclaim
4. Loss of 6749 and reclaim (Overnight Low)
5. Loss of 6734 and reclaim
6. Loss of 6719 and reclaim
Below these levels and I don't get very interested until 6690-95.
Key Support Levels - 6775, 6765, 6758, 6749, 6734, 6726, 6719
Key Resistance Levels - 6786, 6800, 6807, 6816, 6823, 6831, 6843, 6849
Until price creates a higher high, I have to defer to the current micro trend which is the probability of price to continue lower.
I will post an update around 10am EST.
----------------------------------------------------------------------------------------------------------------
Couple of things about how I color code my levels.
1. Purple shows the weekly Low
2. Red shows the current overnight session High/Low (time of post)
3. Blue shows the previous day's session Low (also other previous day's lows)
4. Yellow Levels are levels that show support and resistance levels of interest.
5. White shows the trendline from the August lows

ES - November 7th - Daily Trade PlanNovember 7th- Daily Trade Plan - 7:50am
*Before reading this trade plan, IF, you did not read yesterdays, or the Weekly Trade Plan take the time to read it first! (You can see both posts in the related publication section) *
If my posts provide quality information that has helped you with your trading journey. Feel free to boost it for others to find and learn, also!
My daily trade plan and real-time notes that I post are intended for myself to easily be able to go back and review my plan and how I did from an execution perspective.
--------------------------------------------------------------------------------------------------------
Overnight low is 6715 and high is 6771. We have continued to create lower lows and as I have mentioned all week, we are getting close to the 6690 bigger trend breakdown. I do think today we have some good levels to grab some points and could produce a nice short squeeze.
Key Levels Today -
1. Loss of 6715 and reclaim
2. Loss of 6703 and reclaim
3. Loss of 6696 and reclaim
4. Loss of 6690 (maybe down to 6683 and reclaim).
Key Support Levels - 6711, 6703, 6696, 6690, 6683, 6675, 6666
Key Resistance Levels - 6726, 6732, 6742, 6749, 6755, 6766, 6771
Until price creates a higher high, I have to defer to the current micro trend which is the probability of price to continue lower. IF we lose 6690 and cannot reclaim 6785, we could melt down next week.
I will post an update around 10am EST.
----------------------------------------------------------------------------------------------------------------
Couple of things about how I color code my levels.
1. Purple shows the weekly Low
2. Red shows the current overnight session High/Low (time of post)
3. Blue shows the previous day's session Low (also other previous day's lows)
4. Yellow Levels are levels that show support and resistance levels of interest.
5. White Levels are previous days session High/Low

AMP Futures - Multi-Session profiles in TPO ChartsIn this idea we will demonstrate how to create Multi-Session profiles with TPO Charts using the Tradingview platform.

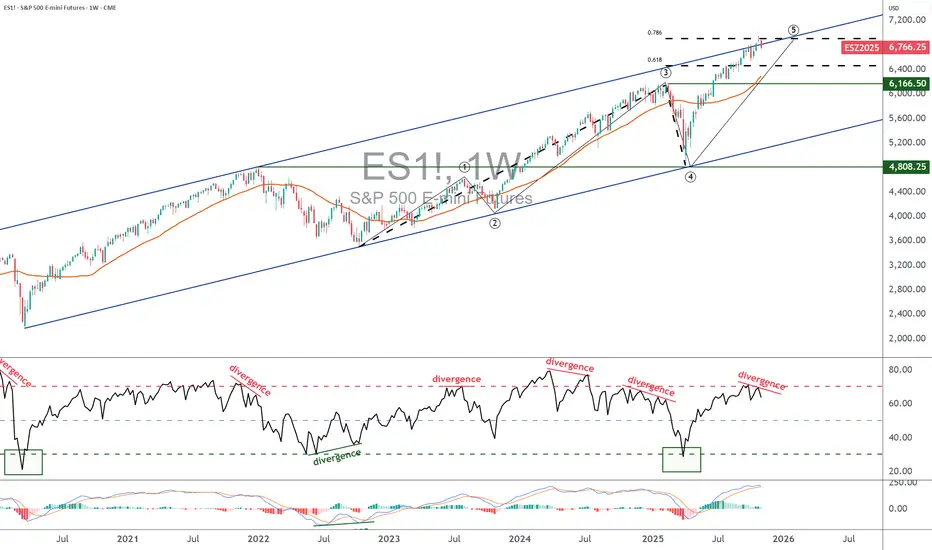
S&P 500 (ES1!): Bullish! Buy This Dip!Welcome back to the Weekly Forex Forecast for the week of Nov. 3 - 7th.
In this video, we will analyze the following FX market: S&P 500 (ES1!)
The S&P500 is bullish, and buys are valid.
Price is currently in a +FVG, so looking for sells is prohibited!
If the +FVG fails, only then will buys become invalid.
Enjoy!
May profits be upon you.
Leave any questions or comments in the comment section.
I appreciate any feedback from my viewers!
Like and/or subscribe if you want more accurate analysis.
Thank you so much!
Disclaimer:
I do not provide personal investment advice and I am not a qualified licensed investment advisor.
All information found here, including any ideas, opinions, views, predictions, forecasts, commentaries, suggestions, expressed or implied herein, are for informational, entertainment or educational purposes only and should not be construed as personal investment advice. While the information provided is believed to be accurate, it may include errors or inaccuracies.
I will not and cannot be held liable for any actions you take as a result of anything you read here.
Conduct your own due diligence, or consult a licensed financial advisor or broker before making any and all investment decisions. Any investments, trades, speculations, or decisions made on the basis of any information found on this channel, expressed or implied herein, are committed at your own risk, financial or otherwise.

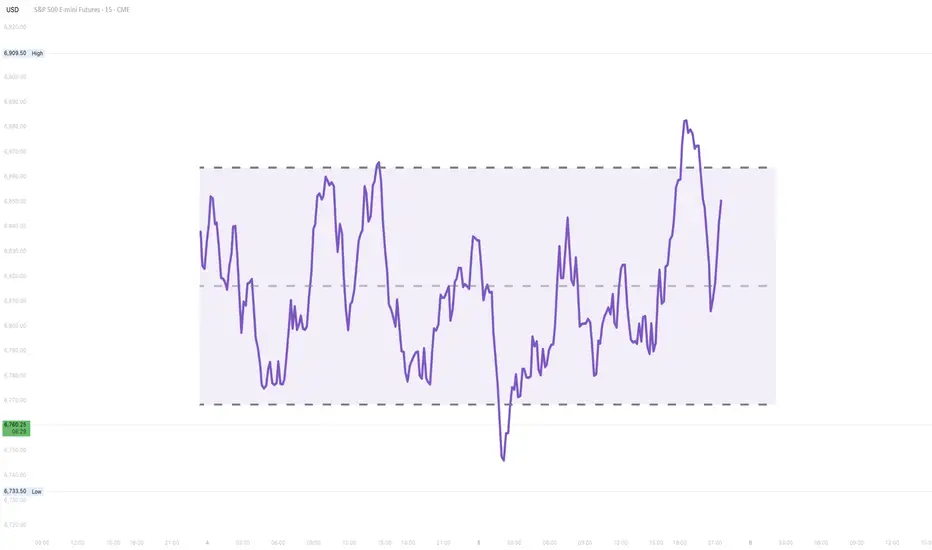
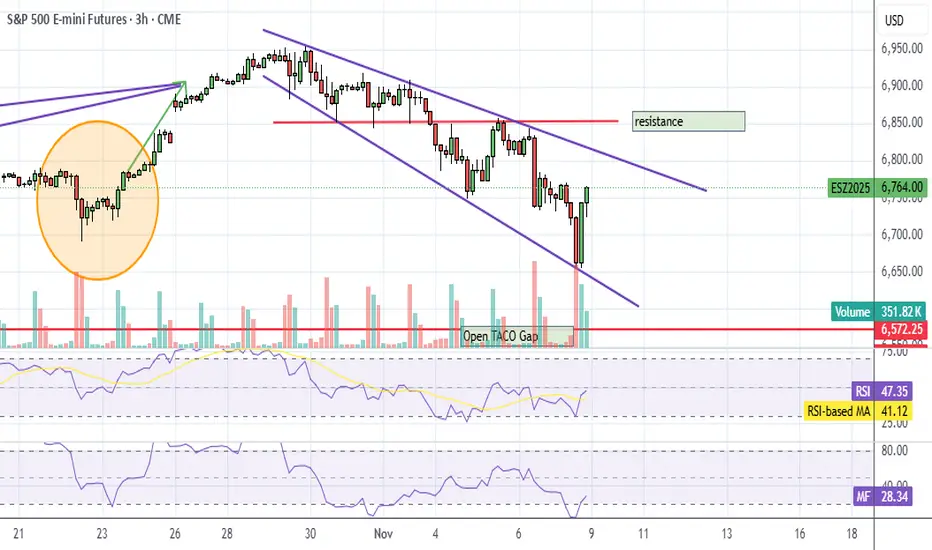
ES Update - Breakout backtestSorry that I'm fixated on the TACO gap a little too much, I realized that this drop isn't about the TACO drop, it's back testing the breakout, which is pretty typical, it did the same last year on the election news. Especially considering it broke out on fake news, lol.
So market probably open right here at the line and decides whether to tank or go up. Seeing that there's an open gap above for NQ, I'm guessing up.
The back test has to happen during actual market hours, so I'm thinking the market opens up somewhere in this area.

Two fundamental charts that call for cautionAfter several months of almost uninterrupted gains in U.S. equity markets, certain sentiment and positioning indicators suggest that a mature phase of the bullish cycle has now been reached. Two recent charts, published respectively by BofA Global Research and Real Investment Advice, clearly illustrate this state of moderate euphoria, which warrants a more cautious approach.
The first chart, taken from the BofA Global Fund Manager Survey (FMS), shows that the average level of cash held by major institutional managers has fallen to 3.8% of assets under management, a cycle low. Historically, such low cash levels indicate high risk-taking and strong confidence in the market’s continued rise. BofA notes that a cash level of 3.7% or less constitutes a “sell” signal in their framework, as it suggests professional investors have little remaining dry powder to buy in case of a correction. In other words, the market’s “marginal buying power” is now limited.
The second chart, published by Real Investment Advice, highlights the evolution of margin debt in the U.S.—the money borrowed by investors to buy stocks on credit, in other words, leverage. It currently sits at exceptionally high levels, far above its 48-month moving average. Every past episode of excessive margin debt—during the 2000 dot-com bubble, the 2008 financial crisis, or the 2021 speculative mini-cycle—was followed by a sometimes brutal normalization phase. These periods do not necessarily mark the start of a bear market but often signal a heightened vulnerability to any negative economic, geopolitical, or financial news.
The combination of these two signals—fully invested managers and massive use of leverage—reflects an environment of extreme confidence. Such a configuration is common at the end of bullish cycles: investors seek to capture the last gains of a rally, but the slightest disappointment can trigger quick profit-taking.
Without announcing an imminent reversal, these indicators call for prudent management: reassessing exposure to risky assets, strengthening diversification, and keeping cash available to seize potential opportunities during pullbacks.
DISCLAIMER:
This content is intended for individuals who are familiar with financial markets and instruments and is for information purposes only. The presented idea (including market commentary, market data and observations) is not a work product of any research department of Swissquote or its affiliates. This material is intended to highlight market action and does not constitute investment, legal or tax advice. If you are a retail investor or lack experience in trading complex financial products, it is advisable to seek professional advice from licensed advisor before making any financial decisions.
This content is not intended to manipulate the market or encourage any specific financial behavior.
Swissquote makes no representation or warranty as to the quality, completeness, accuracy, comprehensiveness or non-infringement of such content. The views expressed are those of the consultant and are provided for educational purposes only. Any information provided relating to a product or market should not be construed as recommending an investment strategy or transaction. Past performance is not a guarantee of future results.
Swissquote and its employees and representatives shall in no event be held liable for any damages or losses arising directly or indirectly from decisions made on the basis of this content.
The use of any third-party brands or trademarks is for information only and does not imply endorsement by Swissquote, or that the trademark owner has authorised Swissquote to promote its products or services.
Swissquote is the marketing brand for the activities of Swissquote Bank Ltd (Switzerland) regulated by FINMA, Swissquote Capital Markets Limited regulated by CySEC (Cyprus), Swissquote Bank Europe SA (Luxembourg) regulated by the CSSF, Swissquote Ltd (UK) regulated by the FCA, Swissquote Financial Services (Malta) Ltd regulated by the Malta Financial Services Authority, Swissquote MEA Ltd. (UAE) regulated by the Dubai Financial Services Authority, Swissquote Pte Ltd (Singapore) regulated by the Monetary Authority of Singapore, Swissquote Asia Limited (Hong Kong) licensed by the Hong Kong Securities and Futures Commission (SFC) and Swissquote South Africa (Pty) Ltd supervised by the FSCA.
Products and services of Swissquote are only intended for those permitted to receive them under local law.
All investments carry a degree of risk. The risk of loss in trading or holding financial instruments can be substantial. The value of financial instruments, including but not limited to stocks, bonds, cryptocurrencies, and other assets, can fluctuate both upwards and downwards. There is a significant risk of financial loss when buying, selling, holding, staking, or investing in these instruments. SQBE makes no recommendations regarding any specific investment, transaction, or the use of any particular investment strategy.
CFDs are complex instruments and come with a high risk of losing money rapidly due to leverage. The vast majority of retail client accounts suffer capital losses when trading in CFDs. You should consider whether you understand how CFDs work and whether you can afford to take the high risk of losing your money.
Digital Assets are unregulated in most countries and consumer protection rules may not apply. As highly volatile speculative investments, Digital Assets are not suitable for investors without a high-risk tolerance. Make sure you understand each Digital Asset before you trade.
Cryptocurrencies are not considered legal tender in some jurisdictions and are subject to regulatory uncertainties.
The use of Internet-based systems can involve high risks, including, but not limited to, fraud, cyber-attacks, network and communication failures, as well as identity theft and phishing attacks related to crypto-assets.
Successful Forex Trading1. Understanding the Forex Market
The forex market operates 24 hours a day, five days a week, across major financial centers like London, New York, Tokyo, and Sydney. Currencies are traded in pairs such as EUR/USD, GBP/JPY, or USD/INR, where one currency is bought while the other is sold.
Forex prices fluctuate due to various factors—economic indicators, geopolitical events, interest rate changes, and global demand for currencies. A successful trader understands that the forex market is influenced by both technical and fundamental dynamics.
2. The Foundation: Education and Knowledge
Knowledge is the backbone of successful forex trading. Before risking money, traders must learn how the market works, understand price action, and study trading tools. Beginners should grasp basic concepts such as:
Pips and lots: The smallest unit of price movement and standard trade size.
Leverage and margin: Borrowed capital that amplifies both profits and losses.
Bid-ask spread: The difference between the buying and selling price.
Stop-loss and take-profit: Tools to manage risk and lock in gains.
Reading books, taking courses, and following reliable market news sources like Bloomberg or Reuters can help traders stay informed. Continuous learning is vital, as market conditions and trading technologies evolve rapidly.
3. Developing a Solid Trading Strategy
A well-defined trading strategy is what separates successful traders from impulsive gamblers. Strategies can be short-term (scalping, day trading) or long-term (swing trading, position trading). Some of the popular trading strategies include:
Trend following – Identifying and trading in the direction of the market’s momentum.
Breakout trading – Entering trades when price moves beyond key resistance or support levels.
Range trading – Buying at support and selling at resistance during sideways markets.
News trading – Capitalizing on price volatility during major economic releases.
A successful trader tests strategies through backtesting (using historical data) and demo trading (using virtual money). This builds confidence before risking real funds.
4. Mastering Technical Analysis
Technical analysis helps traders forecast future price movements based on historical data. It involves studying charts, patterns, and indicators. Commonly used tools include:
Moving Averages (MA): To identify trends and smooth price fluctuations.
Relative Strength Index (RSI): To detect overbought or oversold market conditions.
Fibonacci Retracements: To identify potential reversal levels.
Candlestick Patterns: To reveal market sentiment through price behavior.
Technical analysis is most effective when combined with risk management and market psychology, rather than used in isolation.
5. Importance of Fundamental Analysis
While technical analysis focuses on charts, fundamental analysis examines the economic and political forces behind currency movements. Key indicators include:
Interest rates – Currencies with higher interest rates tend to attract more investors.
Inflation and GDP data – Indicate economic health and purchasing power.
Employment reports – Such as U.S. Non-Farm Payrolls, which can cause sharp volatility.
Geopolitical stability – Political crises can weaken a nation’s currency.
Successful traders often blend both technical and fundamental analysis to make informed trading decisions.
6. Risk Management: Protecting Capital
No matter how skilled a trader is, losses are inevitable. The key is to control risk so one bad trade doesn’t wipe out the account. Effective risk management includes:
Position sizing – Risking only 1–2% of trading capital per trade.
Stop-loss orders – Automatically closing trades at a predetermined loss level.
Diversification – Avoiding concentration in a single currency pair.
Avoiding over-leverage – High leverage amplifies both gains and losses.
Successful forex traders focus more on capital preservation than on quick profits. As the saying goes, “Take care of your losses, and profits will take care of themselves.”
7. The Psychology of Trading
Emotions are a trader’s biggest enemy. Fear and greed often lead to irrational decisions, like exiting trades too early or chasing losing positions. To succeed, traders must cultivate:
Discipline: Stick to the trading plan and rules consistently.
Patience: Wait for high-probability setups rather than forcing trades.
Confidence: Trust in analysis and avoid self-doubt after losses.
Emotional control: Accept losses as part of the process.
Maintaining a trading journal helps track performance, recognize emotional triggers, and improve over time.
8. Using Technology and Trading Tools
In today’s digital era, technology plays a massive role in forex trading success. Platforms like MetaTrader 4/5, cTrader, or TradingView offer real-time data, charting tools, and automated trading options.
Successful traders also use:
Economic calendars to track important news events.
Algorithmic trading systems for consistent execution.
VPS hosting to reduce latency for automated strategies.
Staying updated with fintech innovations gives traders a competitive edge in execution speed and market insight.
9. Continuous Improvement and Adaptation
The forex market is dynamic—strategies that worked yesterday may not work tomorrow. Therefore, traders must constantly adapt. Successful forex traders regularly:
Review past trades to learn from mistakes.
Refine strategies based on changing volatility or trends.
Stay updated on global economic developments.
Seek mentorship or community support to exchange insights.
Flexibility and adaptability ensure that traders survive both bullish and bearish cycles.
10. Building Long-Term Success
Successful forex trading is not about overnight riches—it’s about consistency, patience, and growth. The most successful traders:
Focus on steady returns rather than big wins.
Maintain discipline in both winning and losing streaks.
Keep records of all trades for analysis.
Continue to learn, adapt, and evolve with the market.
They treat trading as a business, not a hobby—an enterprise requiring planning, analysis, and emotional balance.
Conclusion
Success in forex trading is a journey that combines knowledge, discipline, strategy, and self-control. It’s not about predicting every market move but about managing risks and maximizing opportunities. A trader who focuses on education, follows a tested strategy, controls emotions, and practices sound risk management can thrive in the volatile world of forex.
The essence of successful forex trading lies in one rule: “Trade smart, not hard.” With persistence, patience, and proper planning, anyone can achieve consistent profitability and long-term success in the global forex market.


Understanding Money Flow Index In TradingMoney Flow Index (MFI) is a volume-weighted oscillator (0–100) that blends price and volume to show where real buying or selling pressure is building. By comparing positive vs. negative money flow from the Typical Price ((H+L+C)/3) and volume, MFI acts like a volume-aware RSI .
Traders use it to spot overbought/oversold zones (commonly >80/<20), confirm trend regimes around the 50 line, and catch divergences that often precede reversals. It’s simple, fast, and works across stocks, crypto, and FX—best used with a clear market structure and disciplined risk management.
1) Why is MFI important in trading?
MFI blends price and volume into a single oscillator, helping you spot exhaustion, confirm trends, and catch divergences earlier than price-only tools. Think of it as a volume-weighted RSI that validates whether a move is backed by real participation.
Captures “true” buying/selling pressure via volume.
Flags overbought/oversold zones more selectively than RSI.
Great for divergences, regime reads, and pullback timing.
2) MFI Components
Typical Price (TP): (High + Low + Close) / 3
Raw Money Flow (RMF): TP × Volume
Positive/Negative MF: Sum RMF on up-TP vs down-TP bars
Money Flow Ratio (MFR): PMF / NMF
MFI Line (0–100): RSI-style transform of MFR
Default length: 14 (common, tweakable)
3) MFI Formula
//@version=5
// Formula sketch (not an executable script)
TP_t = (high + low + close) / 3
RMF_t = TP_t * volume
// Over N bars:
PMF = sum( RMF_t where TP_t > TP_{t-1} )
NMF = sum( RMF_t where TP_t < TP_{t-1} )
// If TP_t == TP_{t-1}, ignore bar
MFR = PMF / NMF
MFI = 100 - (100 / (1 + MFR))
4) Interpreting MFI signals
Here’s how to read the line like a pro.
Zones: Overbought > 80 (extreme > 90), Oversold < 20 (extreme < 10)
Divergences: Bearish = price HH while MFI LH; Bullish = price LL while MFI HL
Midline/Regimes: Above 50 favors bulls; below 50 favors bears
Failure swings: Overbought → pullback → lower MFI high while price retests = caution
5) Trend & Momentum Analysis
Use MFI to confirm trend strength and quality.
Bullish ranges: MFI oscillates ~40–90 in uptrends; 50 often holds on dips
Bearish ranges: MFI oscillates ~10–60; rallies stall near 50–60
Momentum bursts: Fast pushes into 80–90 after consolidation often precede breakouts
Multi-timeframe: Align higher-TF MFI regime (e.g., 1D) with lower-TF entries (e.g., 1H)
6) MFI-Based Trading Strategies
Practical, testable rules you can refine.
A) Mean Reversion (Counter-Trend)
Entry: MFI < 20 → bullish reversal candle or break of minor swing high
Invalidation: Below the setup candle’s low or last swing low
Exits: MFI back to 50–60, or retest of VWAP/mid-channel
B) Breakout Confirmation
Precondition: Sideways range, contracting volatility
Trigger: Close outside the range and MFI > 55–60 (or spike > 80)
Exits: Trail behind structure/ATR; partials at measured move of the range
C) Trend Pullback Buy
Context: Uptrend with MFI mostly > 50
Entry: Pullback drives MFI into 40–50 then curls up; enter on HH/HOC close
Exits: Prior high, Fib extensions, or when MFI loses 50 again
D) Divergence Reversal
Trigger: Clear price/MFI divergence + break of a micro trendline or last swing
Risk: Tight stop past divergence origin
Targets: Midline 50 first, then opposing extreme 80/20
Confluence ideas: Pair with RSI, OBV, Bollinger Bands, or Volume Profile; require session/time filters for intraday assets.
7) Limitations of MFI
Know where it can mislead you.
Strong trends can pin MFI at extremes (overbought can stay overbought).
Volume quality matters (tick volume ≠ , centralized exchange volume).
Parameter sensitivity: too short = noise; too long = lag.
Data irregularities (thin books, outages, rollovers) can skew readings.
8) Optimization
Smart tweaks that actually help in live markets.
Dynamic Zones: Replace fixed 80/20 with rolling percentiles (e.g., 90th/10th of last 252 bars).
Adaptive Length: Tie MFI length to ATR/realized vol to reduce whipsaws.
Session Filters: Act only during liquid sessions; avoid lunch hours/illiquid opens.
Walk-Forward Testing: Validate across regimes; don’t overfit one market.
Risk First: Size by ATR; plan partials; use time-based exits to avoid stagnation.
9) Key Takeaways
Wrapping it up with what matters most.
MFI is a volume-aware oscillator that improves on RSI in participation-heavy moves.
Use 50 as a regime filter; use 80/20 (or dynamic zones) for edges.
Best signals: divergences, trend-pullback resets, and breakouts with MFI thrust.
Respect limitations: trends can pin MFI; validate with structure and clear risk controls.
Optimize with percentile zones, adaptive lengths, and session filters—then forward-test.
ES UpdateMy 3 hr indicator worked perfectly today. MFI was oversold so I flipped all of my puts on open, then I bought calls in the afternoon. I waited a bit longer than I needed to, I wanted to confirm that MFI was moving back up which indicates that the algos are going to pump futures.
This selloff has a strange downward megaphone pattern, if we break through the purple line Monday then the selloff is over. I still expect a midweek dip when MFI gets overbought.
ES UpdateI didn't trade today because of a hangover, lol.
Seems kinda weird that there was a resistance midday, you typically don't see resistance in the indices. EOD drop kept me from buying anything in the afternoon.
Futures are slightly red, MFI will probably get overbought before open tomorrow. In other words, don't buy the dip tomorrow. Appears Japan is resuming the selloff.
