ES UpdateIs the melt up over? I dunno, probably staying out at least another day. Trying to avoid the whipsaw.
The problem with a melt up is that indicators won't tell you when it's gonna be over. What I can tell you is that the gap from last week filled, as expected.
I don;t think I want to go long unt
Related futures

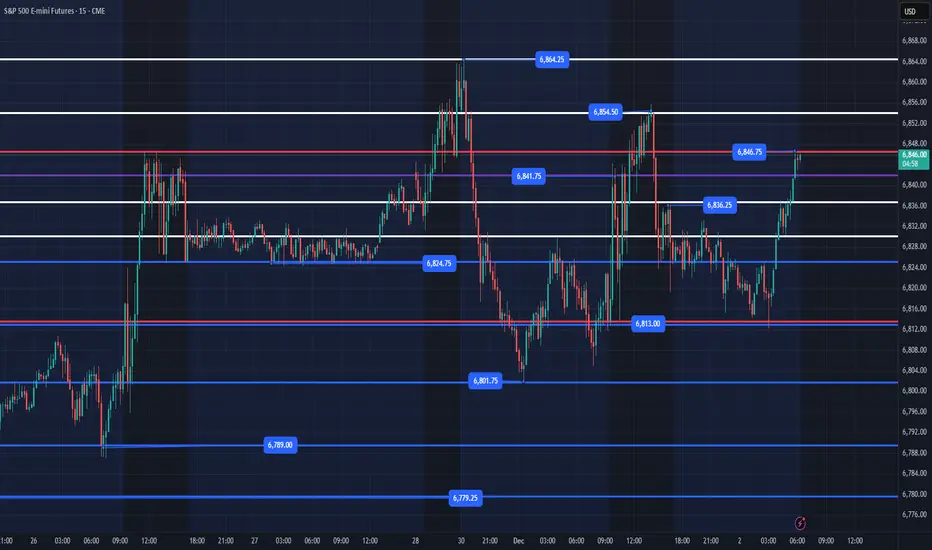
ES - December 2nd - Daily Trade PlanDecember 2nd- Daily Trade Plan - 6:20am
*Before reading this trade plan, if you did not read yesterday's take the time to read it first! (You can view the posts in the related publication section) *
If my posts provide quality information that has helped you with your trading journey. Feel free to
here is the clean price action i am short on this till yesterday mid day !! trade setup is up !! everything is alligned now just go for the short
S&P Futures Trading Day 77 — Locking Gains in a Scary MarketEnded the day +$247.39 trading S&P Futures. I came into the session with a bullish bias thanks to the market structure, and initially, things looked great as I caught a nice move breaking over the 1-minute MOB. However, the market had some tricks up its sleeve—I got stop-hunted trying to play the br

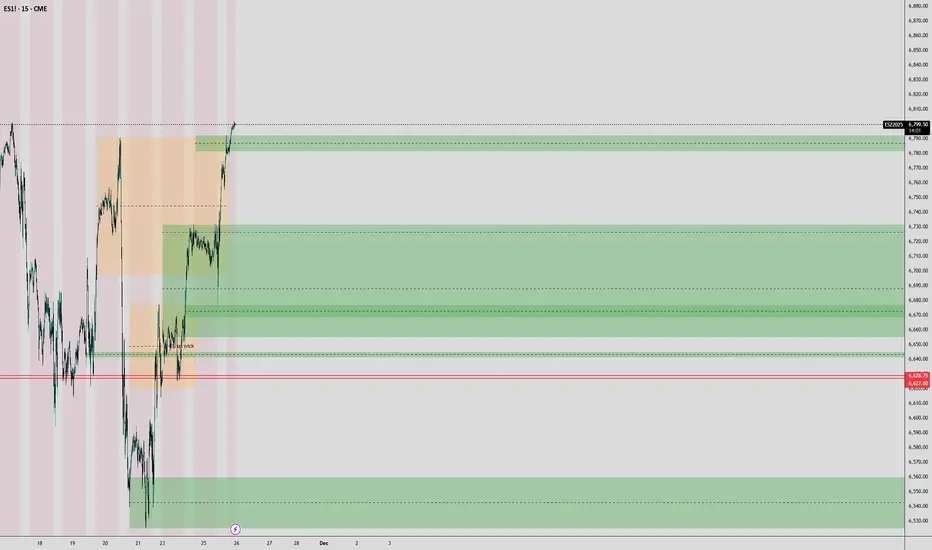
ES (SPX, SPY) Deep Analyses for Upcoming Week (Dec 1st - 5th)Multi-Timeframe Market Structure Analysis
Weekly Trend Overview
The E-mini S&P 500 (ES) continues to reflect a robust bullish trend on the weekly chart, characterized by a series of higher highs and higher lows. The most recent swing low is situated in the mid-6,500s, while prices are currently
ES UpdateIndicators still show a melt up, but there's a gap below and usually the market has a red day after a holiday pump week, so watch out for Monday.
Opted to sell my GLD calls and going cash for the weekend.
It's usually not a good idea to place any trades on a half day anyways.

ES (SPX, SPY) Analysis, Levels, Setups for Tue (Dec 2nd)The market structure remains optimistic on the higher timeframes, bolstered by a significant rebound from the 6,520 levels. Currently, prices are fluctuating in the upper range of this move, consolidating between the intraday support and the previous weekly high. Although momentum indicators are str
ES Gap AlertIndex futures all threw a gap up on the Thanksgiving break. If it doesn't fill Friday, it'll probably fill Monday.
Don't recommend going long on the half day trading.

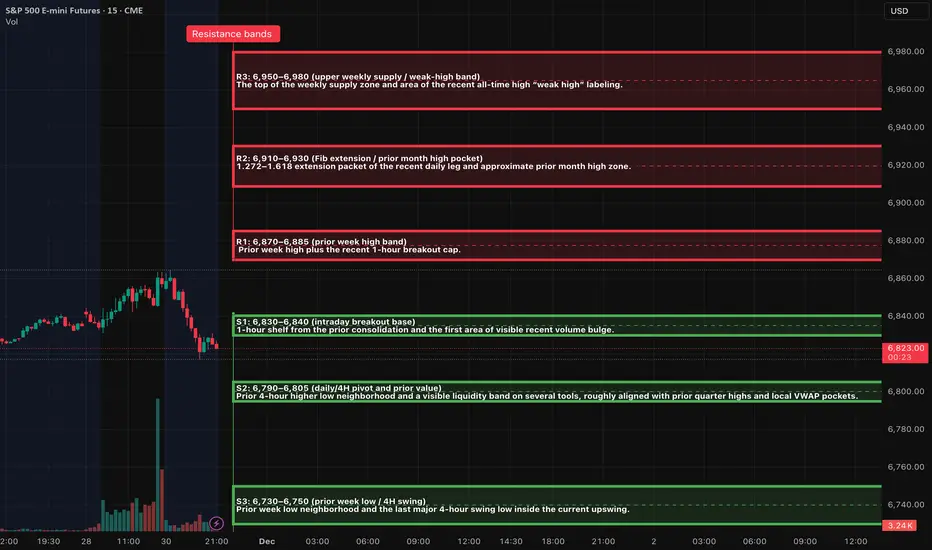
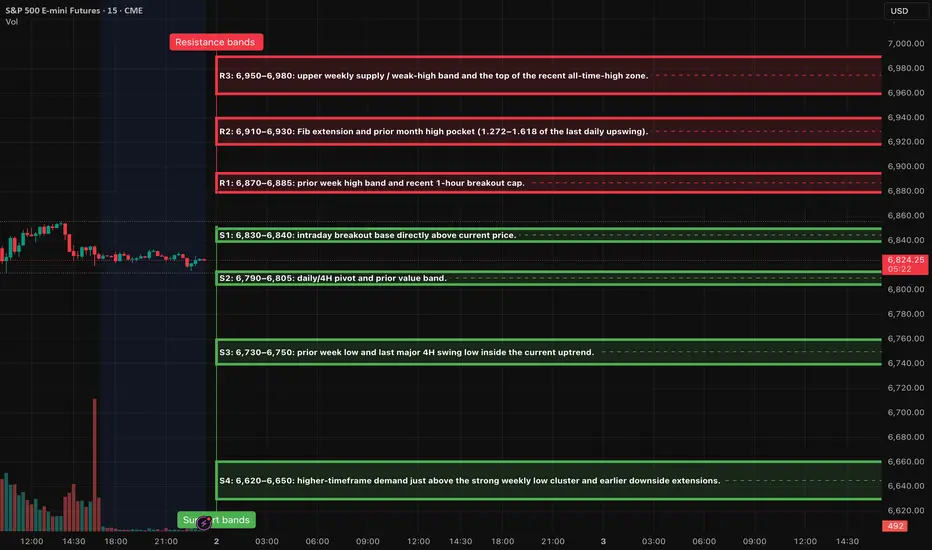
Momentum to the upside continuesMomentum to the upside continues in the S&P 500. The next objective to the upside is 6870.

OB + RSI + MSS = WIN CME_MINI:MES1!
Today, I will present a large part of my strategy using three excellent example trades. It consists of various (SMC) concepts that I have combined.
Entry:
First, I look for an OB, BB, hidden divergence or liquidity sweep on the 1-hour chart. Then I go to the 15-minute and 5-minu

See all ideas
A representation of what an asset is worth today and what the market thinks it will be worth in the future.
Displays a symbol's price movements over previous years to identify recurring trends.
Frequently Asked Questions
The nearest expiration date for E-mini S&P 500 Futures (Dec 2019) is Dec 20, 2019.
Traders prefer to sell futures contracts when they've already made money on the investment, but still have plenty of time left before the expiration date. Thus, many consider it a good option to sell E-mini S&P 500 Futures (Dec 2019) before Dec 20, 2019.