Trendline Support hitPrice has pulled back into a key technical zone and is now testing a long-term rising trendline that has held multiple times throughout the past several weeks. This trendline has acted as a structural support area, aligning with prior swing lows and validating the broader uptrend structure.
Today’s decline pushed ES directly into this support, and the reaction here will likely determine the directional bias for the next session.
What I’m Watching:
Reaction to the trendline on the next retest
Whether volume confirms a true bounce or a breakdown
Price behavior as it re-approaches the highlighted green zone, which has repeatedly acted as both support and resistance
If we close under 6680 today, All is lost and we will drop a lot more.
Trade ideas
From Shutdown Relief to AI Anxiety — Two Narratives Driving ESMarket Theme
The week began on a strong footing, driven by a bullish Sunday reopen in ES after news broke that the 43-day government shutdown was set to end, following the Senate’s late-night support for a potential agreement on November 9th. This relief catalyst created early upside momentum, pushing the index toward all-time highs (ATHs).
However, the tone shifted mid-week. The rally lost steam as markets refocused on a growing concern: the sustainability of current Tech and AI valuations. Investors are becoming more sensitive to the possibility of overstretched AI-related capital expenditure and an emerging bubble narrative, especially with heavyweight earnings and forward-guidance looming. This led to a rotation out of high-beta tech and into safer or less-extended sectors.
On the macro front, Fed speakers adopted a more cautious—if not outright hawkish—tone, emphasizing that a December rate cut is far from assured. The recent government shutdown created a backlog in key economic data releases, leaving policymakers and traders alike without clear visibility into the true state of the economy. The lack of data has amplified uncertainty and reduced the market’s conviction around the timing of any potential policy easing.
In short:
The market is caught between two opposing forces:
The optimistic narrative (shutdown resolved, path to ATHs, resilience in U.S. growth), and
The risk narrative (valuation excess, policy uncertainty, narrowing breadth).
This push-pull dynamic has resulted in compression rather than continuation, with a heavy focus on clarity from upcoming data and major earnings.
What is the Market Doing?
Last week formed an inside week, with the entire range trading within the prior week’s range and settling close to the previous week’s close. This signals indecision and balance, as neither buyers nor sellers had the conviction to push the market into expansion.
Current price action shows the market compressing between:
6875 — previous week’s VPOC / 27 Oct weekly VAL
6740— 13 Oct weekly VAH / 10 Nov weekly volume ledge
These levels are well-defined and respected. The upward trendline continues to hold, with multiple strong rejections signaling responsive buyers stepping in to bid prices back up.
The battle is now between buyers attempting to defend 6740 area which is also confluent with the daily trendline support, and sellers leaning on the overhead resistance close to 6875.
What to Expect in the Coming Week
The key line in the sand (LIS) this week:
→ 6755.25 — Previous week's settlement
Bullish Scenario
If 6755 holds as support, expect buyers to attempt a push toward:
6874.50 — previous week's VPOC
6905.5— weekly 1-SD volatility high
Anticipate responsive sellers in this area.
However, if price breaks above 6874.50 with pace and volume and accepts above it, the path opens for a retest of the ATHs as momentum players and trapped shorts fuel continuation.
Bearish Scenario
If the market accepts below 6755 and fails to reclaim it on any pullback:
First downside target: 6660 — 13 Oct weekly VAL
If buyers fail to respond there, expect an acceleration lower from long liquidation toward:
6605— weekly 1-SD volatility low
6504 — previous month's low (deeper target)
This scenario strengthens if the trendline breaks and sellers begin stepping down aggressively.
Neutral / Compression Scenario
If the market remains trapped between 6875 and 6740 with no breakout supported by pace and volume:
Expect two-way rotational trade
Continued compression and balance within the well-defined range
A buildup of energy that may resolve later in the week with data, earnings or fundamental catalysts
Conclusion
As we start the new week, ES remains tightly coiled between well-defined levels, with the market waiting for clarity from data, earnings, and policy signals. Whether we break from compression or continue to balance, the key will be how buyers and sellers respond around 6755 and whether there are new fundamental catalysts.
As always, I’d love to hear your view on the markets and ES this week? — Drop it below — and give it a boost so more of the community can join the conversation.
Glossary Index for all technical terms used:
VAH (Value Area High)
VAL (Value Area Low)
VPOC (Volume Point of Control)
SD (Standard Deviation)

Survived a Market Selloff | +$241 Trading S&P Futures (Day 71)Ended the day +$241 trading S&P Futures, but it didn’t come easy.
The market started off range-bound, and I traded the highs and lows cleanly — up $300 by 1PM.
Then the bottom fell out, and I got caught in a false range break, watching my account swing from +300 to -500.
Thankfully, I bought at BIA’s key support zone during the late-session recovery and clawed my way back.
Today was all about staying composed when everything flips fast.
Two takeaways today:
Walk away when you say you will — extra orders can cost you.
Range days can break suddenly; keep wider stops when volatility increases.
Above 6820 is bullish, below 6782 turns bearish.
We’re seeing signs of momentum fading, so tomorrow might bring continuation or deeper retracement.

ES (SPX, SPY) Analysis, Levels, Setups, for Fri (Nov 14th)
Today’s session revealed a marked risk-off sentiment as the market began to discipline leading sectors, notably large-cap tech, AI, semiconductors, and high-beta growth stocks. This correction coincided with a reassessment of expectations for near-term Federal Reserve easing and an environment defined by unequal economic data in the wake of the record shutdown.
Despite the abrupt decline, the E-mini S&P 500 (ES) remains in a pullback phase within a broader uptrend, still functioning within a weekly premium and supply zone. This movement exhibits characteristics typical of a sharp correction and repositioning rather than the definitive onset of a bear market. Importantly, prices have yet to break below the last significant daily higher-low region, weekly market structure continues to show constructive signs, and the “stress indicators” monitored by institutional investors are elevated but not yet at levels indicative of a crisis.
Dashboard Context
Volatility: Implied volatility surged today, with equity volatility pushing above previously complacent levels, albeit the term structure remains predominantly upward-sloping rather than inverted. This nuance is critical; while funds are investing more for protection and short-term hedges, the volatility landscape does not yet suggest a disorderly liquidation phase.
Options Positioning: The index and overall put/call ratios have transitioned from a state of complacency to caution, reflecting increased demand for hedging. However, levels are not yet extreme enough to signal panic. Skew is elevated, indicating that investors are bidding for downside protection, although it remains within the upper bounds of a normal range. This suggests that while major institutions are leaning into protective strategies and tactical downside plays, the broader market is not universally positioned for a crash.
Breadth: The internal damage today was notable, with decliners outpacing advancers significantly across major exchanges. This shift in breadth oscillators from positive to negative in a single session points to a broad-based distribution rather than a narrow selloff concentrated in a few prominent names. Historically, such internal damage requires several sessions for a market to recover.
Credit and Funding: High-yield spreads have widened modestly from recent lows, and high-yield ETFs have pulled back from their peaks. Nevertheless, there are no current signs of a credit crisis. Spreads remain well within ranges that do not indicate severe stress, and funding markets continue to operate smoothly. Provided that credit conditions stay stable, current equity weakness is likely more reflective of a valuation and positioning reset than systemic risk.
Cross-Asset Risk: The crypto market experienced a sharp selloff, while global equity indices broadly fell. This behavior confirms a classic cross-asset risk-off scenario, as investors reduced exposure to the highest-beta, most speculative areas while simultaneously de-leveraging from U.S. equity leaders. Conversely, traditional defensive stocks and segments of quality value showed relative resilience, a behavior consistent with a managed de-risking rather than an all-encompassing liquidation.
In summary, the dashboard indicates a shift from “overbought complacency” to a higher-volatility, risk-off environment. However, we have yet to enter a full-scale, credit-driven bear market. This context is essential for interpreting today’s decline in the E-mini S&P 500.
Multi-Timeframe Technical Structure (Weekly → Daily → 4H → 1H)
Weekly: The E-mini remains in an upward trajectory, printing higher highs and higher lows. Prices have retreated from a premium zone established at recent highs. The current weekly bar suggests rejection, yet critically, price levels remain comfortably above the last key weekly higher low near the 6,000 mark. Weekly momentum, previously overstretched to the upside, is rolling over, signaling a potential cooling phase – likely a period of consolidation or corrective drift rather than immediate trend failure.
Daily: On the daily chart, the ES has formed a distinct upper range beneath a weak high. Today’s trading produced a significant red candle, indicating a drop from the upper range back toward its center. The prior swing low around 6,620–6,580 remains intact, but the daily oscillator shows mild bearish divergence relative to the last high – a common occurrence in maturing upswings. This situation conveys the message of “bullish but extended, now in corrective mode,” rather than a definitive shift to a pattern of lower highs and lower lows.
4-Hour: The 4-hour structure has entered a short-term downtrend. A lower high was established in the 6,900–6,920 range, leading to an impulsive sell-off toward demand around 6,730–6,700. This selloff exhibited characteristics of liquidation: substantial red candles, minimal counter-rotation, and strong volume. The 4-hour oscillator shows bearish pressure but is beginning to flatten near support, consistent with an early basing attempt after a sharp sell-off, though additional downside remains possible if negative overnight flows persist.
1-Hour: The 1-hour chart portrays today’s price movement as a decisive liquidation wave.
Today's market decline was driven by three converging factors.
First, we saw a mix of valuation adjustments and crowded positioning. Sectors such as AI, semiconductors, and large-cap growth stocks had experienced significant upward momentum. As a result, profit-taking and forced de-leveraging became evident, especially when the largest index components corrected. This simultaneous adjustment made it challenging for the overall index to hold its ground.
Second, the narrative surrounding interest rates and policy has shifted. Recent commentary from the Federal Reserve has adopted a more cautious tone regarding the pace and scale of future interest rate cuts. With inflation remaining above target and some data being impacted by the government shutdown, policymakers appear hesitant to endorse the market's most optimistic expectations for easing. This recalibration towards a "higher for longer" mindset is detrimental to long-duration growth equities and affects the valuations assigned to market leaders.
Third, while the government shutdown has concluded, the subsequent rhythm of the economic calendar has been disrupted. Several critical data releases have been delayed or are now under scrutiny, prompting investors to navigate through somewhat erratic information. In this context, there has been a notable reluctance to take on risk at elevated valuations without clearer data confirmation. Consequently, we are witnessing a trend of de-risking, characterized by a swift rotation from expensive stocks into cash, defensive positions, and protective strategies.
The outcome has been a pronounced selloff, exhibiting broad downside movement and a surge in volatility. Importantly, this occurred without significant turmoil in credit or funding markets, suggesting that we are dealing with a valuation reset rather than a systemic crisis.
Looking ahead, the question arises: Is this the beginning of a more substantial downtrend or merely a temporary flush? From a structural perspective, the market has yet to breach the typical thresholds that signal the onset of a major downtrend. The previous daily higher low remains in place, the weekly uptrend is still intact, and we have not observed the combination of lower highs and lower lows that would signify a broader bearish phase.
Currently, we are witnessing a rejection from a weekly premium/supply zone, with momentum weakening at both daily and weekly levels. Additionally, there is a clear lower high alongside a liquidation move visible on the four-hour chart, which aligns with the expected behavior during the early stages of a significant correction following an extended rally.
As it stands, the prevailing view is that we are experiencing a sharp corrective phase or volatility spike within the upper range of the ongoing uptrend. While the risk of a more profound correction is heightened, particularly if the support range of 6,600 to 6,535 is breached, the current indicators do not yet suggest a completed market top or a fully developed bearish trend.
A genuine trend transition would likely require:
– a decisive break of S3 and a failed retest from below;
– a sustained period of weak breadth rather than a single-day air pocket;
– and, on the macro side, a clear deterioration in credit and funding conditions alongside a persistent inversion of the equity volatility term structure.
At present, those conditions are not fully in place.
Level-KZ Execution Framework for Tomorrow
Asia/London Participation: If overnight trade pushes the ES down into the 6,710–6,680 range and subsequently prints a rejection with a definitive 15-minute close above that zone, consider it a tactical bounce location. This could target a move back toward the 6,770–6,800 region. Given the event risk, participation should be smaller than usual and approached as preparatory rather than primary risk.
PPI Window (08:30–09:15 ET): The initial 15–30 minutes post-PPI release should be regarded as a discovery phase. If the first impulse upward drives the price into R1/R2 but then closes back below 6,780–6,800 with upper wicks and a failure of the 5-minute structure, it sets up a potential short from the underside of the shelf. Targets for this short could be at 6,720 and then 6,680. Conversely, if the initial market reaction results in a drop to S2/S3 that quickly wicks back and closes above that zone on a 15-minute chart, it presents a tactical bounce long toward the 6,740–6,780 area. The decisive 15-minute close after the data release will provide clarity on which side gains control for the session.
NY AM Kill Zone (09:30–11:00 ET): For short positions, the optimal area remains a rejection from 6,780–6,815 after the PPI reaction is digested. A long upper wick and a return close within that range on a 15-minute chart, paired with a failure in the 5-minute attempts to maintain above, supports a short position. Stops should be placed just above the rejection high, with profit targets initially toward 6,720 and subsequently toward 6,680. Conversely, for long opportunities, an ideal scenario involves a constructive reaction from the 6,700–6,660 support band. This would look for a higher low on the 15-minute chart, reclaiming and holding above 6,700, while sellers falter at S1. In this case, stops would belong below the reaction low, targeting 6,770 and 6,810. Standard A-tier protocol applies: anticipate at least 2R to the first target based on a 15-minute-anchored stop, limit attempts per level, and enforce daily risk guardrails.
NY PM Window (13:30–16:00 ET): Should the ES remain constrained between 6,700 and 6,800 by early afternoon, the trade dynamic typically shifts from discovery to mean-reversion. Thus, the afternoon should primarily focus on managing existing positions from the morning rather than initiating new aggressive plays. Fresh entries based on trending strategies should only be considered if there is a clear breakout from the established intraday range, whether below S3 or above R3, accompanied by confirmation.
Big-Picture Takeaway: Fundamentally, today’s decline indicates a reassessment of overly optimistic growth and AI valuations, along with near-term Federal Reserve easing, partly prompted by a complicated post-shutdown data environment. Technically, the ES is retreating from a weekly premium into various support zones while maintaining the core bullish structure. Stress indicators favored by large professional investors—such as volatility, options positioning, breadth, credit, and cross-asset behavior—suggest a serious risk-off event has occurred, but they don't exhibit the persistent stress and credit strain typically seen before a full bear market materializes.
As long as the ES decisively holds above the 6,600–6,535 zone and doesn’t reject that area from below, the higher-probability play in the coming sessions is a volatile corrective range, offering tactical opportunities to sell rallies into resistance and buy deeper, well-defined demand zones—always bearing in mind the heightened volatility and macro event risks on the calendar.

Day 72 — AI Bubble Fears Hit the Market | S&P Futures RecapStarting to get a bit worried about the stock market. Everything feels tied to NVDA earnings this week, and we’re starting to lose major support levels across multiple timeframes. I took a few losses overnight, so I went into the morning a bit more hesitant and wanted to wait until the market slowed down before committing.
I made some small profits trading off Bia's order and took a few scalp trades off the 1-minute MOB, which helped stabilize the day. This wasn’t a high-conviction environment for me, so I stayed defensive and focused on execution.
📈 Key Levels for Tomorrow
🔼 Bullish Above: 6725
🔽 Bearish Below: 6710
These are the two main pivot levels I’m watching.
Above 6725 we may see buyers regain control.
Below 6710 the bearish wave accelerates.

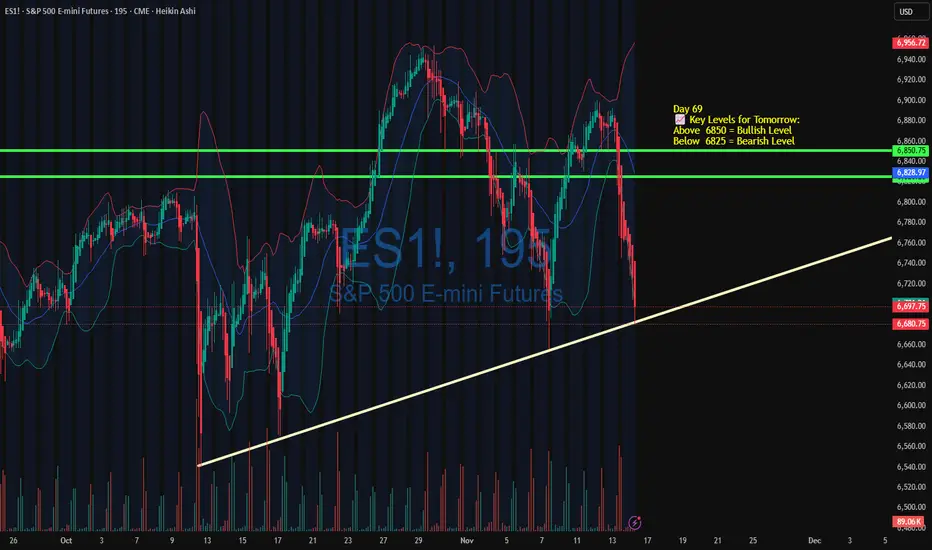
Market Crashed — I Stayed Calm & Made $338 | Day 69 RecapMade $338.44 today trading S&P Futures on a day where almost everything was red.
The market opened with a bearish structure, and even without big headlines, selling pressure stayed strong all morning.
I decided to wait for the 6750 zone — a strong technical support — and caught a clean dead cat bounce from there.
This session reminded me that sometimes, less is more. Trade small, trade smart, and don’t let overconfidence creep in after a winning streak.
Above 6850 = bullish, below 6825 = bearish.
I’ll be watching for follow-through if we retest support again.

Day 68 — Clean Entries, No Chasing | +$251 Trading S&P FuturesMade $251.50 today trading S&P Futures — a clean, low-stress day built around precision and patience.
I shorted the 6892 resistance zone early when structure flipped bearish, then sat out most of the chop until we got a confirmed X3 buy signal at 12:30 to go long.
Days like this are all about discipline — no chasing, no forcing, just letting structure and the algo do their job.
VX Algo was on point — 9 out of 10 signals worked for 5+ points.
That’s the kind of day where patience pays.
Tomorrow’s Levels
Above 6850 = bullish, below 6830 = bearish.
Expect a quieter range day unless we get major data or earnings surprises.

NASDAQ BEARISHLooking at last weeks charts, I saw that it went very far up in the first few days but then plummeted, this week has seen that bear run go further down. If i had to say with NVDA earnings coming out soon, that it will be bearish overall.

Es continuation Minor pullback on gold I think we continue down Down to 6600-6700 although if it does break the 15 min structure there’s is a high possibility of reversal

I Broke My Own Rule & Paid $515 for It | Day 70 RecapLost $515 today trading S&P Futures, and it was 100% on me.
After promising yesterday that I’d trade small, I accidentally entered ES instead of MES overnight — and that mistake cost me $800 in minutes. The rest of the day was a slow crawl back from that emotional hit.
It’s a painful reminder that discipline > direction. The market wasn’t the problem — my execution was.
Above 6840 stays bullish, below 6815 turns bearish.
We’ll see if this selloff stabilizes or extends into week close.

ES 6700 Reaction Zone: Volume Cluster & Fair Value Gap SetupES formed a strong support at 6700, created by a sharp rejection, a heavy volume cluster, and a clean fair value gap. Buyers stepped in aggressively at this zone and turned the sell-off into an uptrend. The beginning of the volume cluster and FVG marks the key reaction point. Waiting for a pullback into 6700 gives a solid long opportunity.

ES UpdateI guess I was right Friday afternoon, it is a repeat of teh circled area. Expecting everything to hit oversold tomorrow.
Gap direction will depend on FDAX which is oversold and at support. If it breaks support, indicators may not work because Europe will go into a free fall.
NVDA earnings Wed AH, jobs report THU premarket, Fed minutes Thu.

TOTAL - Hits October 10 Support = Dip Buy OpportunityTOTAL, NQ1 Crypto1
Surprise surprise - crypto has its scary face on yet again.
But its good to be aware that this is happening while stock indexes are dumping.
As I covered in the previous S&P Futures post (linked), stock indexes have been in a fairly long and volatile sideways correction since the Trump Tariff threat back in October (arrow).
And a 3 wave correction has already completed.
So a next wave up may already be underway for S&P and this could be a very volatile pull back in an uptrend.
If it is (it could also not be 😅) then TOTAL may continue to move with stock indexes and if a bounce comes then crypto may also bounce.
Really, crypto can dump hard and all be fine so long as stock indexes are also dumping. - It is when crypto dumps alone that there is more cause for concern.
So, assuming that stock indexes have not entered a major correction then this can be a nice dip buy opportunity in crypto.
Notice that TOTAL is now hitting support from the October 10 - mega smackdown.
This is the moment for contrarians to buy the dip as TOTAL hits this key liquidity structure.
Its very dangerous of course but the moment to strike is here 🤨.
This analysis is shared for educational purposes only and does not constitute financial advice. Please conduct your own research before making any trading decisions.

A Pitchfork For The LEAPI enjoy a good challenge.
Probably more than is strictly healthy.
That’s why I jumped into the LEAP.
This time I’ve actually got enough hours in the day to show up for the fight. I’m genuinely curious whether I can trade my way into the top 50, even though I’ve already committed a few strategic blunders that shaved off some perfectly good profit.
But that’s trading in the real world, isn’t it?
A comedy of precision errors.
My plan is simple: stick to the Andrews Pitchfork framework and nothing else. The goal isn’t just to place well; it’s to demonstrate how much of an edge this tool offers when you use its rules properly.
Don’t wish me luck - I’m aiming to get there by skill and stubbornness.
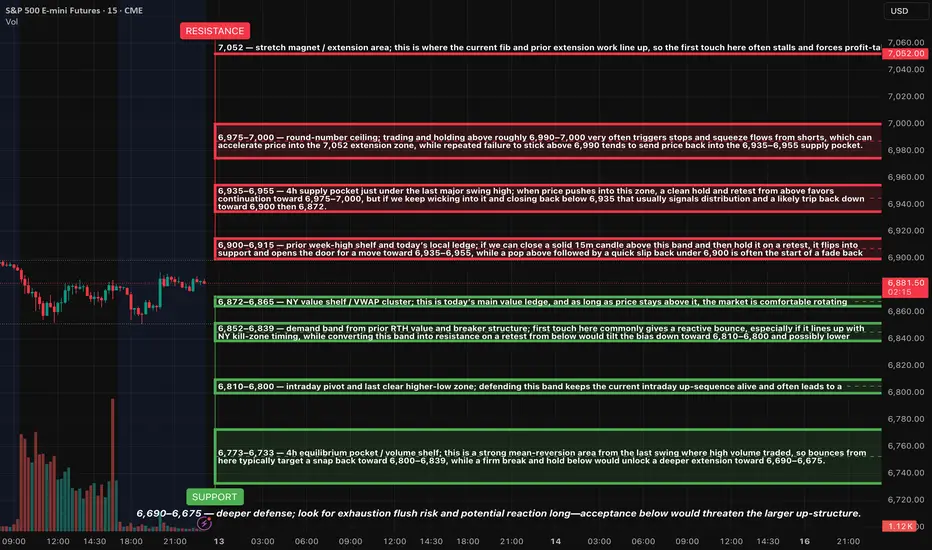
ES (SPX, SPY) Analysis, Levels, Setups for Thu (Nov 13th)HTF Analysis
Daily Chart: The overall trend remains bullish. Currently, the price is situated near the upper range, just below the previous swing high in the 6,960–6,980 zone. The market structure is characterized by a sequence of higher highs and higher lows, indicating that we are experiencing a temporary pause rather than a confirmed peak.
4-Hour Chart: We’re observing a robust V-shaped recovery from the 6,63x–6,66x support zone, with the price now consolidating sideways beneath overhead resistance. The recent 4-hour candles are overlapping within today’s range, suggesting a coiling pattern under resistance rather than a decisive breakout.
15-Minute to 30-Minute Charts: There’s a well-defined range forming. The highs are established around the 6,900–6,915 level, while the lows are consistently found between the 6,872–6,865 shelf, with further lower shelves below. Today's price action has effectively mapped out a framework for potential trading opportunities moving into tomorrow.
MACRO / EVENTS
The government shutdown has officially ended, and normal operations are resuming across agencies. This removes the associated headline risk. The market can now return its focus to the usual macroeconomic drivers: inflation data, the Federal Reserve's policy path, and corporate earnings.
However, there remains some uncertainty regarding the timing and form of upcoming inflation releases due to previous disruptions in data collection. The 8:30 AM ET time slot is still considered a potential source of market volatility. Aside from that, the economic calendar is relatively light, meaning that trading activity around our key levels will likely drive most of the intraday market movements.
SETUPS FOR TOMORROW (LEVEL–KZ STYLE)
Long setup 1 – bounce from 6,872–6,865
Idea: Look for Asia or London to probe into 6,872–6,865 and hold. If we see a clean rejection candle on 15m or 5m and then price reclaims 6,880 and holds above, that sets up a continuation long.
Trigger concept: Reclaim and hold above 6,880 after testing 6,872–6,865.
Risk anchor: Below 6,865, with a little room for noise depending on spread and volatility.
Initial target: 6,900–6,915.
Secondary target: 6,935–6,955.
Stretch idea: If 6,955 holds as new support and order flow remains strong, leave a small runner with eyes on 6,975–7,000.
Long setup 2 – deeper dip buy at 6,852–6,839 or 6,810–6,800
Idea: If 6,872–6,865 fails cleanly but overnight selling is controlled, watch for a fade into 6,852–6,839 or, in a stronger flush, 6,810–6,800. Look for exhaustion and quick reclaim of the upper edge of the band as a signal that buyers are stepping back in.
Trigger concept: Fast rejection wick through the band followed by a close back above the upper edge on 5m–15m.
Risk anchor: Below the lower edge of the chosen band (either under 6,839 or under 6,800).
Targets: First push back to 6,872–6,865, then 6,900–6,915 if momentum improves.
Short setup 1 – fade 6,900–6,915 pop-and-fail
Idea: If price rips into 6,900–6,915 during NY AM without first testing the lower shelves and then quickly fails to hold above 6,900, that is often a spot to fade the top of the range.
Trigger concept: Wick above 6,900–6,915 with a 5m–15m close back below 6,900.
Risk anchor: Above 6,915–6,920.
Initial target: 6,872–6,865.
Extended target: 6,852–6,839 if 6,872 cracks and holds below.
Short setup 2 – rejection from 6,935–6,955
Idea: If we get a clean breakout above 6,900–6,915 but the first test of 6,935–6,955 stalls with heavy wicks and no follow-through, you can look for a tactical fade of that 4h supply pocket.
Trigger concept: Failure to hold above 6,955, with a rotation back under 6,935 on a 15m close.
Risk anchor: Above 6,960–6,965.
Initial target: 6,900–6,915.
Secondary target: 6,872–6,865 if selling expands.
RISK NOTES
Avoid trading in the middle of the 6,872–6,865 and 6,900–6,915 band; let price push into the edges and then trade the reaction.
Size down if price is very slow and overlapping ahead of the 8:30 ET window; there is no need to swing full size into dead tape.
If you see a sudden spike around the data or headline window, focus first on how price behaves at the key shelves 6,872, 6,900, and 6,935 rather than trying to guess the news.
S&P500: Slightly higherS&P 500 futures edged slightly higher in yesterday’s session. The index appears to remain within the upward trajectory of magenta wave (5), which is expected to continue pushing higher. Once this wave reaches its peak, the larger blue wave (III) should also complete. Afterward, we anticipate a corrective phase in the form of magenta wave (A), which could put renewed pressure on the index. However, if prices reverse course and fall below the support level at 6,371, our alternative scenario will come into play. In that case, alternative wave alt.(4) would likely extend further downward, targeting a low within the corresponding alternative zone between 6,055 and 5,822 points (probability: 30%).

S&P500 ON IT'S WAY TO TEST ALL TIME HIGH!Hey Traders so we are back in action checking out the Stock Indexes again.
From now on my main focus will only be the indexes I feel they are the best markets to trade for trend followers like me. Although I may occasionally make a post about other markets the indexes are my main area of study so with that being said lets dive in!
So Govt Shutdown? Seasonally Strength? Inflation Fears? Interest Rates Cuts/Hikes?
I say if you read all the headlines you will find your self in a whirlwind of ideas of how you could trade this market. But imo forget the headlines and go to what we can trust in my opinion is the charts!
For me I believe trade what I see not what we think, not what we hear, only focus on what we see the charts always have been and always will be at least for me the best guide on how to sail these uncharted waters so what do we actually see?
Well I se a strong uprtrend in place since April and I also see the market has rejected the 6690 level 3 times that tells me without any indicators needed what so ever that the market does not want to move lower than that level for now.
Support and Resistance is all you need imo to see whats happening every trading day tells a story follow the story and you will hopefully get on the right side of the market.
So therefore scenarios for today are...
Bullish- this is market is a buy imo on a pullback to the trendline around 6813. Try to put a stop somewhere out of harms way but give the market breathing room around 6760 ish looks safe. Also November seasonally is a strong month normally for stocks. If the Shutdown ends the market could celebrate and the move could be epic!
Bearish- stay in hibernation for the winter. 😁
No seriously the odds and the probabilites are really against the bears here. I would wait for January where normally market Seasonally weakens till march. Watch for maybe a top or break below support and a break below the trendline on a daily close to be sure. Then consider selling a rally.
Commitment of Traders- no report at this time due to govnt shutdown.
Good Luck & Always use Risk Management!
(Just in we are wrong in our analysis most experts recommend never to risk more than 2% of your account equity on any given trade.)
Hope This Helps Your Trading 😃
Clifford
RISK DISCLOSURE
TRADING IN THE FUTURES AND FOREX MARKET INVOLVES SIGNIFICANT RISK. ALWAYS CONSULT A FINANCIAL ADVISOR AS HIGH RISK ASSET CLASSES MAY NOT BE SUITABLE FOR ALL INVESTORS. THIS IS NOT A RECOMMENDATION TO BUY OR SELL ANY ASSETS. ALL IDEAS ARE MADE FOR EDUCATIONAL PURPOSES. PAST PERFORMANCE DOES NOT GUARANTEE FUTURE RESULTS.
CFTC RULE 4.41 – HYPOTHETICAL OR SIMULATED PERFORMANCE RESULTS HAVE CERTAIN LIMITATIONS. UNLIKE AN ACTUAL PERFORMANCE RECORD, SIMULATED RESULTS DO NOT REPRESENT ACTUAL TRADING.

ES - November 14th - Daily Trade PlanNovember 14th- Daily Trade Plan - 6:45am
*Before reading this trade plan, IF, you did not read yesterdays, or the Weekly Trade Plan take the time to read it first! (You can see both posts in the related publication section) *
If my posts provide quality information that has helped you with your trading journey. Feel free to boost it for others to find and learn, also!
My daily trade plan and real-time notes that I post are intended for myself to easily be able to go back and review my plan and how I did from an execution perspective.
--------------------------------------------------------------------------------------------------------
You can read the trade plan from yesterday and see that we had a couple of quick flush and reclaims at the levels outlined, but we did not see any follow through to take us higher. That was our first big red day in a while and as I have stated many times that when price is flushing down, you DO NOT step in the way and try to pick bottoms. Let price reclaim a core level and let it accept that level by 4-5pts and then enter as you see structure building.
I wrote yesterday on my note at 3pm - We are coming into the 0.618 retracement of November low to high that is at 6747. This could be a low that produces the short squeeze into the end of the day. IF price does not close above 6765, we will probably have to test 6706 then 6654 in the coming days. PPI tomorrow at 8:30am and I expect more volatility. Price has to reclaim 6890 to keep price moving to ATH's. IF we close below 6654 this week, it would be bearish and could represent a broader pull back in the coming weeks/months. When price sells off like it has today, we will get a squeeze. Just don't know when.
We did get a 30pt bounce at 6747, closed the day at 6761 and price was a magnet to the resistance of 6775. We lost yesterday's low after the European open and we have been moving lower and are currently at 6713 in the overnight session.
I have mentioned many times that with such a strong sell off, we will get an equally strong squeeze. Since we have PPI at 8:30am, we could get that squeeze today. My job is not to guess when that will happen, but to take a trade one the recovery of a strong level that can help price squeeze higher.
Key Levels Today -
1. Flush and reclaim of 6713 (Current Low as I type this)
2. Reclaim of 6731
3. Reclaim of 6746 (Yesterday's low and highest quality level)
Below we have the weekly low of 6691-95 or 6654. Any flush of these levels and reclaim should give us a very strong squeeze similar to last week's Friday flush!
Patience will be key today and IF price finds a strong low today, we will see it and need to react in real-time.
I will post an update around 10am EST
----------------------------------------------------------------------------------------------------------------
Couple of things about how I color code my levels.
1. Purple shows the weekly Low
2. Red shows the current overnight session High/Low (time of post)
3. Blue shows the previous day's session Low (also other previous day's lows)
4. Yellow Levels are levels that show support and resistance levels of interest.
5. White Levels are previous day's session High/Low

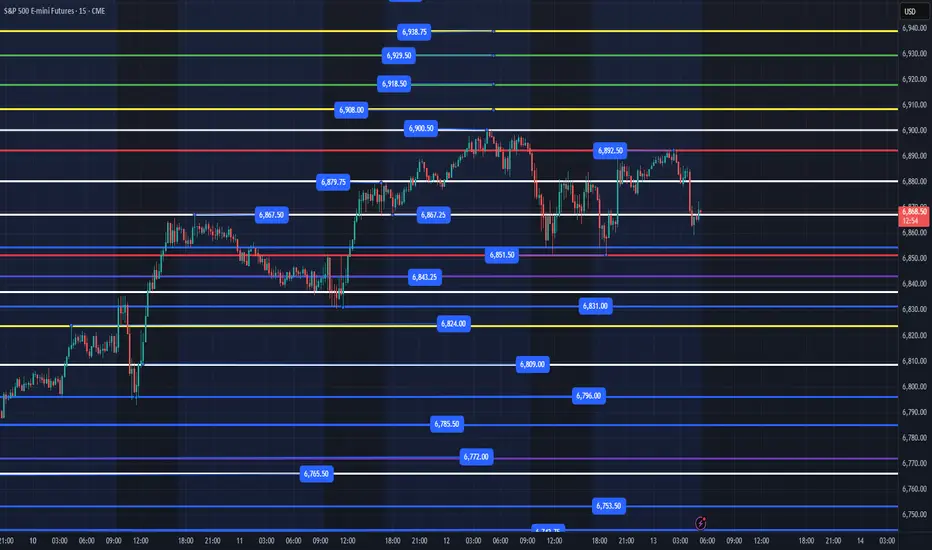
ES - November 13th - Daily Trade PlanNovember 13th- Daily Trade Plan - 5:18am
*Before reading this trade plan, IF, you did not read yesterdays, or the Weekly Trade Plan take the time to read it first! (You can see both posts in the related publication section) *
If my posts provide quality information that has helped you with your trading journey. Feel free to boost it for others to find and learn, also!
My daily trade plan and real-time notes that I post are intended for myself to easily be able to go back and review my plan and how I did from an execution perspective.
--------------------------------------------------------------------------------------------------------
We have CPI at 8:30am and price action this week has been mainly contained to a range between 6831-6900. I expect us to have some volatility today and I am looking at only the best levels to flush and reclaim. Each day there are many levels that can bring points, but the highest quality levels are those where Institutions are entering to ride higher. 6867 has been a magnet inside our range.
Overnight high is 6892 and Overnight low is 6851. As I am typing this post, price just reclaimed 6867 and I anticipate it at least back testing the 6879 level which it broke down from this am.
Key Levels Today -
1. Loss of 6851-53 and reclaim
2. Loss of 6843 and reclaim
3. Loss of 6831 and reclaim
4. Loss of 6796 and reclaim
5. Loss of 6772 and reclaim (possibly as low as 6765 to close the gap)
6. Loss of 6743 and reclaim (possibly down to 6731)
Below those areas and we will most likely need to retest 6654. Price needs to clear 6900 to continue higher with 6918, 6929, 6938, 6953+ being the immediate targets higher.
Key Support Levels - 6867, 6851-53, 6843, 6831-36, 6824, 6809, 6796, 6785, 6772, 6765
Key Resistance Levels - 6879, 6893, 6900, 6908, 6918, 6929, 6938, 6953
We are in a tight range overnight and I still think we need to lose 6851-53 and reclaim for us to move above 6900. Ideally, we can flush down to 6824 and reclaim 6831 or 6837 and reclaim 6843. IF price is selling off, make sure to take your time on entering. Let price flush the level, back test that level, price hold, then you can enter.
I will post an update around 10am EST
----------------------------------------------------------------------------------------------------------------
Couple of things about how I color code my levels.
1. Purple shows the weekly Low
2. Red shows the current overnight session High/Low (time of post)
3. Blue shows the previous day's session Low (also other previous day's lows)
4. Yellow Levels are levels that show support and resistance levels of interest.
5. White Levels are previous day's session High/Low
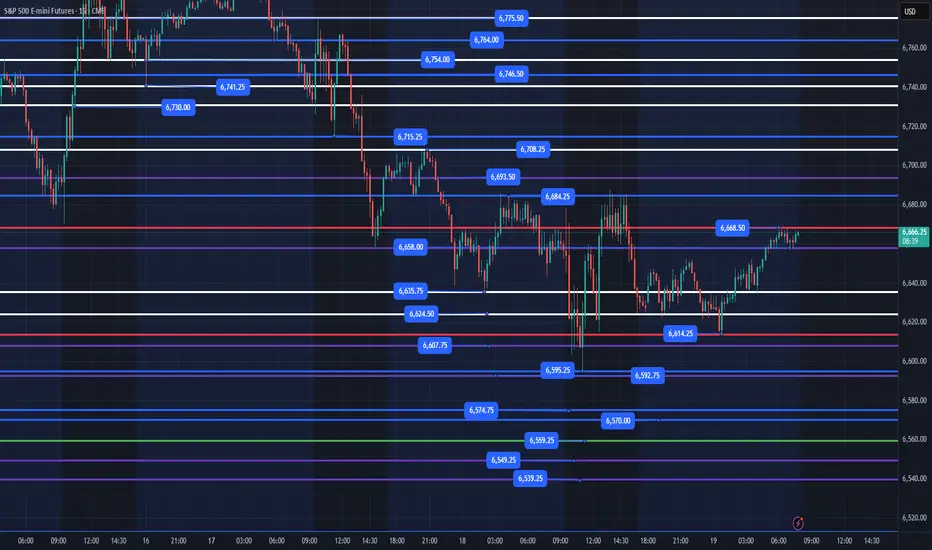
ES - November 19th - Daily Trade PlanNovember 19th- Daily Trade Plan - 7:50am
*Before reading this trade plan, IF, you did not read yesterdays, or the Weekly Trade Plan take the time to read it first! (You can see both posts in the related publication section) *
If my posts provide quality information that has helped you with your trading journey. Feel free to boost it for others to find and learn, also!
My daily trade plan and real-time notes that I post are intended for myself to easily be able to go back and review my plan and how I did from an execution perspective.
--------------------------------------------------------------------------------------------------------
Quick recap of yesterday - Loss of 6635 and reclaim
We lost 6635 at the open and it was a pretty big solid red candle. We then had buyers' step in around 6603 and we had a battle between 6603-6635. We never reclaimed the 6635 level until 11:30am (15 min) candle and that was a great flush below 6603 and reclaim and that was the entry as we can see that price lost a key level (In this case it was weekly and session low) that when reclaimed rallied and you could have entered at any of the key levels above to rally into the 6684 resistance.
---------------------------------------------------------------------------------------------------------
Overnight low is 6614 and overnight high is 6668. As I type this trade plan, price is coming into the 6668 level and is trying to stay above 6658. This should be pretty straightforward today.
Key Levels Today
1. 6614 - We should get one more flush and reclaim of this level before we have to retest yesterday's low at 6595.
2. 6635 - This is the Bull/Bear line in this choppy range between 6684 - 6595. IF we can lose this level and reclaim it should be good for a bounce.
3. 6607 - Any loss and recovery of this level should give us some points.
4. 6595 - Highest Quality level that a loss down to 6581 and recovery should be a good level for points.
Below there and we do not have much of interest until 6570 with 6550 & 6539 the highest quality levels to engage in.
NVIDIA earnings are out after the bell, and my general lean is that price will not do too much today and should continue to chop in this range and overnight could have a sell off down to the 6540 level and then rally and put in the weekly low tomorrow. (This is not information I am trading on, just an observation of how price could react). I will be trading only the flush and reclaim of the levels I have outlined. Remember, we have Thanksgiving next week and I would not be surprised if price tests the 6540 level by Friday and we rally end of the week as retail and sentiment becomes more bearish.
I will post an update around 10am EST
----------------------------------------------------------------------------------------------------------------
Couple of things about how I color code my levels.
1. Purple shows the weekly Low
2. Red shows the current overnight session High/Low (time of post)
3. Blue shows the previous day's session Low (also other previous day's lows)
4. Yellow Levels are levels that show support and resistance levels of interest.
5. White Levels are previous day's session High/Low
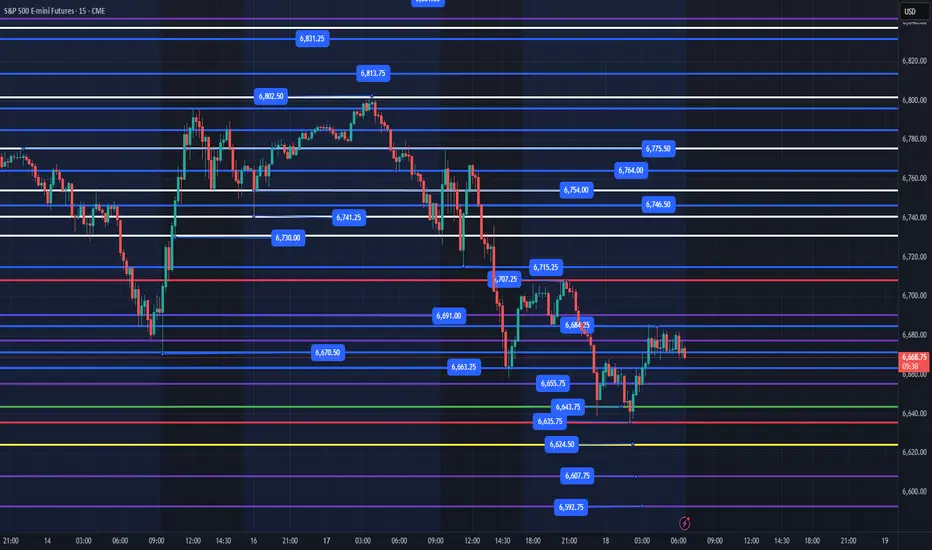
ES - November 18th - Daily Trade PlanNovember 18th- Daily Trade Plan - 6:30am
*Before reading this trade plan, IF, you did not read yesterdays, or the Weekly Trade Plan take the time to read it first! (You can see both posts in the related publication section) *
If my posts provide quality information that has helped you with your trading journey. Feel free to boost it for others to find and learn, also!
My daily trade plan and real-time notes that I post are intended for myself to easily be able to go back and review my plan and how I did from an execution perspective.
--------------------------------------------------------------------------------------------------------
Yesterday, we had good reactions at our key levels. Price ultimately went lower into the last hour of trading, and we got a nice, failed breakdown of 6670 that rallied into the close to finish of the day. You can review yesterday's plan and price action by viewing the post in the related publication section.
Today we have a pretty straightforward plan that I will go over below!
Our overnight high was 6707 (Right below our 6713 level from yesterday). Our overnight low was 6635 which we put in a nice, failed breakdown of 6643. This pattern of price losing a low, then quickly reclaiming that low is a pattern we will continue to see in a volatile and downward trending market. Price is building a really nice base between 6667 and 6684. I anticipate this will continue higher and retest the overnight high of 6707. Any reclaim of 6684 on a back test should give us a good entry or a flush of 6663 and reclaim would take us higher, also. Until price can clear 6715, price is still in a lower high, lower low trend!
Key Levels Today -
1. Loss of 6663 and reclaim
2. Loss of 6635 and reclaim
3. Reclaim of 6684 with a back test of this level for possible entry.
Below we have 6624 and some past weekly levels of 6607, 6592. These levels will be key and the flush of one of them and reclaim should keep us moving higher. The safer place to enter is to wait for it to clear the level from above, back test that level and then enter.
We have Thanksgiving next week and I would not be surprised if price tests the 6540 level by Friday and we rally end of the week as retail and sentiment becomes more bearish.
I will post an update around 10am EST
----------------------------------------------------------------------------------------------------------------
Couple of things about how I color code my levels.
1. Purple shows the weekly Low
2. Red shows the current overnight session High/Low (time of post)
3. Blue shows the previous day's session Low (also other previous day's lows)
4. Yellow Levels are levels that show support and resistance levels of interest.
5. White Levels are previous day's session High/Low
I Made $977 Trading S&P Futures | Day 67 Market BreakdownI made $977 today trading S&P Futures, catching both sides of the move — shorting early weakness, then flipping long after a confirmed bullish structure shift.
The VX Algo signals lined up perfectly with the government shutdown resolution, giving clear reads on momentum reversals. Patience, structure, and signal confirmation were key today.
Above 6830 stays bullish, below 6807 turns bearish.
Watch for structure continuation into midweek.

ES - November 17th - Daily Trade PlanNovember 17th- Daily Trade Plan - 7am
*Before reading this trade plan, IF, you did not read yesterdays, or the Weekly Trade Plan take the time to read it first! (You can see both posts in the related publication section) *
If my posts provide quality information that has helped you with your trading journey. Feel free to boost it for others to find and learn, also!
My daily trade plan and real-time notes that I post are intended for myself to easily be able to go back and review my plan and how I did from an execution perspective.
--------------------------------------------------------------------------------------------------------
On Friday I posted an update note around 12:28pm and wrote a summary of the key levels and their reactions as we squeezed on Friday. I also wrote "Price can still reach 6808 and potentially as high as 6842. Price will need to cool off and needs to hold 6746 as it is the most significant level (Yesterday's Low) we could flush down to 6730 with no lower than 6713 with any pullback, but I would not be interested in any action until it recovered the 6746 level. IF that happens, we will have a shot of clearing 6892 next week and head to ATH's heading into end of month"
6pm open last night we quickly lost 6746 at the open down to 6740, quickly reclaimed 6746 and rallied overnight to 6802 before pulling back around the European open to 6764. This was a classic failed breakdown. WHY? We can see that 6746 was Thursday's low, it was also strong resistance on Friday and now we got more points from this level at the open and has been a strong support since the squeeze on Friday.
Overnight high is 6802 and low is 6741. Any loss of 6746 and reclaim should be good for another try at the overnight high. 6764 loss and reclaim should be another decent level for some points.
Key Levels Today-
1. Loss of 6764 and reclaim
2. Loss of 6741-46 and reclaim
3. Loss of 6731 (maybe down to 6721 area) and reclaim
4. Loss of 6713 and reclaim
5. Loss of 6670 and reclaim (Highest Quality - Friday's Low)
Support Levels - 6764, 6741-46, 6731, 6713, 6703, 6691, 6677, 6670, 6654, 6643
Resistance Levels - 6775, 6785, 6802, 6813, 6831, 6842, 6851,
I will post an update around 10am EST
----------------------------------------------------------------------------------------------------------------
Couple of things about how I color code my levels.
1. Purple shows the weekly Low
2. Red shows the current overnight session High/Low (time of post)
3. Blue shows the previous day's session Low (also other previous day's lows)
4. Yellow Levels are levels that show support and resistance levels of interest.
5. White Levels are previous day's session High/Low
