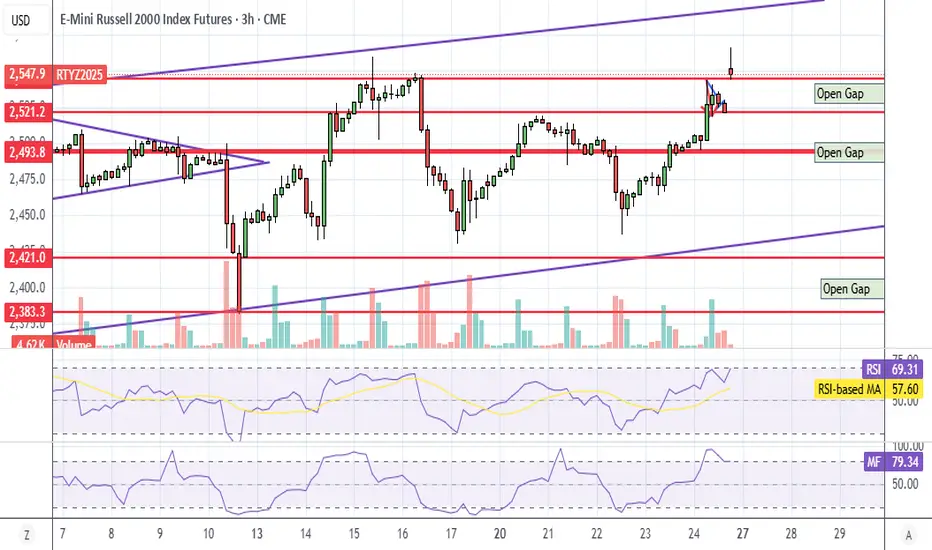
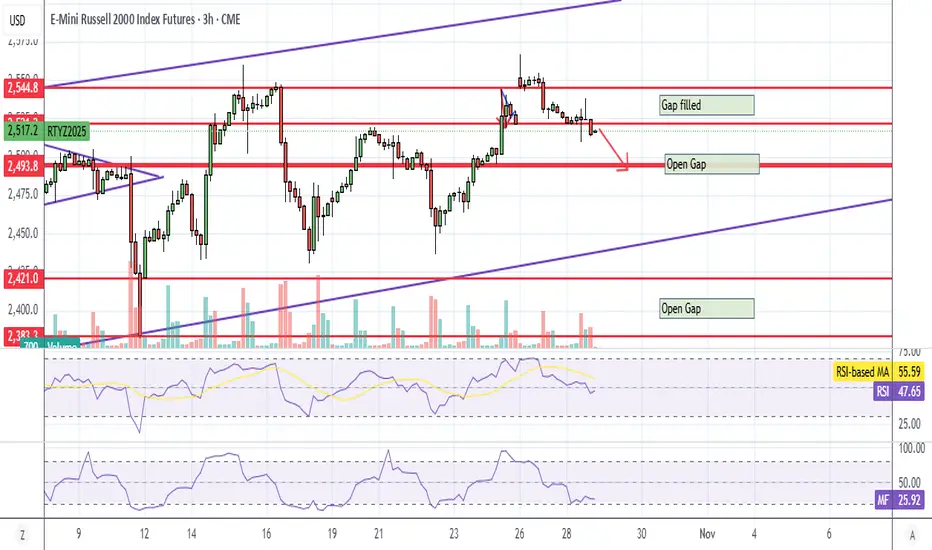
RTY Small Open GapRTY has a small open gap from the Thurs 1 hr break that does not exist on NQ and ES. Pennant breakdown also looks bearish.
ES did not go oversold on RSI last drop like RTY did, so maybe ES melts up and RTY doesn't? Small caps can diverge from NDX and SPX. Also, RTY didn't break out to a new ATH like the otehr 2 indices.
Trade ideas
RTY UpdateOverbought with MFI divergence and 3 gaps below but I don't think I will be shorting IWM this week. Too much trade news hype.
RTY Daily ChannelThis is why I said there might be a melt up next week. RTY has been in the same upward channel since the tariff tank. You figure as bullish as this market is, it needs to hit the top of the channel in a breakout like this.
Will not be shorting IWM next week. Long on shitcoin for the week based on daily indicators.
Since the market broke out, I think it'll be easier to buy the dips when MFI gets oversold on my 3 hr chart than shorting anything.

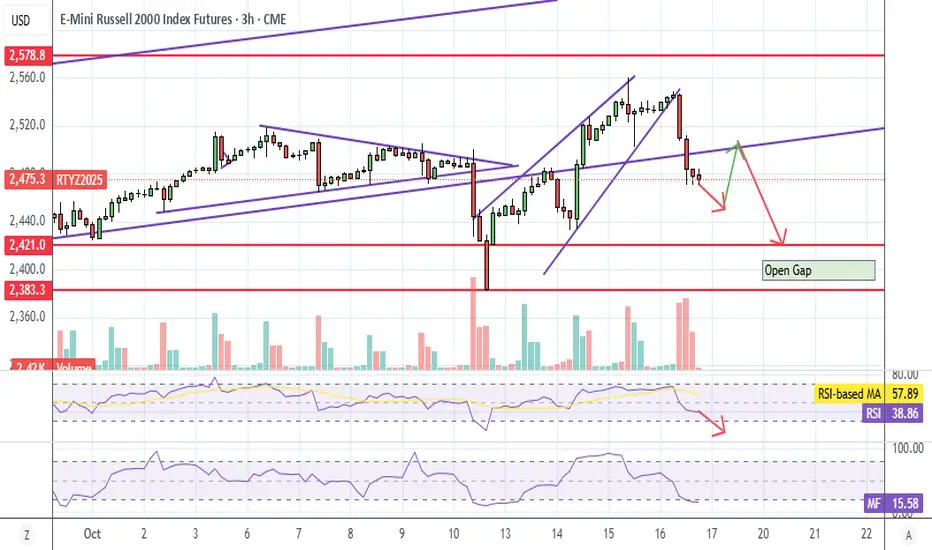
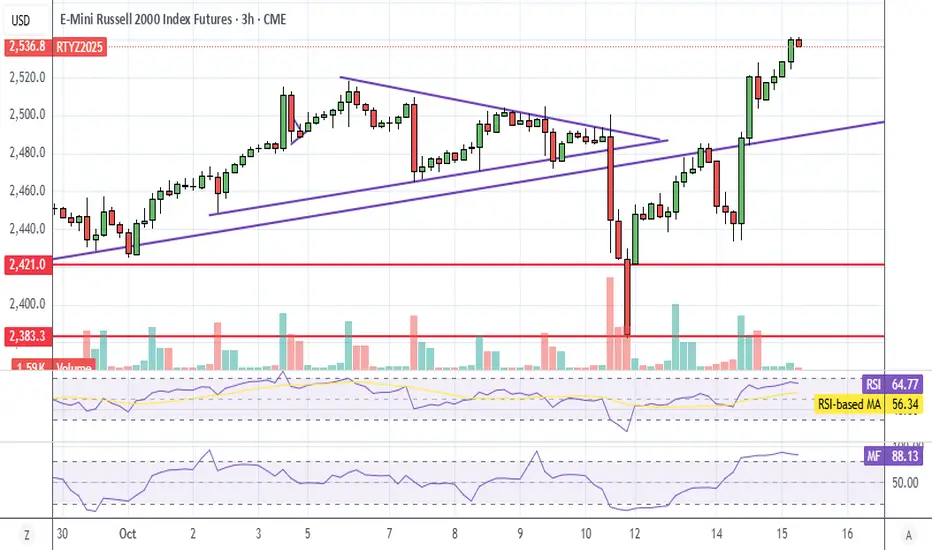
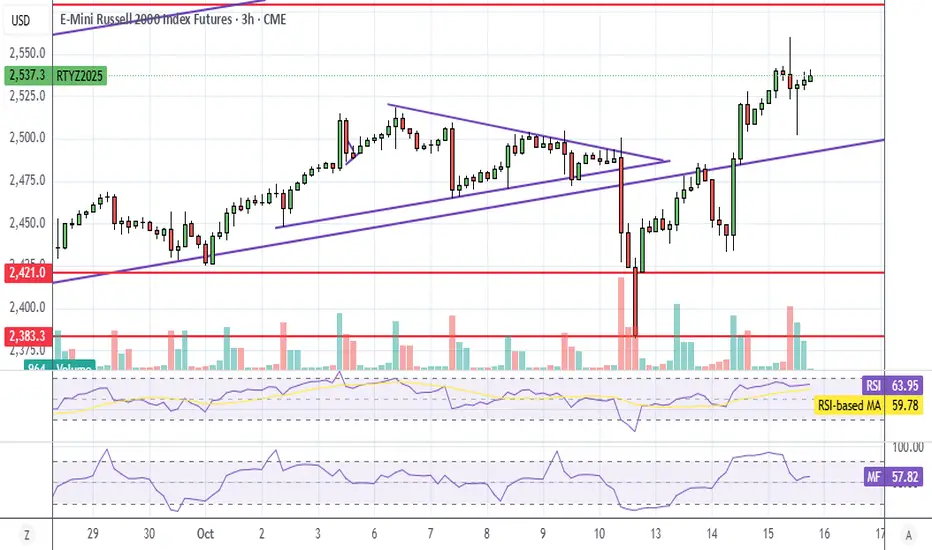
RTY Small cap pennantLooks like small caps made yet another pennant. CPI numbers tomorrow, no position yet. Regardless of which way it breaks, I expect MFI to get overbought tomorrow, possibly premarket.
The open gap below still has me bearish so I'm inclined to believe down. We'll see.

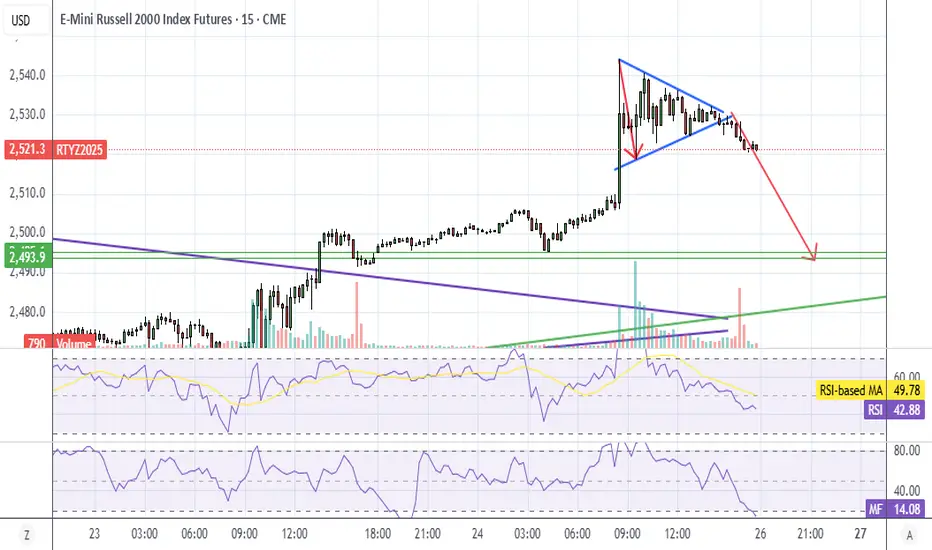
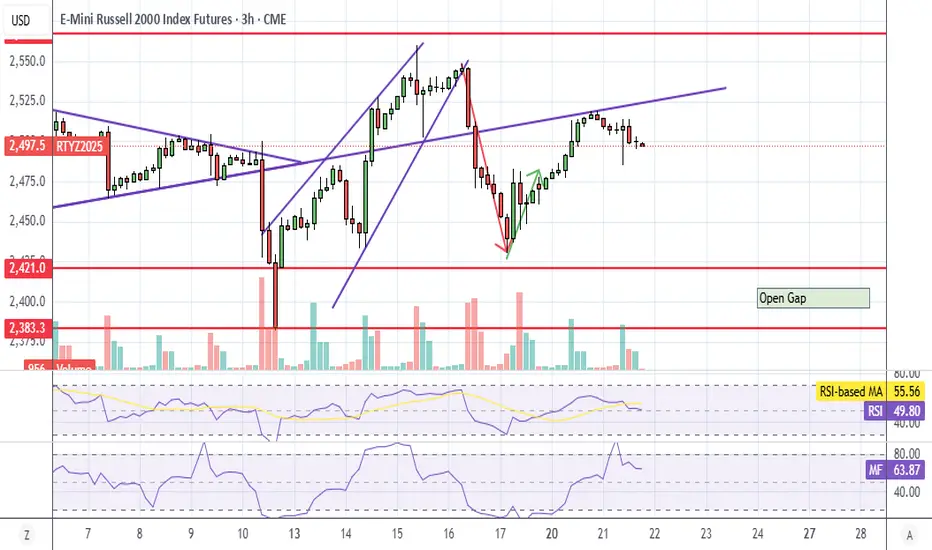
RTY PennantRTY formed a morning pennant and broke down in the afternoon. Target shown.
Small caps have a tendency to fill gaps.

RTY UpdateRSI and MFI hit oversold yesterday, missed the dump because I was hungover and cashed out early, lol.
I assume they do a pump on CPI tomorrow.
RTY Update - No TACO on ThursdayI keep saying that futures gap underneath needs to be filled, and small caps have the longest way to go to get there. So I bought some IWM puts this morning, and decided to hold it even though it looked like a repeat of yesterday right after lunch. I figured MFI wasn't oversold, and worst case, I just come out even, lol.
Holding the puts overnight, guessing we see a gap down tomorrow. We probably get a bounce when RSI hits oversold. Not gonna go long at this point until the gap below fills.
Algos control the market and the talking heads just attach a reason to it. They're blaming Dimon for his "cockroach" comment, lol. Financials did take the hardest hit though. Wish I had shorted XLF.
I think the gap below fills by next Friday, but I think you want to wait for a bounce before buying puts. If we get the gap down that I expect, I'm flipping my puts on open. We're gonna see some whipsaw tomorrow.
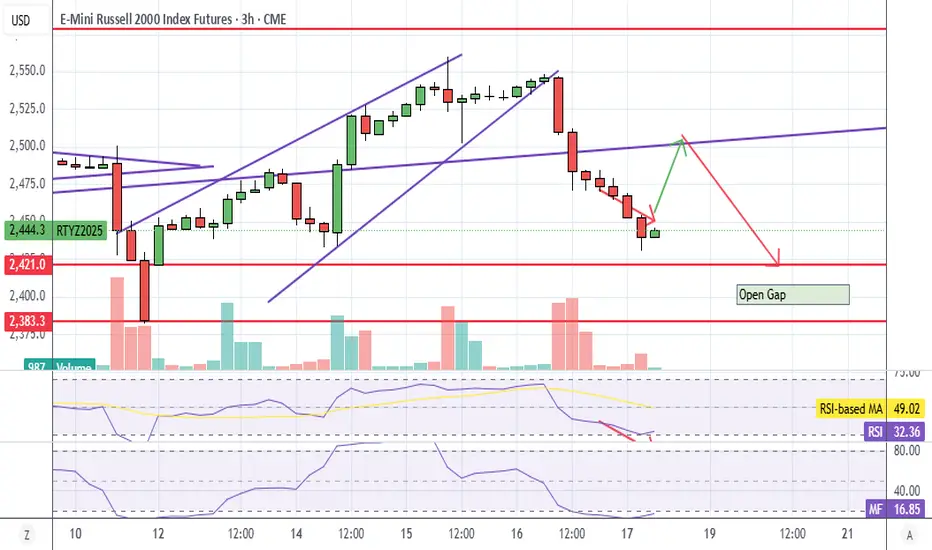
RTY Premarket Update AgainWell, RSI hit oversold and bounced premarket unfortunately for me.
I think it's gonna basically do a H&S pattern as drawn. There are other possibilities such as double bottom on the premarket low, daily index gap fill then down, or a straight tank.

RTY Premarket UpdateLooks like RTY did indeed get TACO Tuesday, they pumped futures up 1%. RSI still not overbought, so will wait until the afternoon or possibly tomorrow to short something, Might get back into the KSS trade if it looks good.
Keep an eye on XRT (retail) as well.
RTY UpdateDoesn't look like the algos are interested in pumping small caps. Appears to be all about NQ right now.
Looking like that small gap below is gonna fill, but watch out for the Fed meeting tomorrow.
100 to 1,000,000 (no sound)went short off of consequent encroachment of 15m wick was hoping to get to the c.e. of 15 m wick low of the day. We weren't able to get it but that's fine. Only GOD is good.


RUSS 2K....GOING WHICH WAY? HMMM CME_MINI:M2K1! Bias-Bearish HOWEVER!
Price is hitting some key areas and will show us whether it continues or dumps to key levels.
PP-2522-2514 are fib zones in a FVG so price could most def push higher to the S.O.B above (which is what a majority of signs show). However my personal belief with all the negative news I believe we will have this week, price will take some of these lows out and find a B.O.B below. Thats a theory but like always we let price tell us the true trend and direction! Now what is your theory for this week?
Either way, WE'RE GOING TO GET PAID!

RTY Premarket UpdateMFI is overbought on RTY, ES, and NQ. VIX died last night so not expecting a huge tank unless CPI numbers are really bad.
I think I have a new rule now, TACO gaps don't need to fill, lol. We had 2 previous TACO gaps in the spring that went unfilled as well.
We'll see what happens next week.

RTY UpdateMFI went overbought premarket, bought some IWM puts when it filled the gap on the daily index. Will dump it when MFI or RSI hits oversold.
It's really odd, even with that huge gap underneath, the market just doesn't seem very bearish. We'll see tomorrow.
RTY UpdateRSI hit oversold and bounced just as predicted, gonna flip my puts on open and call it a week.
Here's the thing though.... we will only get a good bounce if they left the algos on. Sometimes, they'll shut the algos off during a tank.
So we may or may not get a big bounce.
RTY UpdateWell, we got our pump and dump this morning, a bit earlier than I expected, but they made it so obvious it was hilarious. Hope you made some money off of it.
It did go back up more than I expected, so this could be a melt up. We'll find out tomorrow, I think we gap down because European market, especially DAX doesn't look very bullish. DAX failed to break out, could come back down.
Looks like retail pump is over, I shorted KSS because XRT options have no liquidity. There's literally zero visible bids. I looked at it this morning and remembered why I don't trade it. I guess they had to pump it because HD was way oversold.
Speaking of which, now that retail sector pump is over, I just noticed that they aren't pumping RTY as hard as yesterday (vs SPX futures ES) or maybe it's because of financials.
Trade War? No, we want TACO! RTY UpdateSmall caps went full out into the TACO trade, they pumped the crap out of retail today.
The other indices are acting as if the gap below needs to fill, small caps totally ignored it. That means it's got the most to go down if the gap does need to be filled.
Tomorrow looks like a pump and dump setup, RSI probably hits overbought, then reverses down.

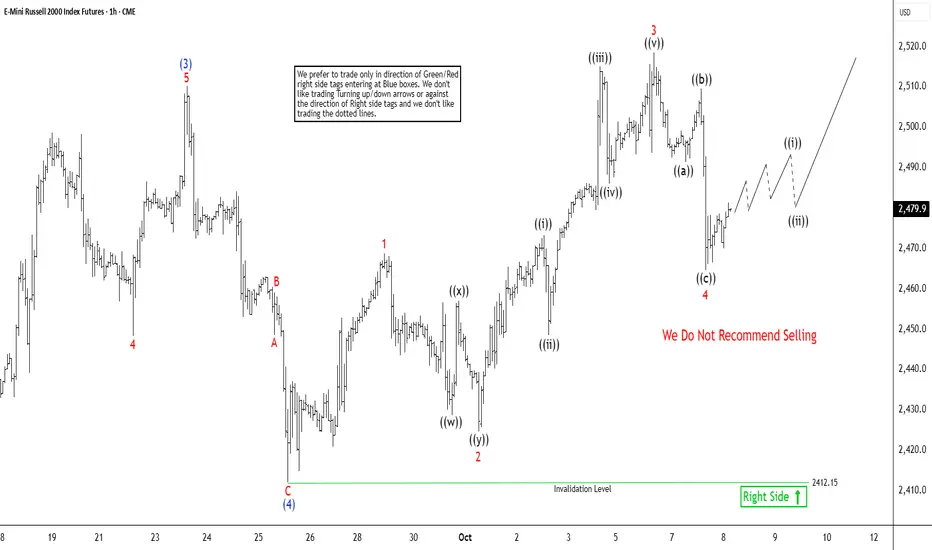
Russell 2000 Futures (RTY) Advancing in Wave 5The short-term Elliott Wave analysis for the Russell 2000 (RTY) indicates a five-wave impulse cycle from the May 23, 2025 low. Wave (1) peaked at 2296.5. Pullback in wave (2) corrected to 2146.8. Wave (3) surged to 2510.3, as shown on the one-hour chart. Dips in wave (4) formed a zigzag correction. Wave A dropped to 2448.5, wave B rose to 2459, and wave C fell to 2412.15, completing wave (4).
The Index resumed its rise in wave (5). Wave 1 reached 2468. Wave 2 dipped to 2424.7. This wave subdivided into a double three structure. Wave ((w)) ended at 2428.7, wave ((x)) at 2457, and wave ((y)) at 2424.7. The Index then advanced in wave 3 as an impulse. Wave ((i)) hit 2473.2. Pullback in wave ((ii)) corrected to 2448.5. Wave ((iii)) climbed to 2515. Wave ((iv)) fell to 2486. Final wave ((v)) peaked at 2518.5, completing wave 3. Wave 4 corrected as a zigzag, ending at 2464.6. As long as the 2412.15 low holds, dips should find support in a 3, 7, or 11-swing pattern. This suggests more upside soon. The Index remains poised for further gains if the pivot holds.
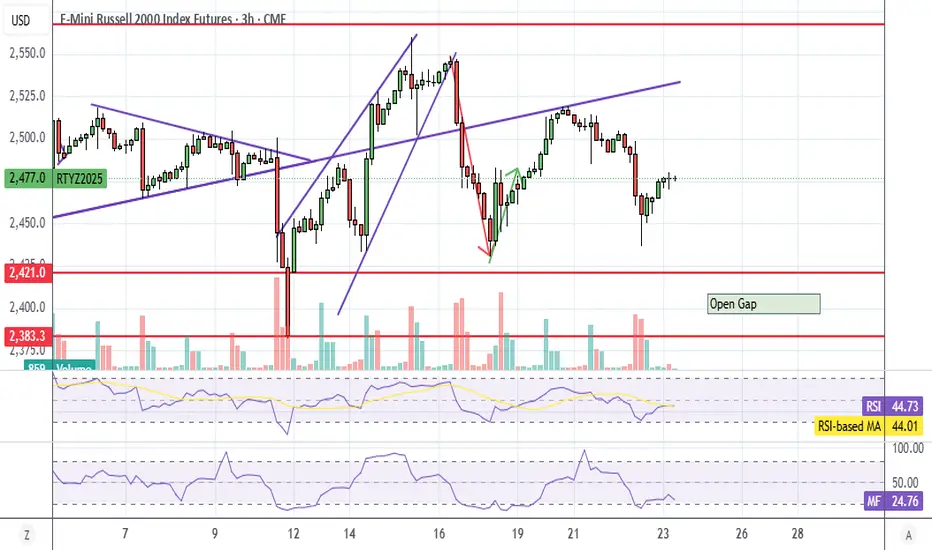
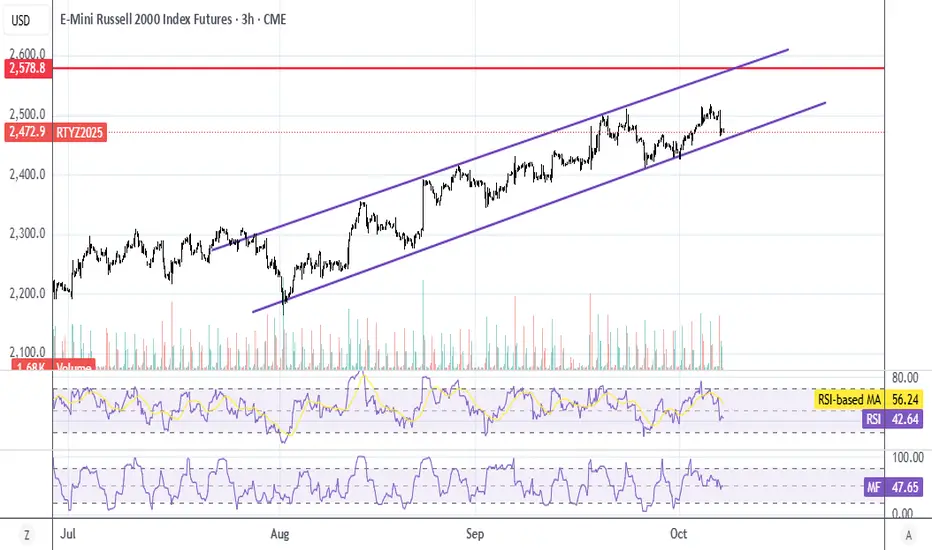
RTY UpdateNQ didn't quite finish the gap fill (see NQ1 plot I posted earlier), and I think all of the indices are going to hit oversold on RSI. That's very bearish for RTY because it's going to break the upward channel shown.
Might still go long when RSI and MFI hit oversold, market usually back tests the channel line. Keeping an eye on Europe, especially FDAX (Germany), and playing it by ear.
All cash right now, no positions.
RTY UpdateWell, I moved my stuff into storage, and sold my house in WA. Gold looks topped out (or close enough that I don't want to play it any more), so I'm back in the stock market again.
I noticed today that a bunch of crap stocks like RH bounced today after a selloff the last week or two. One that caught my eye today is AFRM. They actually make money now, so I think it'll follow through nicely on the bounce today. Bought some calls and stock mid day while it was in the bull flag.
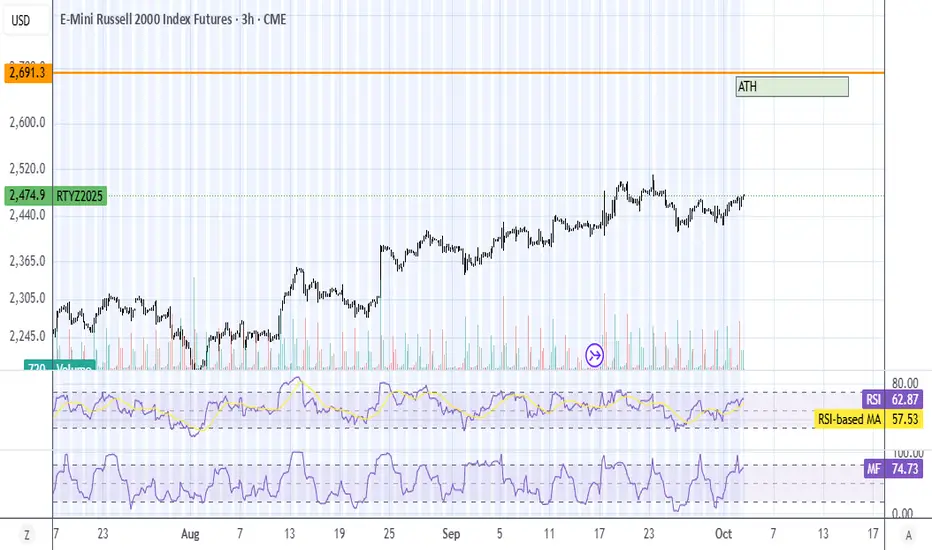
The EUros are pumping the crap out of everything, so not gonna short anything. Not to mention if they get a budget deal done over the weekend, you'll see a big pop Monday. Both RSI and MFI hit overbought on ES and NQ on my 3 hr chart, but RTY did not hit overbought. I think there's a good chance small caps get pumptarded with Europe breaking out since RTY hasn't hit all time high (ATH) yet. (Marked on chart)
Can't promise I'll post often, but I will post when I see something. I don't recommend shorting anything until the budget deal gets done.
The biggest indicator that the market is pumping crap stock is ARKK climbing, lol.
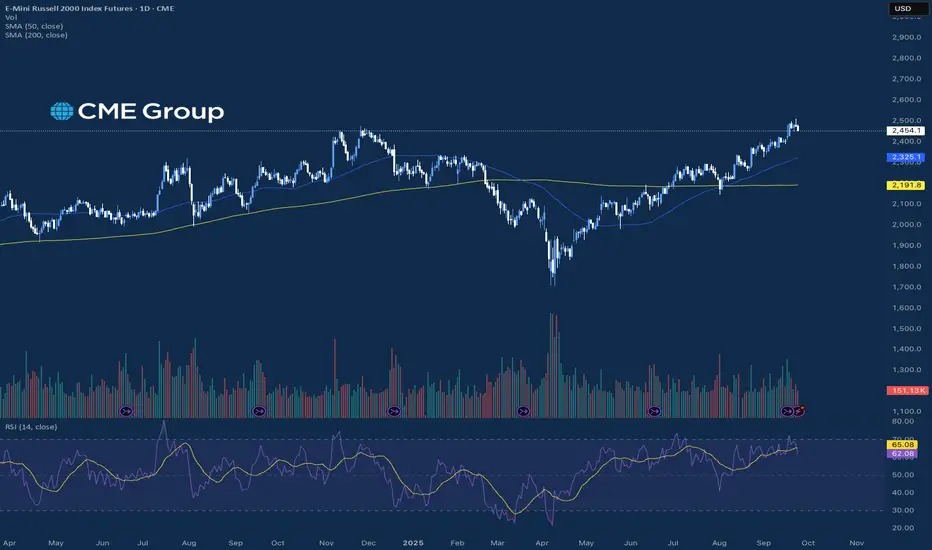
Markets Mixed Ahead of Data DayMarkets are seeing a nice mix of positive and negative moves on the day today, with the equity and precious metals markets broadly trading lower. The Russell led the equities lower trading down near 0.7% while the Gold and Silver market were lower by over 1% each on the day. Both of these markets have been making strong moves to the upside over the last few weeks, and seeing days like today coming from all time highs can be expected. New Home Sales reporting came out today and came in significantly higher than expected at 800k, which was the highest number seen since February of 2022.
Outside of these markets, Copper saw a strong move higher trading almost 4% higher on the day due to disruptions at a major copper mine, and Crude Oil traded over 2% higher after a better than expected Crude Inventories report was released today. There is a strong slate of data being released tomorrow looking at Durable Goods and GDP, which could play a big role in the potential futures interest rate cuts for the remainder of the year from the Fed.
If you have futures in your trading portfolio, you can check out on CME Group data plans available that suit your trading needs tradingview.com/cme/
*CME Group futures are not suitable for all investors and involve the risk of loss. Copyright © 2023 CME Group Inc.
**All examples in this report are hypothetical interpretations of situations and are used for explanation purposes only. The views in this report reflect solely those of the author and not necessarily those of CME Group or its affiliated institutions. This report and the information herein should not be considered investment advice or the results of actual market experience.
Bulls Spring-Load at VWAP - Next Leg Higher📝 To see my confluences and/or linework, step 1: grab chart 📊, step 2: unhide Group 1 in object tree 🌳, step 3: hide and unhide specific confluences ✨
🔥 RTYZ25: Bulls Spring-Load at VWAP - Next Leg Higher
The Market Participant Battle:
Bears attempted to push Russell 2000 futures below the critical 2445 support zone (point 2), but were definitively beaten by institutional bulls who defended both VWAP levels and created a proven buyer zone. As price returns to point 4 after confirming strength above point 1, we're witnessing a classic setup where bears got trapped and bulls are now coiling for the next explosive move higher. The expected return should target 2480+ as trapped shorts cover and momentum buyers pile in.
Confluences:
Confluence 1: Proven Buyer Zone Formation
When point 3 closed above point 1, it transformed point 2 into a fortress of proven institutional buyers. These participants successfully defended their positions against aggressive selling pressure. Now at point 4, we're returning to this battle-tested support zone where the victorious bulls are likely to defend again with even greater conviction. This is textbook market structure showing clear participant dominance.
Confluence 2: Bullish Divergence Power Play
Price made a lower low while RSI and MFI created higher lows - this screaming bullish divergence signals exhausted selling pressure. The smart money indicators are flashing green while price tests support, creating a powerful spring-loading effect. This divergence at a critical support zone is a high-probability reversal signal.
Confluence 3: VWAP Magnetic Support
Two critical VWAP anchors converge at point 4: The VWAP from point 1 and the major volatility inception VWAP both act as magnetic support. Point 4's red candle pierced but held above the first standard deviation - a classic institutional defense pattern. This dual VWAP support creates an incredibly strong floor for the next leg higher.
Confluence 4: Volume Profile POC Breakout Pending
The developing Point of Control (POC) sits just above current price as resistance. Once price closes above this level, it becomes a powerful launchpad for continuation. Volume profile shows clear accumulation at these levels with buyers stepping in aggressively.
Confluence 5: Golden Fibonacci Pocket
Using Fibonacci extension from point 2 to 3, price has retraced into the sweet 0.62-0.79 zone - the retail trader's favorite entry pocket. This self-fulfilling prophecy creates additional buying pressure as technical traders pile in at these mathematically significant levels.
Confluence 6: Hidden Bullish Imbalances
The last two candles, despite being red, contain stacked bullish imbalances (fair value gaps) that price will likely return to fill. These hidden pockets of inefficiency act like magnets pulling price higher once the reversal begins.
Web Research Findings:
- Technical Analysis: Russell 2000 currently at 2,234.20, showing strong technical buy ratings across multiple timeframes (daily, weekly, monthly all "Strong Buy")
- Recent News/Earnings: Small caps posted 17.9% YoY earnings growth in Q2 2025, strongest since Q4 2022. Q3 expected to grow 43% YoY, Q4 projected 73.8% YoY - explosive earnings acceleration ahead!
- Analyst Sentiment: Forward P/E at attractive valuations (54.19 CAPE), small caps trading at significant discount to large caps - rotation imminent
- Data Releases & Economic Calendar: Fed just cut rates 0.25% on Sept 17, with two more cuts expected in 2025. Small caps biggest beneficiaries as they carry higher debt loads
- Interest Rate Impact: Lower rates directly boost small-cap profitability as floating-rate debt adjusts downward. Market pricing 70%+ probability of cuts in October and December
Layman's Summary:
Think of this like a coiled spring that's been compressed (the pullback to point 4) and is about to release explosive energy upward. The Fed just started cutting interest rates, which is like giving rocket fuel to small-cap companies since they benefit most from cheaper borrowing costs. Earnings are accelerating dramatically (from 17% to potentially 73% growth), institutions are defending key price levels, and technical indicators all scream "BUY!" This setup combines the perfect storm of improving fundamentals, supportive Fed policy, and rock-solid technical structure.
Machine Derived Information:
- Image 1: 4-hour RTYZ25 with numbered pivot points - Significance: Shows clear 1-2-3-4 pattern with point 4 testing proven support established at point 2 - AGREES ✔
- Image 2: 1-hour RTYZ25 with extended analysis - Significance: Confirms VWAP support holding, shows accumulation pattern, validates support zone - AGREES ✔
- Image 3: Volume Footprint with delta analysis - Significance: Reveals buying absorption at lows, positive delta clusters show institutional accumulation despite red candles - AGREES ✔
Actionable Machine Summary:
All three chart timeframes confirm the same bullish story: institutional buyers are aggressively defending the 2445-2460 zone, creating a high-probability launch pad for the next leg higher. The volume footprint shows clear absorption of selling pressure with positive delta readings even in down candles - classic accumulation before markup phase.
Conclusion:
Trade Prediction: SUCCESS ✅
Confidence: High
This setup presents a textbook confluence of bullish factors: proven institutional support, oversold bounce with divergences, Fed tailwinds via rate cuts, exploding earnings growth, and perfect technical structure. The risk/reward heavily favors longs here with clear stop below point 2 and targets at 2480-2500+. With small caps historically outperforming after Fed pivots and current valuations at multi-year discounts, this trade aligns with both short-term technicals and longer-term fundamentals.
