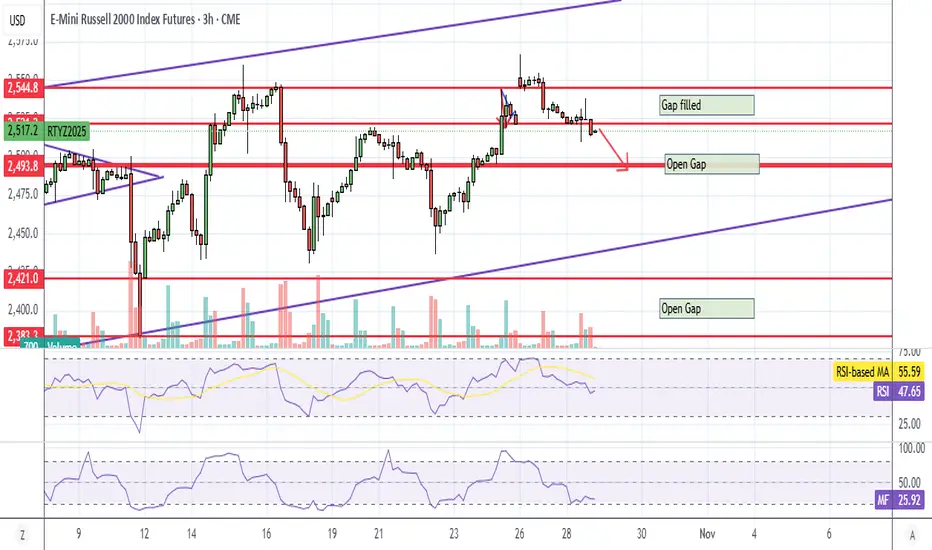
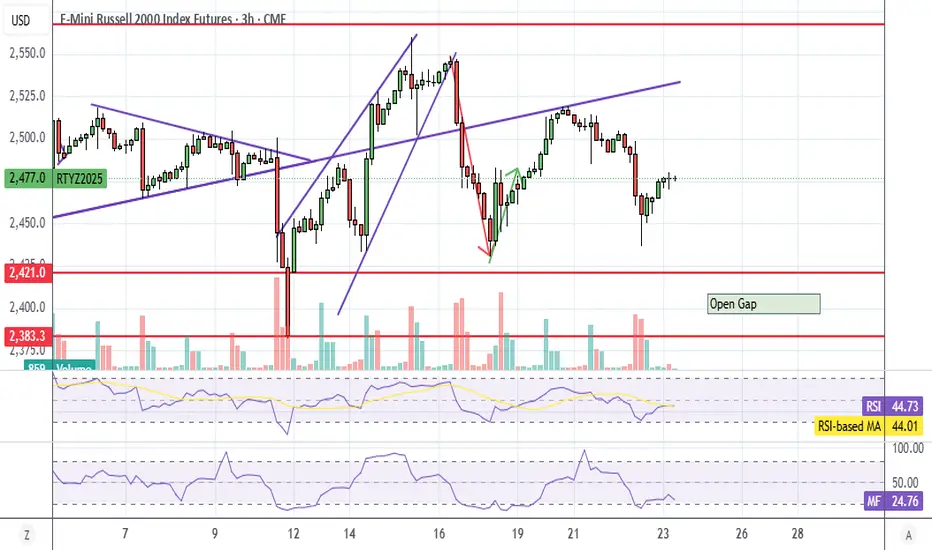
RTY UpdateDoesn't look like the algos are interested in pumping small caps. Appears to be all about NQ right now.
Looking like that small gap below is gonna fill, but watch out for the Fed meeting tomorrow.
Trade ideas
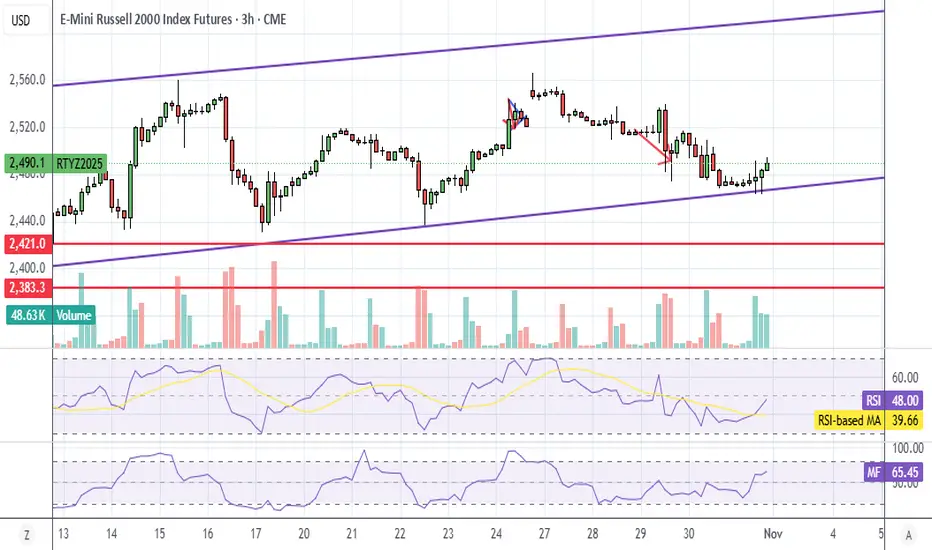
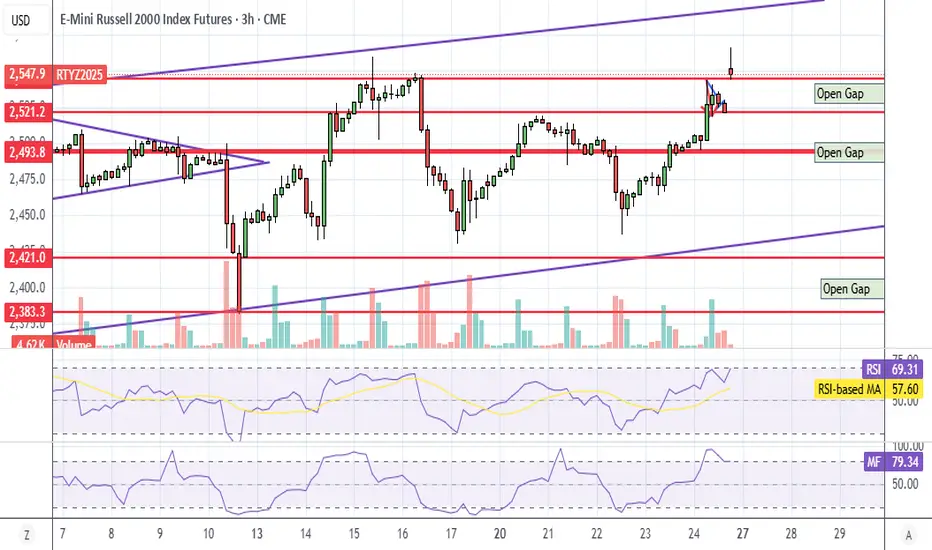
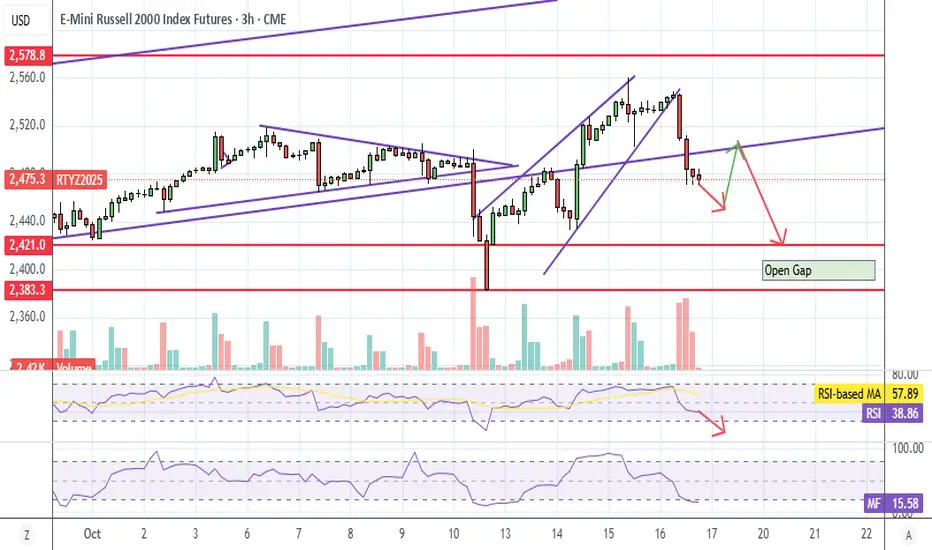
RTY UpdateMFI headed to overbought as expected, movement is small on RSI side. I don't think it'll stay in the upward channel at this rate. Market seems to have lost interest in small caps.
Note that doesn't mean it will tank, mid caps have been sideways since June much like the DAX and rest of Europe.

When Generals Run and Soldiers Nap — The Market’s Odd ParadeEver seen an army march where the generals sprint ahead, but the soldiers just yawn and stay behind?
That’s exactly what’s happening in the U.S. futures battlefield right now.
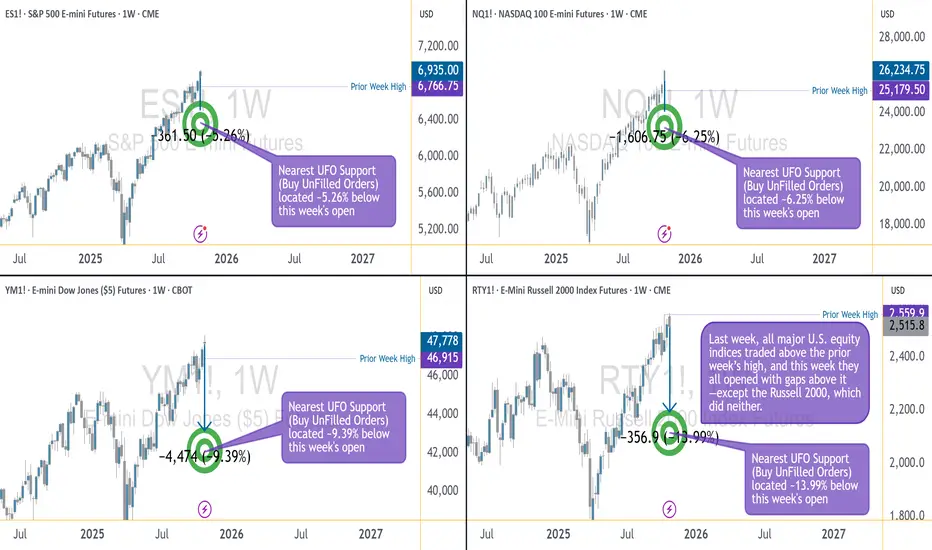
The ES, NQ, and YM — our large-cap “generals” — opened the week above their prior highs, looking ready for victory speeches. But the RTY, representing small caps, is still lagging like it hit the snooze button.
The Breadth Problem
Healthy rallies need everyone on board. When small caps don’t join the charge, it’s like running a marathon with only one leg — you might move forward, but not for long.
That’s why this gap between the big guys and the small ones is called bearish divergence — momentum without muscle.
How Deep Could It Go?
Under the surface, liquidity pockets (UFO supports) show the “landing zones” below price:
ES: ~5% lower
NQ: ~6% lower
YM: ~9% lower
RTY: ~14% lower (!)
Translation: if the market trips, the generals may bruise a knee — but the soldiers could roll down the hill.
Tick, Margin, and Scale
CME index futures come in two flavors — E-minis for the pros, Micro E-minis for precision control:
S&P 500 (ES/MES): tick 0.25 → $12.50 / $1.25; margin ≈ $21K / $2.1K
Nasdaq 100 (NQ/MNQ): tick 0.25 → $5 / $0.50; margin ≈ $30K / $3K
Dow Jones (YM/MYM): tick 1 → $5 / $0.50; margin ≈ $13K / $1.3K
Russell 2000 (RTY/M2K): tick 0.10 → $5 / $0.50; margin ≈ $9K / $0.9K
(Approximate numbers, educational only.)
The Lesson
Breadth divergences don’t “predict” the end of the rally — they just whisper: “Careful, this parade’s out of sync.”
So before chasing the next breakout, remember:
even the best generals can’t win a war if their soldiers stay in camp.
Want More Depth?
If you’d like to go deeper into the building blocks of trading, check out our From Mystery to Mastery trilogy, three cornerstone articles that complement this one:
🔗 From Mystery to Mastery: Trading Essentials
🔗 From Mystery to Mastery: Futures Explained
🔗 From Mystery to Mastery: Options Explained
When charting futures, the data provided could be delayed. Traders working with the ticker symbols discussed in this idea may prefer to use CME Group real-time data plan on TradingView: www.tradingview.com - This consideration is particularly important for shorter-term traders, whereas it may be less critical for those focused on longer-term trading strategies.
General Disclaimer:
The trade ideas presented herein are solely for illustrative purposes forming a part of a case study intended to demonstrate key principles in risk management within the context of the specific market scenarios discussed. These ideas are not to be interpreted as investment recommendations or financial advice. They do not endorse or promote any specific trading strategies, financial products, or services. The information provided is based on data believed to be reliable; however, its accuracy or completeness cannot be guaranteed. Trading in financial markets involves risks, including the potential loss of principal. Each individual should conduct their own research and consult with professional financial advisors before making any investment decisions. The author or publisher of this content bears no responsibility for any actions taken based on the information provided or for any resultant financial or other losses.
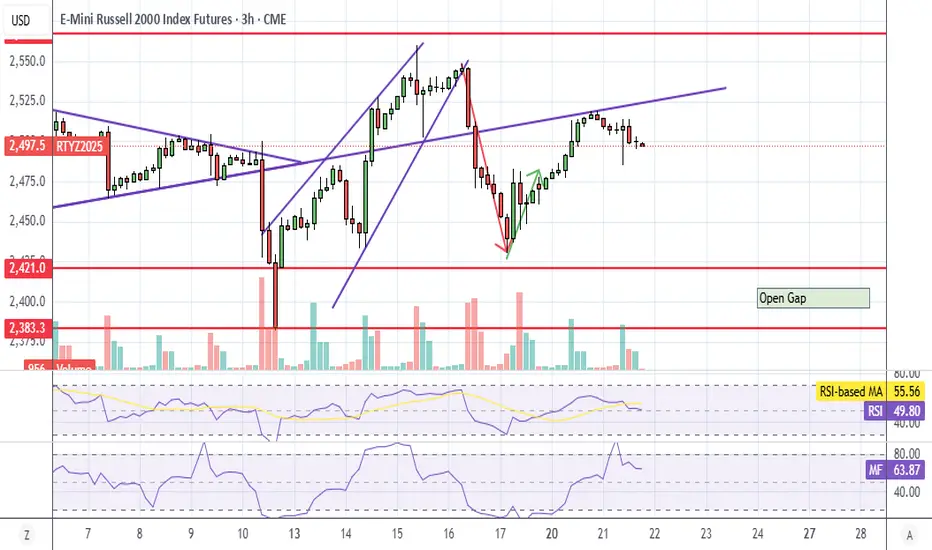
RTY UpdateWell, my arrow was right, but I didn't anticipate the algo pump before the Fed. The algos seem confused now because their pump and dump didn't work thanks to Powell.
Not sure if they complete the dump tomorrow or if they try to pump it back up for trade news Thu night. Or Maybe both, lol. Dump it until RSI and MFI hit oversold, then pump it back up, lol. We've seen that before.
In any case, RTY moving off hours for the first time in a while. Kinda strange they would try to do the China trade pump with small caps again considering the market sold of the pump in one day last time (Monday).

RTY UpdateSmall caps will lose he channel line if it doesn't go up tomorrow. It'll probably just whipsaw sideways though

RTY Small Open GapRTY has a small open gap from the Thurs 1 hr break that does not exist on NQ and ES. Pennant breakdown also looks bearish.
ES did not go oversold on RSI last drop like RTY did, so maybe ES melts up and RTY doesn't? Small caps can diverge from NDX and SPX. Also, RTY didn't break out to a new ATH like the otehr 2 indices.
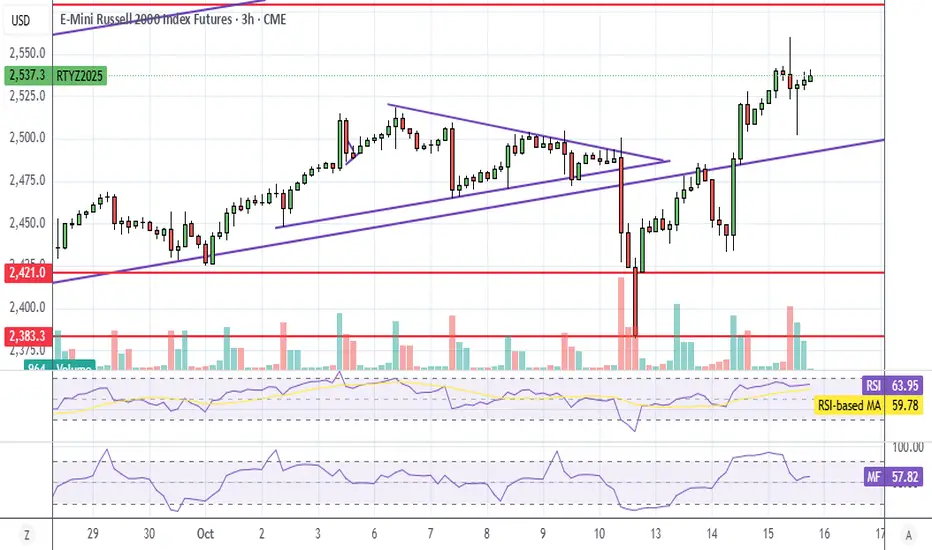
RTY Daily ChannelThis is why I said there might be a melt up next week. RTY has been in the same upward channel since the tariff tank. You figure as bullish as this market is, it needs to hit the top of the channel in a breakout like this.
Will not be shorting IWM next week. Long on shitcoin for the week based on daily indicators.
Since the market broke out, I think it'll be easier to buy the dips when MFI gets oversold on my 3 hr chart than shorting anything.

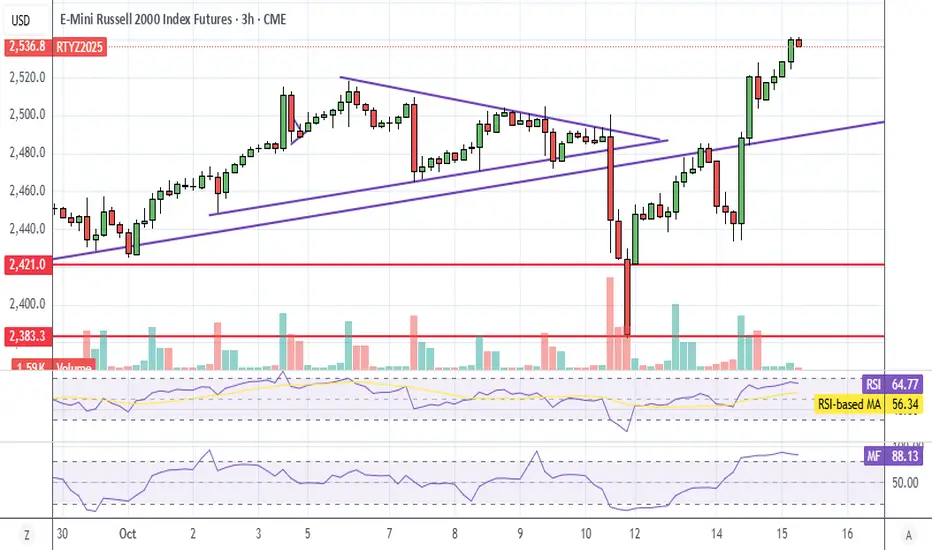
RTY Small cap pennantLooks like small caps made yet another pennant. CPI numbers tomorrow, no position yet. Regardless of which way it breaks, I expect MFI to get overbought tomorrow, possibly premarket.
The open gap below still has me bearish so I'm inclined to believe down. We'll see.

RTY Update I expected the algos to pump small caps today because it's at the bottom of the channel that it's been in since April. Went long on ALB after open but bailed on it when the market rolled over before lunch. Made money though, but chart looked to much like yesterday and teh day before to stay in it.
The problem is that MFI went up a lot but the index didn't go up much. So MFI will hit overbought Monday, possibly even before open.
I'm also bearish on Europe for next week.
100 to 1,000,000 (no sound)went short off of consequent encroachment of 15m wick was hoping to get to the c.e. of 15 m wick low of the day. We weren't able to get it but that's fine. Only GOD is good.


RTY UpdateOverbought with MFI divergence and 3 gaps below but I don't think I will be shorting IWM this week. Too much trade news hype.
RUSS 2K....GOING WHICH WAY? HMMM CME_MINI:M2K1! Bias-Bearish HOWEVER!
Price is hitting some key areas and will show us whether it continues or dumps to key levels.
PP-2522-2514 are fib zones in a FVG so price could most def push higher to the S.O.B above (which is what a majority of signs show). However my personal belief with all the negative news I believe we will have this week, price will take some of these lows out and find a B.O.B below. Thats a theory but like always we let price tell us the true trend and direction! Now what is your theory for this week?
Either way, WE'RE GOING TO GET PAID!

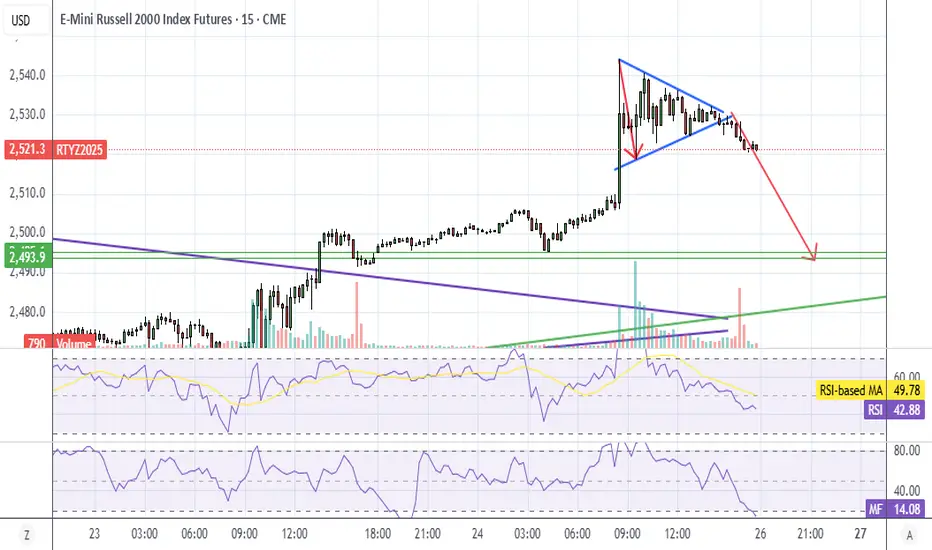
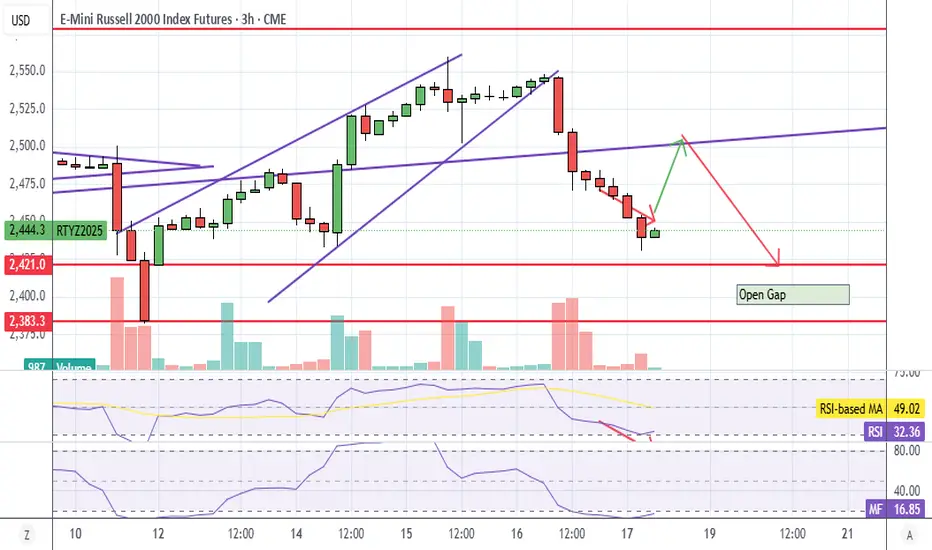
RTY PennantRTY formed a morning pennant and broke down in the afternoon. Target shown.
Small caps have a tendency to fill gaps.

RTY Premarket UpdateMFI is overbought on RTY, ES, and NQ. VIX died last night so not expecting a huge tank unless CPI numbers are really bad.
I think I have a new rule now, TACO gaps don't need to fill, lol. We had 2 previous TACO gaps in the spring that went unfilled as well.
We'll see what happens next week.

RTY UpdateRSI and MFI hit oversold yesterday, missed the dump because I was hungover and cashed out early, lol.
I assume they do a pump on CPI tomorrow.
RTY UpdateMFI went overbought premarket, bought some IWM puts when it filled the gap on the daily index. Will dump it when MFI or RSI hits oversold.
It's really odd, even with that huge gap underneath, the market just doesn't seem very bearish. We'll see tomorrow.
RTY Premarket Update AgainWell, RSI hit oversold and bounced premarket unfortunately for me.
I think it's gonna basically do a H&S pattern as drawn. There are other possibilities such as double bottom on the premarket low, daily index gap fill then down, or a straight tank.

RTY UpdateRSI hit oversold and bounced just as predicted, gonna flip my puts on open and call it a week.
Here's the thing though.... we will only get a good bounce if they left the algos on. Sometimes, they'll shut the algos off during a tank.
So we may or may not get a big bounce.
RTY Update - No TACO on ThursdayI keep saying that futures gap underneath needs to be filled, and small caps have the longest way to go to get there. So I bought some IWM puts this morning, and decided to hold it even though it looked like a repeat of yesterday right after lunch. I figured MFI wasn't oversold, and worst case, I just come out even, lol.
Holding the puts overnight, guessing we see a gap down tomorrow. We probably get a bounce when RSI hits oversold. Not gonna go long at this point until the gap below fills.
Algos control the market and the talking heads just attach a reason to it. They're blaming Dimon for his "cockroach" comment, lol. Financials did take the hardest hit though. Wish I had shorted XLF.
I think the gap below fills by next Friday, but I think you want to wait for a bounce before buying puts. If we get the gap down that I expect, I'm flipping my puts on open. We're gonna see some whipsaw tomorrow.
RTY UpdateWell, we got our pump and dump this morning, a bit earlier than I expected, but they made it so obvious it was hilarious. Hope you made some money off of it.
It did go back up more than I expected, so this could be a melt up. We'll find out tomorrow, I think we gap down because European market, especially DAX doesn't look very bullish. DAX failed to break out, could come back down.
Looks like retail pump is over, I shorted KSS because XRT options have no liquidity. There's literally zero visible bids. I looked at it this morning and remembered why I don't trade it. I guess they had to pump it because HD was way oversold.
Speaking of which, now that retail sector pump is over, I just noticed that they aren't pumping RTY as hard as yesterday (vs SPX futures ES) or maybe it's because of financials.
RTY Premarket UpdateLooks like RTY did indeed get TACO Tuesday, they pumped futures up 1%. RSI still not overbought, so will wait until the afternoon or possibly tomorrow to short something, Might get back into the KSS trade if it looks good.
Keep an eye on XRT (retail) as well.
Trade War? No, we want TACO! RTY UpdateSmall caps went full out into the TACO trade, they pumped the crap out of retail today.
The other indices are acting as if the gap below needs to fill, small caps totally ignored it. That means it's got the most to go down if the gap does need to be filled.
Tomorrow looks like a pump and dump setup, RSI probably hits overbought, then reverses down.
