BRITISH POUND index continue lowyar to finish wava 5 .Take care and good luck.
Thank you for your support
Trade ideas

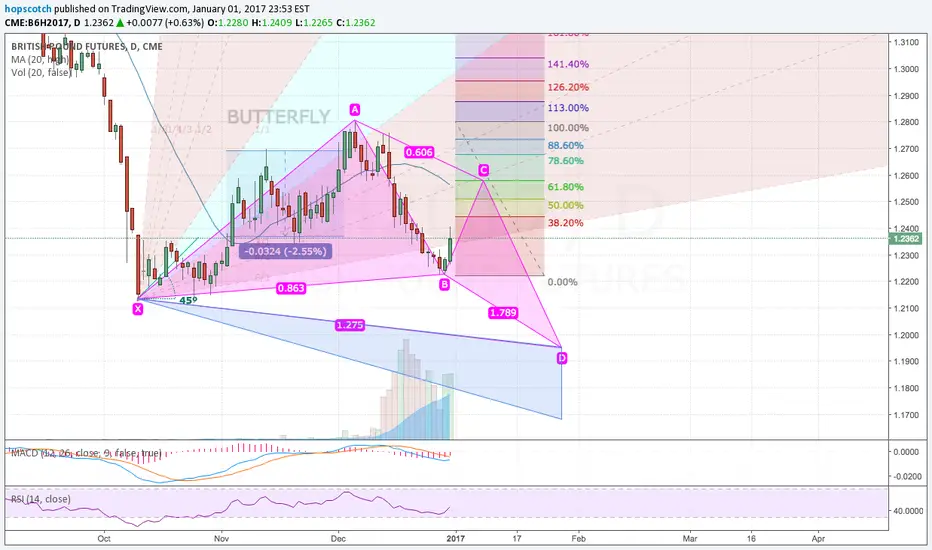
March British Pound creating a bullish ButterflyMarch British Pound is trying to create a bullish Butterfly pattern. Position BC still to be determined in the next week, then possible sell back to 1.1956. Gann Fan deterioration is developing here and 4/1 line could be support for retreat downwards if USD strengthens. False break out over the 20 day moving average is also possible if this market reaches 61.8 retracement of the BC leg.
British Pound Daily AnalysisA potential Elliott wave pattern forming from the start of the Brexit crash in July, we can see the proper Elliott wave formation thus far, potentially entering the 5th wave down. Also a Head and Shoulders pattern further agrees with a 5th wave push down, where we can see a Fibonacci cluster zone around the 1.21 support zone which was set at the October flash crash.

British pound - Buy setupHere we see an impulsive move up to start the week, followed by a pullback to the 61.8 Fibonacci level. Watching to see if price respects the blue trendline and continues a move higher. Also watching the red zones which are previous resistance + Fibonacci extension areas for potential take profit targets.

British Pound analysis - SellHere we see a few sell signals including:
- Head and shoulders forming, waiting for break of trend line
- price falling below the 13 and 21 EMA
- Fibonacci clusters/target zones at:
1.225
1.213
1.203
- Recent breakout of USD
Additionally, the bearish reaction to the better than expected retail sales release during this mornings London session, may indicate the overall bearish tone of traders on the currency.

British Pound hourly analysisHere we see price moving off of a larger time frame trend support line which is also a 78.6 Fibonacci retracement. If price breaks the green dash trend line, after a retest look to go long, if it fails to make a higher high and continues down, watch for a retest of the larger timeframe trendline or break for a longer term potential break down.


M6B1! 8/7/16 4hrThis is the futures of GBPUSD, so price is different then spot.
We are coming into a great short-term buy.


British Pound testing support (monthly chart)British Pound testing support (monthly chart). If support holds bull trend ahead. Monitor.


