Trading Rejection Strategy- A Visual Backtest💡 Overview
Here is everything you need to know about the strategy. But before you study it any further, all the visuals are at the end of this post- so don't miss that part.
This setup is built upon simple beliefs:
▶Price always remembers its key levels- Previous Day’s High (PDH), Previous Day’s
Related futures
Day 60 — Trading Only S&P Futures | 10-for-10 Green TradesStick around — at the end, I’ll break down the key levels I’m watching for tomorrow. Let’s go.
Recap & Trades
Day 60 — another clean session.
We started the day with a bearish structure, so my plan was simple: wait for price to reach the 1-minute MOB and short it.
Every trade lined up with VX Algo

ES UpdateRTY filled the gap, ES left open a small 1 pt gap, and NQ did not fill the gap at all. Really strange.
Anyways, 3 hr indicators moving up and Europe rallying. I'm not bullish though, might just take the week off.

Day 58 — Trading Only S&P Futures | +$304 & Easy FOMC GainsRecap & Trades
Day 58 — clean and easy.
We had some conflicting signals early, but once the structure aligned, it became a straightforward session.
The key takeaway today was how FOMC movement tends to cap between 30–60 points, which makes it easy to plan trades if you size stops properly.
Overall,

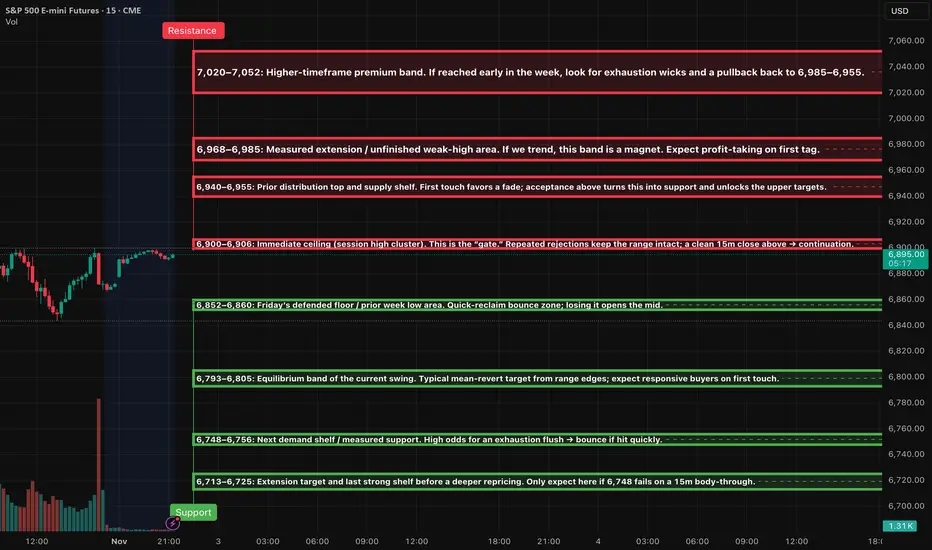
ES (SPX, SPY) Week Ahead Analysis, Nov 3rd - Nov 7thMarket Context
The price is currently positioned just below a key near-term resistance level at 6,900–6,906, following a sharp reversal on Friday from around 6,845. The daily and 4-hour structures indicate an incomplete "weak-high" area above, but the 1-hour momentum has just shifted upward from ov
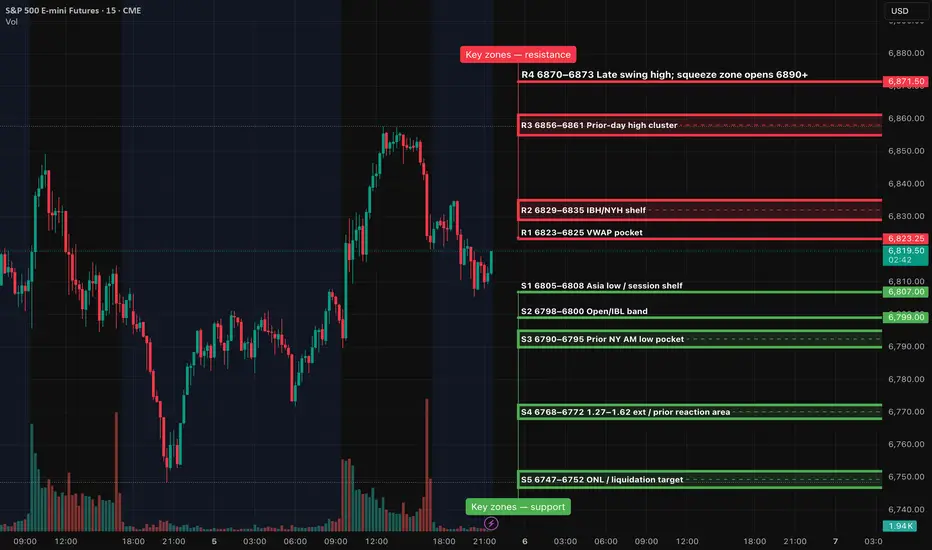
ES (SPX, SPY) Analysis, Key Zones, Setups for Thu (Nov 6)The daily trend has softened following the formation of a lower high. Analysis of the 4-hour chart indicates a bounce that encountered resistance near the 6860–6870 range, subsequently retreating to the 6810 support level. As we look ahead to tomorrow's trading, consider the 6805–6808 range as the k
ES (SPX, SPY) Analysis, Levels, Setups for Wed (Nov 5th)News & timing (ET): ADP 8:15; ISM Services PMI 10:00; EIA Crude 10:30. Release status: all three are scheduled to run (not shutdown-affected).
Bias & context: Short-term trend remains lower after a sequence of 15m lower-highs/lows and failure to hold 6,793–6,805. Expect dip-buys to be sold unle

ES Supply Demand Long SignalStock Index:
- Yesterday, ADP Employment came out 42k (+11k more than the forecasted number) and ISM Services came out 52.4 (+1.7 more than the forecasted number), making stocks rise. Other News, US challenger October job cuts jump 175.3% to a 7-month high at 153.074k (prev. 54.064k in September).

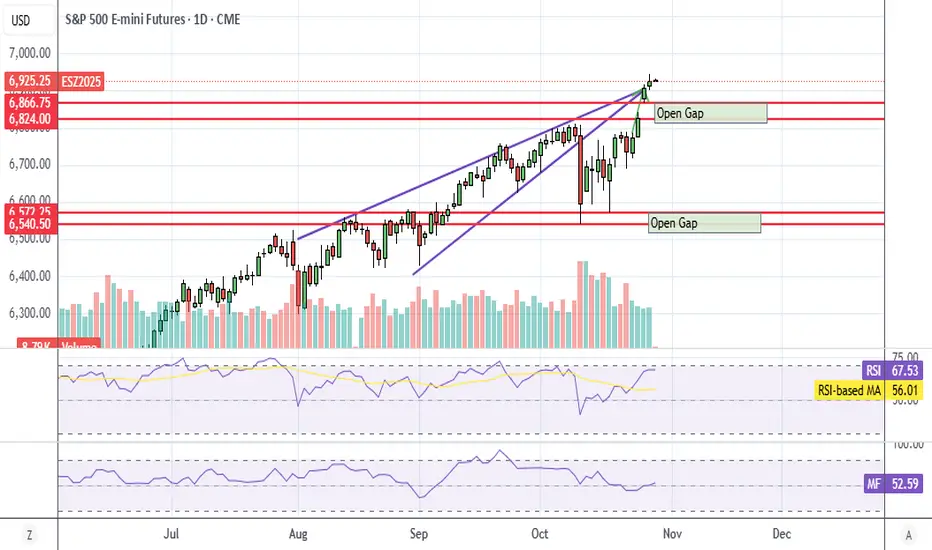
ES Daily Chart - Not Overbought YetLooks the ES is not overbought on the daily yet, so believe it or not, there's still room for a Fed pump or a China trade deal pump.
Wow.
I looked because futures are slightly green right now. Probably best not to short anything until after the Fed meeting. Watch out for China trade news Thu nig
Week 11.03 - 11.07 Prep Last Week :
Last week we opened on a gap above Value and made a push over Edge top where we found our top and larger sellers for the week. Return to above VAL provided selling back into and eventually under the Edge. Holding under the Edge got us under MAs and changed the trend from uptrend to down

See all ideas
A representation of what an asset is worth today and what the market thinks it will be worth in the future.
Displays a symbol's price movements over previous years to identify recurring trends.
Frequently Asked Questions
The nearest expiration date for Micro E-mini S&P 500 Index Futures (Jun 2024) is Jun 21, 2024.
Traders prefer to sell futures contracts when they've already made money on the investment, but still have plenty of time left before the expiration date. Thus, many consider it a good option to sell Micro E-mini S&P 500 Index Futures (Jun 2024) before Jun 21, 2024.