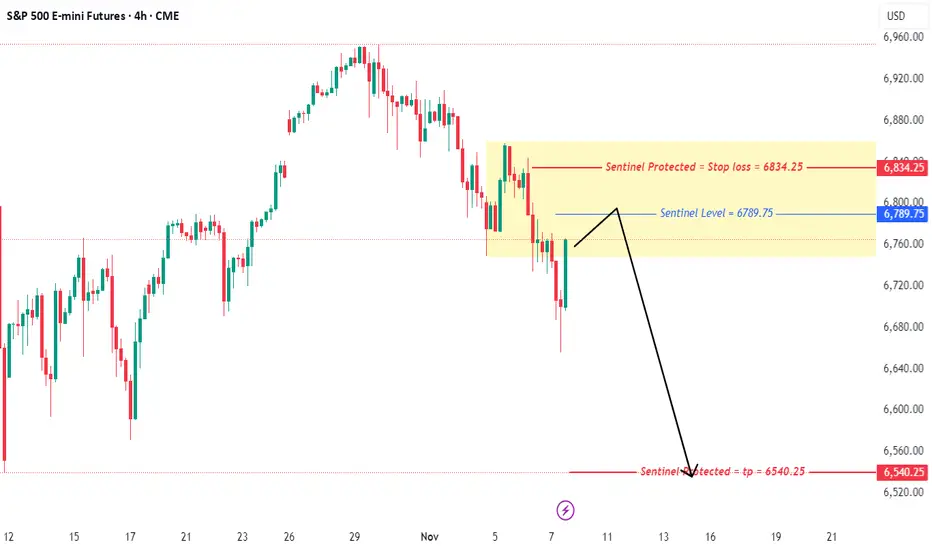
Trendline Support hitPrice has pulled back into a key technical zone and is now testing a long-term rising trendline that has held multiple times throughout the past several weeks. This trendline has acted as a structural support area, aligning with prior swing lows and validating the broader uptrend structure.
Today’s
Related futures
ES (SPX, SPY) Analysis, Levels, Setups, for Fri (Nov 14th)
Today’s session revealed a marked risk-off sentiment as the market began to discipline leading sectors, notably large-cap tech, AI, semiconductors, and high-beta growth stocks. This correction coincided with a reassessment of expectations for near-term Federal Reserve easing and an environment defi

I Made $977 Trading S&P Futures | Day 67 Market BreakdownI made $977 today trading S&P Futures, catching both sides of the move — shorting early weakness, then flipping long after a confirmed bullish structure shift.
The VX Algo signals lined up perfectly with the government shutdown resolution, giving clear reads on momentum reversals. Patience, structu

ES UpdateTrying to break through the resistance line, not sure what's gonna happen tonight.
Open gap always makes me bearish, so I did not go long again after I dumped my calls on open. Just waiting for MFI to get overbought so I can buy puts. Guessing that will happen by Wed open.
Not sure why foreign m

Analysis of the ES for the week of November 10 to 14, 2025Analysis based on a deep mathematical and scientific understanding of price action, particularly for my two markets NQ & ES. Looking forward to reading your comments.
ES (SPX, SPY) Analysis, Key Levels, Setups for (Nov 11th)S (Dec) Plan for Tue, Nov 11 — Level-KZ Protocol (15/5/1).
Bias is constructive while trading above the 6,838–6,845 range; the first test into 6,880–6,900 serves as a decision point. Thinner liquidity is expected around the U.S. holiday, so execute trades only within NY kill zones.
Setups (trade

Greedy Short Gone Wrong | Day 66 Trading S&P FuturesI started the day strong, shorting the 6830 resistance level for quick profits — but got greedy and went for more at 6852, thinking the market couldn’t push higher.
It did. I got squeezed, gave back all my gains, and ended the day basically flat.
Some days remind you: the market doesn’t owe you any

Do you get Deja vu?Some say that history is repeating itself according to the dot-com bubble and the nifty fifty crash that led to a dark period in the US market. Why are we scared that the same situation will happen again? For starters, The Mag 7 who is consisted of the seven biggest company of the S&P 500 have a com

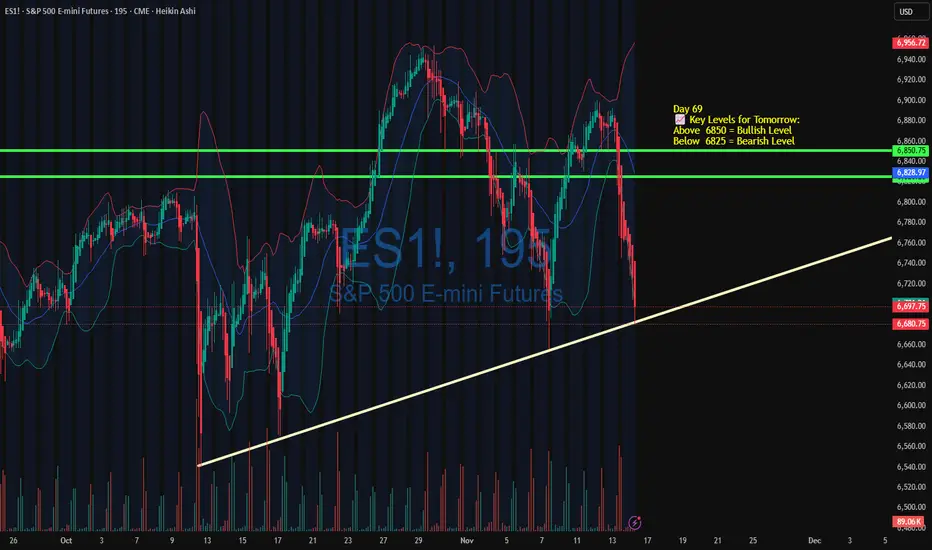
Market Crashed — I Stayed Calm & Made $338 | Day 69 RecapMade $338.44 today trading S&P Futures on a day where almost everything was red.
The market opened with a bearish structure, and even without big headlines, selling pressure stayed strong all morning.
I decided to wait for the 6750 zone — a strong technical support — and caught a clean dead cat boun

Day 68 — Clean Entries, No Chasing | +$251 Trading S&P FuturesMade $251.50 today trading S&P Futures — a clean, low-stress day built around precision and patience.
I shorted the 6892 resistance zone early when structure flipped bearish, then sat out most of the chop until we got a confirmed X3 buy signal at 12:30 to go long.
Days like this are all about disci

See all ideas
Summarizing what the indicators are suggesting.
Neutral
SellBuy
Strong sellStrong buy
Strong sellSellNeutralBuyStrong buy
Neutral
SellBuy
Strong sellStrong buy
Strong sellSellNeutralBuyStrong buy
Neutral
SellBuy
Strong sellStrong buy
Strong sellSellNeutralBuyStrong buy
A representation of what an asset is worth today and what the market thinks it will be worth in the future.
Displays a symbol's price movements over previous years to identify recurring trends.
Frequently Asked Questions
The current price of Micro E-mini S&P 500 Index Futures (Mar 2026) is 6,815.50 USD — it has risen 0.11% in the past 24 hours. Watch Micro E-mini S&P 500 Index Futures (Mar 2026) price in more detail on the chart.
The volume of Micro E-mini S&P 500 Index Futures (Mar 2026) is 3.67 K. Track more important stats on the Micro E-mini S&P 500 Index Futures (Mar 2026) chart.
The nearest expiration date for Micro E-mini S&P 500 Index Futures (Mar 2026) is Mar 20, 2026.
Traders prefer to sell futures contracts when they've already made money on the investment, but still have plenty of time left before the expiration date. Thus, many consider it a good option to sell Micro E-mini S&P 500 Index Futures (Mar 2026) before Mar 20, 2026.
Open interest is the number of contracts held by traders in active positions — they're not closed or expired. For Micro E-mini S&P 500 Index Futures (Mar 2026) this number is 5.62 K. You can use it to track a prevailing market trend and adjust your own strategy: declining open interest for Micro E-mini S&P 500 Index Futures (Mar 2026) shows that traders are closing their positions, which means a weakening trend.
Buying or selling futures contracts depends on many factors: season, underlying commodity, your own trading strategy. So mostly it's up to you, but if you look for some certain calculations to take into account, you can study technical analysis for Micro E-mini S&P 500 Index Futures (Mar 2026). Today its technical rating is sell, but remember that market conditions change all the time, so it's always crucial to do your own research. See more of Micro E-mini S&P 500 Index Futures (Mar 2026) technicals for a more comprehensive analysis.