Day 64 — Trading Only S&P Futures | 6/7 Signal AccuracyRecap & Trades
Day 64 — a clean, structured trading day.
Started small with team trades from Bia’s setups, and when we hit the bottom of the day, I saw the double bottom support and multiple buy signals align.
That was the cue. I went long, set a 20-point trailing stop, and let the algo handle the rest.
Sometimes, the best play is not to overtrade — just trust your plan.
Lesson & Mindset
When you’re in sync with your system, execution becomes effortless.
The double bottom setup plus confluence from team signals made this a high-confidence day.
This is how professional consistency looks — smaller, cleaner, smarter.
News & Levels
Markets dipped after fresh layoff reports hit — Dow down 300, VIX spiked — but the bounce off key support shows resilience.
Tomorrow’s levels: Above 6835 bullish, below 6810 bearish.
Trade ideas

ES UpdateTrying to break through the resistance line, not sure what's gonna happen tonight.
Open gap always makes me bearish, so I did not go long again after I dumped my calls on open. Just waiting for MFI to get overbought so I can buy puts. Guessing that will happen by Wed open.
Not sure why foreign markets gapped up because of the shutdown ending, and the market didn't tank because of the shutdown so there's really no reason for it to rally now that it's ending..... so I'm expecting a pump and dump.
Sorry, no arrows today.

Analysis of the ES for the week of November 10 to 14, 2025Analysis based on a deep mathematical and scientific understanding of price action, particularly for my two markets NQ & ES. Looking forward to reading your comments.
I Made $911 Trading S&P Futures | Day 65 Market BreakdownI made $911 today trading S&P Futures.
It didn’t come easy — I barely slept last night, and my overnight orders failed around 3 AM.
So I reset, stepped back, and waited for the one setup I’ve been tracking all week — the 6666 support bounce.
Here’s how it played out, and what the VX Algo system showed me before the move.
Pre-market sentiment was mixed. We had lingering shutdown headlines and low liquidity early in the session.
But structurally, the market was leaning bullish on higher timeframes — meaning any deep dip would likely get bought.
I had my eye on 6666 since last Friday as a key level.
That’s where gamma support, 5-min MOB, and prior structure all aligned — a textbook reversal zone.
When we got the VXAlgo ES X1 and NQ X3 buy signals near that level, I went long.
Used smaller sizing at first, added into strength, and locked profits using a trailing stop.
The bounce hit perfectly, and I was able to walk away green.
Even though I made money, I caught myself getting a bit greedy lately.
It’s a reminder — consistency comes from execution, not expectation.
The market will give you what it gives — your job is to wait for alignment and trade clean.
3 out of 4 signals worked today for at least 5 points each.
Tomorrow’s levels: Above 6822 bullish, below 6782 bearish.

Greedy Short Gone Wrong | Day 66 Trading S&P FuturesI started the day strong, shorting the 6830 resistance level for quick profits — but got greedy and went for more at 6852, thinking the market couldn’t push higher.
It did. I got squeezed, gave back all my gains, and ended the day basically flat.
Some days remind you: the market doesn’t owe you anything.
VX Algo had 4 out of 5 clean signals today — structure nailed the direction early.
Tomorrow’s levels: Above 6810 bullish, below 6780 bearish.

ES1 technical trade ideas for this week11/10/25-ES1 technical trade ideas for this week11/10/25
well be looking forward to a short pull back in the 6900-6920 range has a high selling pressure in those lv

Do you get Deja vu?Some say that history is repeating itself according to the dot-com bubble and the nifty fifty crash that led to a dark period in the US market. Why are we scared that the same situation will happen again? For starters, The Mag 7 who is consisted of the seven biggest company of the S&P 500 have a combined market cap of 22 trillion, which mean around 35-37% of the whole index… In fact, the same thing happened before the dot-com crash and the nifty fifty catastrophe. They were traded 40 times their valuations, so the price-to-earning ratio wasn’t considered healthy. Plus the biggest companies in the Nifty fifty composed of around 25% of the entire S&P.
But… The dot-com crash was a lot due to many start up being invested in and not giving the merchandise they should’ve, leading to many bankruptcy. The Nifty fifty was composed of businesses that people thought were untouchable, like McDonald’s, Coca-Cola, Polaroid, Disney and more. A bunch of people invested blindly in those businesses thinking they’ll just never stop growing… but those company could not innovate anymore. So once they showed lower than expected gains months after months they couldn't do anything else than watch people leaving with the pedal to the metal which led to atrocious losses.
Now, do we have the same pattern? It is true that the Mag7 is taking a huge chunk of the S&P, as they should, but can we anticipate a sell off?
If you analyze the facts; Businesses invest billions day after day into AI companies who can boost their platform and propel them in front of the innovation race. We can’t stop being amazed by every giant step they take in AI automatization and in the progress of the LLMs. Months after months those companies innovate and give back to their investor an excellent ROI. They expand and try to see what’s gonna be the next best thing and come out on top. Tech is not the same as those nifty fifty and dot com businesses who were over traded (which is a misconception, cause the Mag7 is also “over traded” but it is just a indicator of high liquidity and investor interest not necessarily an imbalance in their whole market value.) But i still mention it cause it is a an argument many people employ.
So ask yourself: is what’s happening with AI the same as the nifty fifty or the dot-com bubble, or did AI just took the S&P, those Mag7 companies or should i just say the world to an other level?
I guess only time will tell, till then,
Your friendly day trader,
Esteban.

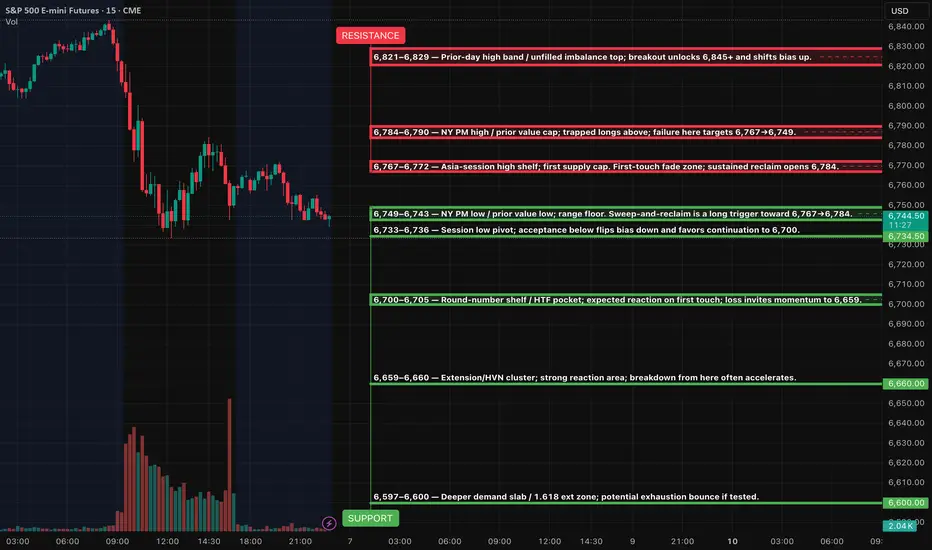
ES (SPX, SPY) Analysis, Key Zones, Setups for Thu (Nov 6)The daily trend has softened following the formation of a lower high. Analysis of the 4-hour chart indicates a bounce that encountered resistance near the 6860–6870 range, subsequently retreating to the 6810 support level. As we look ahead to tomorrow's trading, consider the 6805–6808 range as the key intraday “threshold” while the 6830–6835 zone will serve as the first significant resistance level to watch.
Setups (Level-KZ Protocol 15/5/1; NY KZ 09:30–11:00 & 13:30–16:00 ET)
1. Acceptance long from support
Trigger: 15m holds S1 6805–6808 → 5m reclaim 6823 VWAP → 5m close above 6830.
Entry: 6831–6834 on first 1m HL after the 5m re-close.
SL: 6821 (hard) or 15m trigger-wick −0.25–0.50 pt.
TP1: 6856–6861 (≥2R gate).
TP2: 6870–6873.
TP3: 6890–6895 if squeeze.
Management: No partials before TP1; at TP1 close 70%, set 30% runner to BE; no trail before TP2.
2. Rejection fade short from resistance
Trigger: Pop into 6856–6861, stall, then 5m full-body re-close back below 6856 with 1m LH.
Entry: 6850–6854.
SL: 6864.25 (hard) or 15m wick +0.25–0.50.
TP1: 6830–6832.
TP2: 6823 VWAP.
TP3: 6805–6808.
Note: If 5m re-claims 6861 after entry, exit early; setup invalid.
3. Breakdown continuation short
Trigger: 5m body close below 6805 with retest fail from beneath.
Entry: 6800–6803.
SL: 6810.75 (hard) or 15m wick +0.25–0.50.
TP1: 6790–6795.
TP2: 6768–6772.
TP3: 6747–6752.
Note: If reclaim and 5m closes back above 6808, cancel.
4. Breakout continuation long
Trigger: 5m acceptance above 6861 and hold on retest.
Entry: 6862–6865 on first 1m HL.
SL: 6853.25.
TP1: 6870–6873.
TP2: 6885–6890.
TP3: 6905–6912.
Note: If acceptance fails (5m body back under 6861), flip bias back to fade R3.
Event map for Thursday (ET)
FOMC meeting Day 1 (runs Thu–Fri; Fed is not affected).
EIA Weekly Natural Gas Storage 10:30.
Most BLS/DOL macro releases (e.g., Productivity & Costs, Weekly Jobless Claims) are suspended during the shutdown. Expect fewer 8:30 prints and thinner liquidity until the cash open.
ES (SPX, SPY) Key Levels, Analysis and Setups for Fri (Oct 7th)EVENTS (ET, unaffected by shutdown): 3:00am NY Fed Williams speech; 7:00am Fed Vice Chair Jefferson speech; 10:00am Univ. of Michigan Consumer Sentiment (prelim); 2:00pm Fed G.19 Consumer Credit. Employment Situation report is postponed due to the shutdown (treat as no 8:30am print).
SETUPS (Level-KZ Protocol 15m→5m→1m)
ES LONG (A++) — 6,767 reclaim → 6,784 → 6,821
Entry: 6,768–6,772 after a 5m close and hold above 6,767 with 1m HL confirmation.
Hard SL: 6,755.
TP1: 6,784. TP2: 6,821. TP3: 6,845 if momentum persists.
ES SHORT (A++) — 6,784–6,790 pop-and-fail → 6,749 → 6,733
Entry: 6,782–6,789 on a 15m rejection close back inside the band followed by a 5m re-close down.
Hard SL: 6,796.
TP1: 6,767. TP2: 6,749. TP3: 6,733.
ES LONG (A+ Bounce) — 6,742–6,749 sweep & instant reclaim → 6,767 → 6,784
Entry: 6,750–6,753 after a swift reclaim and 1m HL.
Hard SL: 6,740.
TP1: 6,767. TP2: 6,784. TP3: 6,821.
ES SHORT (A+ Continuation) — 6,733 breakdown & retest → 6,700 → 6,659
Entry: 6,732–6,728 on 15m acceptance below 6,733 and a 5m LH retest.
Hard SL: 6,744.
TP1: 6,700. TP2: 6,659. TP3: 6,597.
KILL-ZONES & MANAGEMENT
Asia 20:00–00:00 optional and lighter size, London 02:00–05:00 optional, NY AM 09:30–11:00 primary for entries, Lunch 12:00–13:00 manage only, NY PM 13:30–16:00 allows second push or reversal plays. Daily guardrails: stop at −2R net or lock in ≥+3R net.
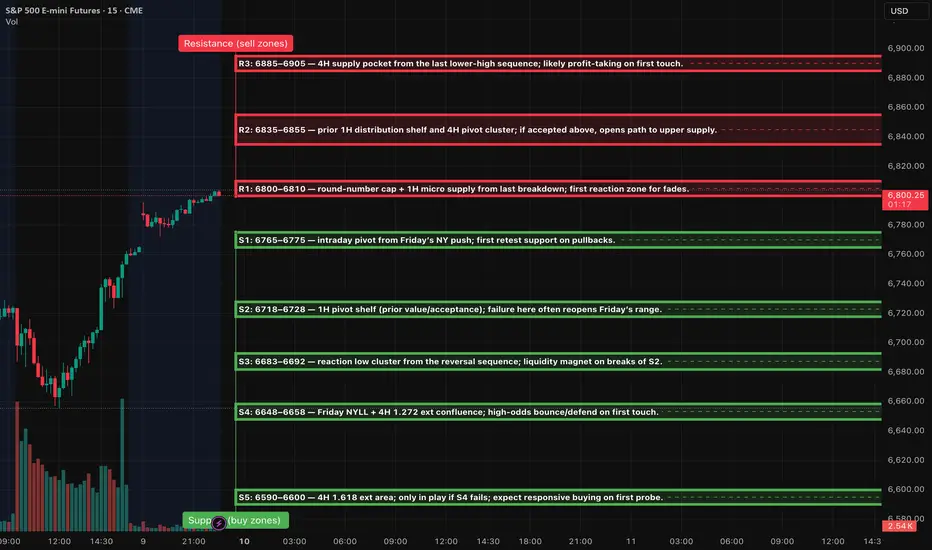
ES (SPX, SPY) Week Ahead Analysis, Levels (Nov 10th - 14th)Context (HTF)
Price action has shown a notable rebound from the 6655 level, currently approaching the 6800 to 6810 range, which is characterized by recent supply identified on the 1-hour and 4-hour charts. Despite the ongoing lower-highs structure observed on the 4-hour timeframe, momentum appears to be shifting positively following Friday’s significant low. Traders should anticipate a period of two-way trading early in the week, likely within the 6650 to 6850 corridor, until mid-week economic data provides clearer direction.
Setups (Level-KZ Protocol 15/5/1)
1) Rejection Fade @ 6800–6810 (Tier-1 if first touch)
15m rejection back inside → 5m re-close below with LH → 1m first pullback fail.
Entry: 6798–6808 on 1m fail. SL: 15m wick-high +0.25–0.50.
TP1: 6768–6775 (S1). TP2: 6723 (S2). Viability gate: TP1 ≥ 2.0R using the 15m-wick stop.
2) Acceptance Continuation > 6810
15m full-body close above → 5m pullback holds 6805–6810 → 1m HL entry.
Entry: 6808–6812. SL: 6794–6798 (15m wick).
TP1: 6838–6848 (R2). TP2: 6885–6905 (R3). No trailing before TP2; at TP1 close ~70%, set runner to BE.
3) Quick-Reclaim Bounce @ 6765–6775 (Tier-2)
Sweep S1 → instant reclaim on 5m → 1m HL.
Entry: 6767–6774. SL: 6756–6759.
TP1: 6798–6810. TP2: 6835–6845.
4) Exhaustion Flush Bounce @ 6648–6658 (Tier-3)
Capitulation wick into S4 → 5m reversal signal → 1m HL.
Entry: 6651–6657. SL: 6639–6642.
TP1: 6686–6692. TP2: 6718–6728.
What can move ES this week (keep risk light around release windows)
• Tue (Nov 11): Veterans Day — equities open, U.S. bond market closed; liquidity can be thinner.
• Thu (Nov 13, 8:30 ET): October CPI.
• Thu (Nov 13, 8:30 ET): Initial jobless claims (weekly).
• Fri (Nov 14, 8:30 ET): October PPI and Advance Retail Sales.
• Fed speakers/boards: See the Fed’s official calendar for any added talks this week.
• Earnings of note: Several large caps report mid-week (e.g., Cisco; Disney). Expect single-name volatility spillover.
Notes for execution: mark the zones on 15m; wait for your 15→5→1 confirmation sequence; enforce the 2.0R viability gate using the 15m wick stop; no partials before TP1; max two tries per level.
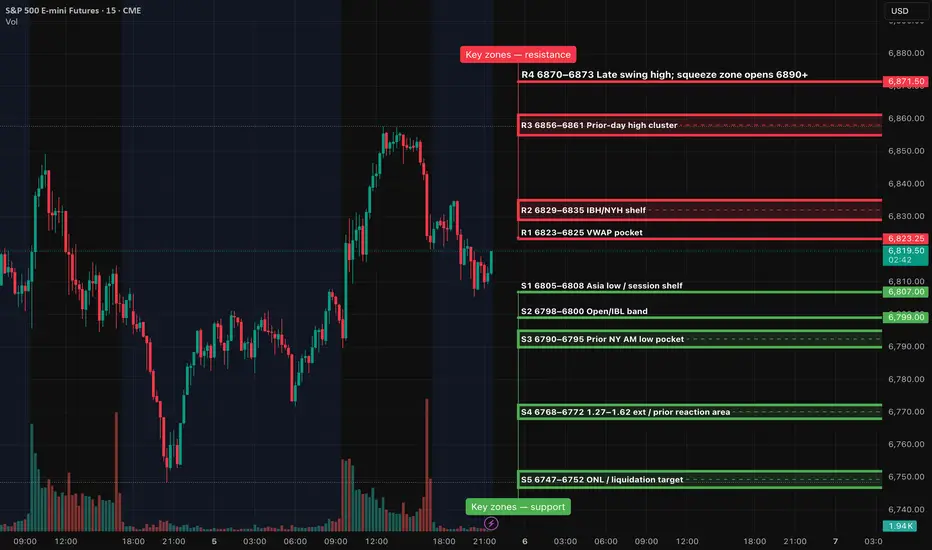
ES (SPX, SPY) Analysis, Levels, Setups for Wed (Nov 5th)News & timing (ET): ADP 8:15; ISM Services PMI 10:00; EIA Crude 10:30. Release status: all three are scheduled to run (not shutdown-affected).
Bias & context: Short-term trend remains lower after a sequence of 15m lower-highs/lows and failure to hold 6,793–6,805. Expect dip-buys to be sold unless 6,860+ is reclaimed and defended.
Overnight → NY forecast:
Base path: probe 6,748–6,756 into Asia/London, bounce to 6,793–6,805, then decide at NY open. Lose 6,748 on momentum and the magnet becomes 6,713–6,725.
Alt squeeze: reclaim and hold above 6,852–6,860, push to the 6,900–6,906 “gate”, then 6,940–6,955. Only above 6,955 can 6,968–6,985 and 7,020–7,052 come into play.
Bear extension: clean break and 15m body acceptance below 6,713–6,725 opens 6,660s (deeper extension) before any meaningful bounce.
Key-Zones
Resistance (top→bottom):
7,020–7,052 premium band (W3 major; first touch favors profit-taking)
6,968–6,985 measured-extension / weak-high pocket (W2)
6,940–6,955 prior distribution top / supply shelf (W2)
6,900–6,906 immediate ceiling “gate” (W2 pivotal)
Support (top→bottom):
6,852–6,860 defended floor / quick-reclaim bounce zone (W2)
6,793–6,805 swing-equilibrium magnet (W2)
6,748–6,756 next demand shelf / measured support (W2)
6,713–6,725 extension target and last strong shelf before deeper repricing (W3)
Setups (Level-KZ Protocol 15/5/1)
Rejection Fade (short): sell 6,852–6,860 or 6,900–6,906 after a 15m rejection close back inside → 5m re-close in your favor; use the 15m wick +0.25–0.50 pts as hard SL. TP1 = next opposing MAJOR level (e.g., 6,805 then 6,756).
Acceptance Continuation (long): only after a full-body 15m close above 6,860 and a 5m pullback that holds; target 6,900–6,906 → 6,940–6,955; invalidate on a 15m close back below 6,852.
Quick-Reclaim Bounce (Tier-2): flush into 6,748–6,756, instant reclaim on 1–5m, enter on first HL; TP1 = 6,793–6,805; invalidate on a 15m close back below the shelf.
Exhaustion Flush (Tier-3): if 6,748 breaks with force and a 15m body holds below, sell the first 1–5m LH; TP1 = 6,713–6,725; runner eyes 6,660s if momentum persists.
Risk & management (use consistently):
Instructions: only take a setup if TP1 ≥ 2.0R using the 15m-wick SL.
At TP1: close 70%, set 30% runner to BE; runner aims TP2 at the next major level.
No trailing before TP2. Time-stop 45–60m if neither TP1 nor SL hits. Max 2 attempts per level per session.
Kill-zones (ET): London 02:00–05:00 (optional ½–¾ size); NY AM 09:30–11:00 (primary); NY PM 13:30–16:00 (primary). Manage only 12:00–13:00.
What flips decision:
Bullish: sustained 15m acceptance above 6,860 then above 6,906 turns path toward 6,940–6,955 → 6,968–6,985.
Bearish: 15m acceptance below 6,748 invites 6,713–6,725; losing that level opens 6,660s before any notable bounce.

ES (SPX, SPY) Analysis, Key Levels, Setups for (Nov 11th)S (Dec) Plan for Tue, Nov 11 — Level-KZ Protocol (15/5/1).
Bias is constructive while trading above the 6,838–6,845 range; the first test into 6,880–6,900 serves as a decision point. Thinner liquidity is expected around the U.S. holiday, so execute trades only within NY kill zones.
Setups (trade the level → next level; 15m→5m→1m sequence)
Long — Bounce at 6,838–6,845: sweep/quick-reclaim → 5m re-close → 1m HL entry. Hard SL below 6,830 wick. TP1 6,872–6,880, TP2 6,900, TP3 6,930. Viability gate: TP1 ≥ 2.0R.
Long — Acceptance above 6,900: full 15m body close >6,900 → hold the retest → 1m HL. SL below trigger wick. TP1 6,930, TP2 6,955–6,970, runner eyes weak-high cleanup.
Short — Rejection fade 6,900–6,930: wick through → 15m close back below 6,895 → 5m LH. SL above session high. TP1 6,872, TP2 6,845, TP3 6,805; lose 6,805 and momentum can slide toward 6,770 then 6,733.
News & session conditions (ET)
U.S. Veterans Day — equities open; U.S. bond market closed; U.S. macro slate is light. Overnight focus: NZ inflation expectations (evening ET), U.K. Labour Market (pre-London), Germany ZEW (pre-NY). Expect patchy liquidity around the holiday; be strict with the 2R viability gate and trade only inside NY AM/PM kill-zones.

Week 11.03 - 11.07 Prep Last Week :
Last week we opened on a gap above Value and made a push over Edge top where we found our top and larger sellers for the week. Return to above VAL provided selling back into and eventually under the Edge. Holding under the Edge got us under MAs and changed the trend from uptrend to downtrend on 30m and 1h Time Frames, 2hr and 4hr frames only changed into correction without fully changing into downtrend. Holds under the Edge also provided good sells into lower VAH/Value for the gap fill towards end of the week when we got Month End profit taking but we were not able to fill the gap, instead we ran out of Supply Friday Midday and got end of the week short covering which drove price back out Value without filling the gap or staying in Value.
This Week :
So far this week we have again opened over Value and have been balancing between VAH and Edge in Globex, right now Edge again provided good sell back towards VAH and it may seem like it can continue selling but this will be the area to be careful at, at least to start the week as we are starting New Month, New week and it would be best to see what order flow we get, of course it is possible that we just continue lower right away but also this could be an area where we will see more covering above the Gap which can keep price over it and eventually once selling slows down could give another rotation towards/into and possible over the Edge.
As mentioned last week we are currently inside 915 - 875 +/- Intraday Range with 900 - 890 being its mean and price can stay within this range until it accepts under 870 - 65 areas without popping back over 75 then we know we have accepted in lower Intraday Range of 870 - 830 and can continue through its targets which would be 855 - 845 Mean area and down into/towards 830 - 20s. If we do hold this current range we are in then it is still possible that it will bring more buying as buyers like to start getting in once price holds which could still push us up towards/over the Edge and maybe even back towards above VAL, how far over Edge we get would be determined by order flow IF it happens but this will be the spots to be careful on the long side instead of getting excited for new ATH or continuation over previous one even if we take it out. Our bigger sellers will still be lurking over the Edge and closer to above VAL which means if we see a push out we could either see a quick or after consolidation return back under the Edge.
For price to change things back into stability or strength from here we would need a strong push over VAL with Medium/Larger MAs following behind us for support to be able to hold the price in/around new Value to show acceptance in New Hourly Range, unless this happens we have to keep thinking that top is in for now and look for return trips away from it which would make price want to return to previous Value.
If we do get strong selling continuation today/tomorrow through 70 - 65 and keep it under then of course we will go with that and keep targeting the Mean/Gap fill and push under the Mean but unless you see clear selling under 70 - 65 careful looking for too much continuation from here early on, it might take few days to decide what we will do and get ready for a good move into lower Value which maybe happen either from above the Edge or once we hold under it long enough and change trend on 2hr and 4hr Frames.

ES - November 6th - Daily Trade PlanNovember 6th- Daily Trade Plan - 6:25am
*Before reading this trade plan, IF, you did not read yesterdays, or the Weekly Trade Plan take the time to read it first! (You can see both posts in the related publication section) *
If my posts provide quality information that has helped you with your trading journey. Feel free to boost it for others to find and learn, also!
My daily trade plan and real-time notes that I post are intended for myself to easily be able to go back and review my plan and how I did from an execution perspective.
--------------------------------------------------------------------------------------------------------
Since we continue to chop around in this range between 6770-6850, I will not get into too much detail about yesterday's price action as you can take a look at my trade plan from yesterday and read through the notes and what my expectation were and levels, we had to execute the trade plan!
Today we have ADP Employment numbers, PMI & ISM with tomorrow being the Jobs Report!
Our overnight low is 6804 and our high is 6835. As of typing this plan, you can clearly see that we have made lower lows, and lower highs overnight, so far. We are in a tight 30 pt range and bigger picture, I have talked this week about how 6856-60 a big resistance. I have also stated that 6690-95 is our level that needs to hold to keep the bigger picture bull case intact.
I expect a lot of choppy/trapping today and tomorrow. IF price does clear 6870, we should run back to new highs. IF price loses 6750, my expectation is that we test 6719, 6680.
Until we clear 6870, the current trend is for price action to lose 6750 and create a new lower low.
Key Levels Today -
1. Loss of 6807 and reclaim
2. Loss of 6792 and reclaim
3. Loss of 6773 and reclaim
4. Loss of 6749 and reclaim
IF price clears 6835 (Overnight high) prior to 9:30am open, we could see some FOMO and chasing at the open. IF price does fall back into the overnight range, I would be careful as we could head lower.
Key Support Levels - 6823, 6807, 6792, 6773, 6765, 6758, 6750
Key Resistance Levels - 6835, 6843, 6849, 6857, 6867, 6873
Until price creates a higher high, I have to defer to the current micro trend which is the probability of price to continue lower.
I will post an update around 10am EST.
----------------------------------------------------------------------------------------------------------------
Couple of things about how I color code my levels.
1. Purple shows the weekly Low
2. Red shows the current overnight session High/Low (time of post)
3. Blue shows the previous day's session Low (also other previous day's lows)
4. Yellow Levels are levels that show support and resistance levels of interest.
5. White Levels are previous days session High/Low

ES - November 7th - Daily Trade PlanNovember 7th- Daily Trade Plan - 7:50am
*Before reading this trade plan, IF, you did not read yesterdays, or the Weekly Trade Plan take the time to read it first! (You can see both posts in the related publication section) *
If my posts provide quality information that has helped you with your trading journey. Feel free to boost it for others to find and learn, also!
My daily trade plan and real-time notes that I post are intended for myself to easily be able to go back and review my plan and how I did from an execution perspective.
--------------------------------------------------------------------------------------------------------
Overnight low is 6715 and high is 6771. We have continued to create lower lows and as I have mentioned all week, we are getting close to the 6690 bigger trend breakdown. I do think today we have some good levels to grab some points and could produce a nice short squeeze.
Key Levels Today -
1. Loss of 6715 and reclaim
2. Loss of 6703 and reclaim
3. Loss of 6696 and reclaim
4. Loss of 6690 (maybe down to 6683 and reclaim).
Key Support Levels - 6711, 6703, 6696, 6690, 6683, 6675, 6666
Key Resistance Levels - 6726, 6732, 6742, 6749, 6755, 6766, 6771
Until price creates a higher high, I have to defer to the current micro trend which is the probability of price to continue lower. IF we lose 6690 and cannot reclaim 6785, we could melt down next week.
I will post an update around 10am EST.
----------------------------------------------------------------------------------------------------------------
Couple of things about how I color code my levels.
1. Purple shows the weekly Low
2. Red shows the current overnight session High/Low (time of post)
3. Blue shows the previous day's session Low (also other previous day's lows)
4. Yellow Levels are levels that show support and resistance levels of interest.
5. White Levels are previous days session High/Low

ES - November 5th - Daily Trade PlanNovember 5th- Daily Trade Plan - 6:30am
*Before reading this trade plan, IF, you did not read yesterdays, or the Weekly Trade Plan take the time to read it first! (You can see both posts in the related publication section) *
If my posts provide quality information that has helped you with your trading journey. Feel free to boost it for others to find and learn, also!
My daily trade plan and real-time notes that I post are intended for myself to easily be able to go back and review my plan and how I did from an execution perspective.
--------------------------------------------------------------------------------------------------------
I wrote yesterday "My general lean today is that we can back test 6843, 6862-65. I will be looking for a pullback to 6801 level and reclaim to grab some points. The only other option will be looking for a base to be built at one of the levels in yellow and create a strong support that provides an opportunity to enter long for a level-to-level move. 6824 resistance is a good spot to long for a move up the levels. It could be a tricky level to engage as it will probably take a few attempts to clear. Once it clears, it should move quickly up the levels to back test 6843, 6862-65."
Institutions were buying at the 6800 level between 8:30am-9:30am and we flushed down to 6786, reclaimed and then went higher and back tested to 6849 and then started to sell off in the afternoon. This is a typical bear market type of price action where price is being sold into strength, and we continue to make lower lows and lower highs. I would get used this type of price action as we could continue to see this over the coming months.
----------------------------------------------------------------------------------------------------------
Overnight low is 6749 and the high is 6807 with 6800 being heavy resistance that needs to clear for us to continue up the levels. IF price does head higher, we should test 6810, 6823. Technically IF price wants to continue higher, we need to clear 6849.
IF price does not clear 6800 and we lose 6749, we will need to see if price can react at 6734 or lose 6719 and reclaim to back test 6750 and potentially try to go higher.
I have said over the past few weeks that we have to remain bullish unless we lose the 6690 level. Last week we closed at the prior week lows and so far, we are trending to potentially do the same this week if price can hold 6690.
Key Levels Today -
1. Loss of 6775 and reclaim (This has been tested as I write this post, so will be weaker on next attempt)
2. Loss of 6765 and reclaim
3. Loss of 6758 and reclaim
4. Loss of 6749 and reclaim (Overnight Low)
5. Loss of 6734 and reclaim
6. Loss of 6719 and reclaim
Below these levels and I don't get very interested until 6690-95.
Key Support Levels - 6775, 6765, 6758, 6749, 6734, 6726, 6719
Key Resistance Levels - 6786, 6800, 6807, 6816, 6823, 6831, 6843, 6849
Until price creates a higher high, I have to defer to the current micro trend which is the probability of price to continue lower.
I will post an update around 10am EST.
----------------------------------------------------------------------------------------------------------------
Couple of things about how I color code my levels.
1. Purple shows the weekly Low
2. Red shows the current overnight session High/Low (time of post)
3. Blue shows the previous day's session Low (also other previous day's lows)
4. Yellow Levels are levels that show support and resistance levels of interest.
5. White shows the trendline from the August lows

ES Open GapFutures gapped up this afternoon, and that gap will eventually have to fill. Not sure when. Probably when MFI hits overbought, I don't see it going back and filling quickly.
I'll post an update in the morning if I have time.

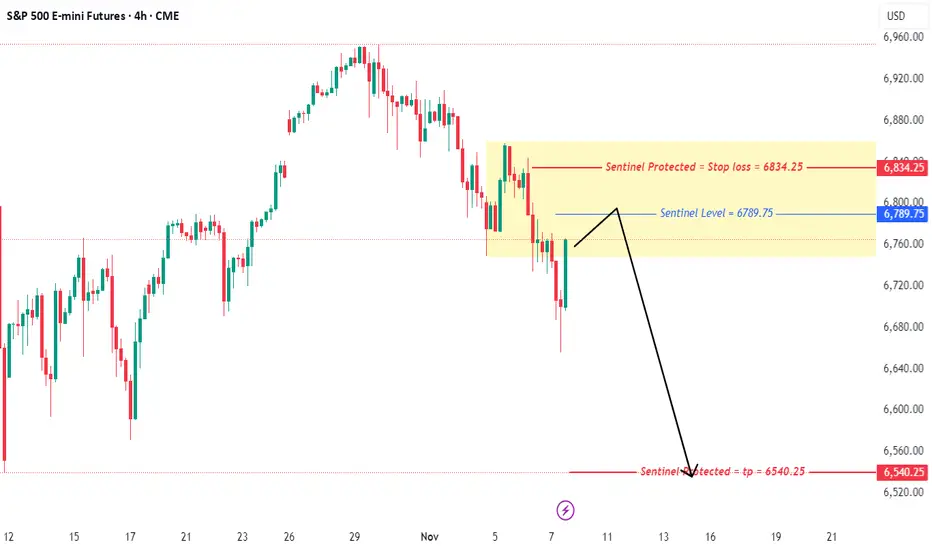
ES QuantSignals V3 Futures 2025-11-08ES QuantSignals V3 Futures 2025-11-08
ES Futures Signal | 2025-11-08
• Direction: SELL | Confidence: 68%
• Type: Index Futures | Timeframe: 1H
• Entry Range: $6757.50
• Target 1: $6665.00
• Stop Loss: $6810.00
• Volume vs Avg: 1.0×
• Recent Move: -1.34%
• ⚠️ MODERATE RISK WARNING: Consider reducing position size due to moderate confidence level.
⚖️ Compliance: Educational futures commentary for QS Premium. Not financial advice.
🚀 QS V3 ELITE FUTURES ANALYSIS
Generated: 2025-11-08 16:18:07 ET
Instrument: ES ($6753.75)
Type: Index Futures
Trend: BEARISH
Confidence: 67.7%
Timeframe: 1H
Model: QS + Katy AI
Strictness: MEDIUM
🎯 TRADE RECOMMENDATION
Direction: SELL
Confidence: 68%
Conviction Level: MEDIUM
🧠 ANALYSIS SUMMARY
Katy AI Signal: Bearish with 67.7% confidence, predicting decline to $6662.98 (-1.34%)
Technical Analysis: Current price $6753.75 showing immediate weakness after -1.34% drop. Katy's prediction shows initial choppy action with clear bearish trajectory emerging from November 12th, accelerating downward through November 13-14. Key resistance at $6780-6800 zone, support levels at $6700 then $6650.
Macro & News: Light news flow with mostly energy sector specifics. Market appears to be driven by technical positioning rather than major catalysts. Normal VIX at 19.08 suggests orderly selling pressure.
Flow & Positioning: Volume at average levels indicates normal participation. Options flow data appears incomplete/unreliable. Katy's prediction shows consistent selling pressure building over the 120-period horizon.
Risk Level: MODERATE - Primary risk is initial choppiness before bearish trend establishes. Stop must account for potential false breakdowns.
💰 TRADE SETUP
Contract: ES
Entry Price: $6750 - $6765
Take Profit 1: $6665
Take Profit 2: $6590
Stop Loss: $6810
Position Size: 2 contracts (moderate conviction with proper risk management)
⚡
Image
QS Analyst
APP
— Yesterday at 4:18 PM
COMPETITIVE EDGE
Why This Trade: Katy AI provides high-confidence bearish signal with detailed time-series validation showing clear downward trajectory after initial consolidation
Timing Advantage: Entry during Globex session allows positioning before potential acceleration of selling pressure during regular hours
Risk Mitigation: Wide stop-loss accounts for initial volatility, while tiered take-profits capture momentum at key support levels
🚨 IMPORTANT NOTES
Monitor for any unexpected bullish catalysts that could reverse the technical bearish setup
Be prepared for choppy price action between November 9-11 before clearer bearish trend establishes
Position size should be reduced if market shows unexpected strength above $6780 resistance
Trade Validation: Katy AI's bearish prediction aligns perfectly with current technical weakness and normal volatility environment, providing strong directional conviction for short positions.
📊 TRADE DETAILS 📊
🎯 Instrument: ES
🔀 Direction:
💵 Entry Price: 6757.50
🎯 Profit Target: 6665.00
🛑 Stop Loss: 6810.00
📏 Size: N/A
📈 Confidence: 68%
⏰ Entry Timing: N/A
🕒 Signal Time: 2025-11-08 19:18:04 EST
⚠️ MODERATE RISK WARNING: Consider reducing position size due to moderate confidence level.
---
QS V3 Futures Strategy System - Professional futures trading with Katy AI intelligence.


ES - November 4th - Daily Trade PlanNovember 4th- Daily Trade Plan - 6:20am
*Before reading this trade plan, IF, you did not read yesterdays, or the Weekly Trade Plan take the time to read it first! (You can see both posts in the related publication section) *
If my posts provide quality information that has helped you with your trading journey. Feel free to boost it for others to find and learn, also!
My daily trade plan and real-time notes that I post are intended for myself to easily be able to go back and review my plan and how I did from an execution perspective.
--------------------------------------------------------------------------------------------------------
Yesterday we had some great levels that hit and followed through. I stated in my trade plan that "IF we lose, 6843, we will probably flush pretty quickly lower"
Overnight we saw this and our overnight low is 6785 and high is 6882. That is about a 100pt move overnight. I have mentioned many times that the bigger picture trend is up and that would not change unless we lose 6690. We have to respect the trend and look for prices to move higher. When we get a nice sell off like we have overnight, we need to retest the levels above and see if we can continue higher. Bears are fully in control and until 6918 is retaken, we have to expect selling on any back tests of higher prices.
Key Levels Today -
1.Loss of 6812 and reclaim (Micro level reclaim)
2. Loss of 6785 and reclaim
3. Loss of 6801 and reclaim (IF 6785 is the low for the day, this might be the best spot to grab points before it moves higher)
4. Below the overnight low and 6776 and reclaim is next level lower of interest
5. Loss of 6767 and reclaim
Key Support Levels - 6812, 6801, 6792, 6785, 6776, 6773, 6767
Key Resistance Levels - 6824, 6830, 6837, 6843, 6849, 6862-65
My general lean today is that we can back test 6843, 6862-65. I will be looking for a pullback to 6801 level and reclaim to grab some points. The only other option will be looking for a base to be built at one of the levels in yellow and create a strong support that provides an opportunity to enter long for a level-to-level move. 6824 resistance is a good spot to long for a move up the levels. It could be a tricky level to engage as it will probably take a few attempts to clear. Once it clears, it should move quickly up the levels to back test 6843, 6862-65.
I will post an update around 10am EST.
----------------------------------------------------------------------------------------------------------------
Couple of things about how I color code my levels.
1. Purple shows the weekly Low
2. Red shows the current overnight session High/Low (time of post)
3. Blue shows the previous day's session Low (also other previous day's lows)
4. Yellow Levels are levels that show support and resistance levels of interest.
5. White shows the trendline from the August lows

ES - November 11th - Daily Trade PlanNovember 11th- Daily Trade Plan - 8:45am
*Before reading this trade plan, IF, you did not read yesterdays, or the Weekly Trade Plan take the time to read it first! (You can see both posts in the related publication section) *
If my posts provide quality information that has helped you with your trading journey. Feel free to boost it for others to find and learn, also!
My daily trade plan and real-time notes that I post are intended for myself to easily be able to go back and review my plan and how I did from an execution perspective.
--------------------------------------------------------------------------------------------------------
I was off my desk yesterday and I am now catching up for this week.
Overnight Low is 6836 and the Overnight High is 6867. We have been moving sideways since 1pm yesterday in this range and we must respect the short-term trend that is bullish. We still have the 6765-level gap that needs to be filled at some point. We have CPI & PPI this week, so I do expect some volatility.
Key Levels Today -
1. Loss of 6836 and reclaim
2. Loss of 6796 and reclaim
3. Loss of 6772 and reclaim (possibly as low as 6765 to close the gap)
4. Loss of 6743 and reclaim (possibly down to 6731)
Below those areas and we will most likely need to retest 6654. Price needs to clear 6878 to continue higher and change the macro trend.
Key Support Levels - 6836, 6824, 6809, 6796, 6772, 6765, 6753, 6743, 6731, 6710, 6695
Key Resistance Levels - 6854, 6867, 6885, 6893, 6908
We are in a tricky spot as you have short term resistance at 6847 then 6854 and 6867. Ideally, we can lose 6836 down to 6824, 6809 and then reclaim those levels to move higher.
I will post an update around 10am EST
----------------------------------------------------------------------------------------------------------------
Couple of things about how I color code my levels.
1. Purple shows the weekly Low
2. Red shows the current overnight session High/Low (time of post)
3. Blue shows the previous day's session Low (also other previous day's lows)
4. Yellow Levels are levels that show support and resistance levels of interest.
5. White Levels are previous days session High/Low

ES UpdateI didn't trade today because of a hangover, lol.
Seems kinda weird that there was a resistance midday, you typically don't see resistance in the indices. EOD drop kept me from buying anything in the afternoon.
Futures are slightly red, MFI will probably get overbought before open tomorrow. In other words, don't buy the dip tomorrow. Appears Japan is resuming the selloff.

ES Update - Breakout backtestSorry that I'm fixated on the TACO gap a little too much, I realized that this drop isn't about the TACO drop, it's back testing the breakout, which is pretty typical, it did the same last year on the election news. Especially considering it broke out on fake news, lol.
So market probably open right here at the line and decides whether to tank or go up. Seeing that there's an open gap above for NQ, I'm guessing up.
The back test has to happen during actual market hours, so I'm thinking the market opens up somewhere in this area.
