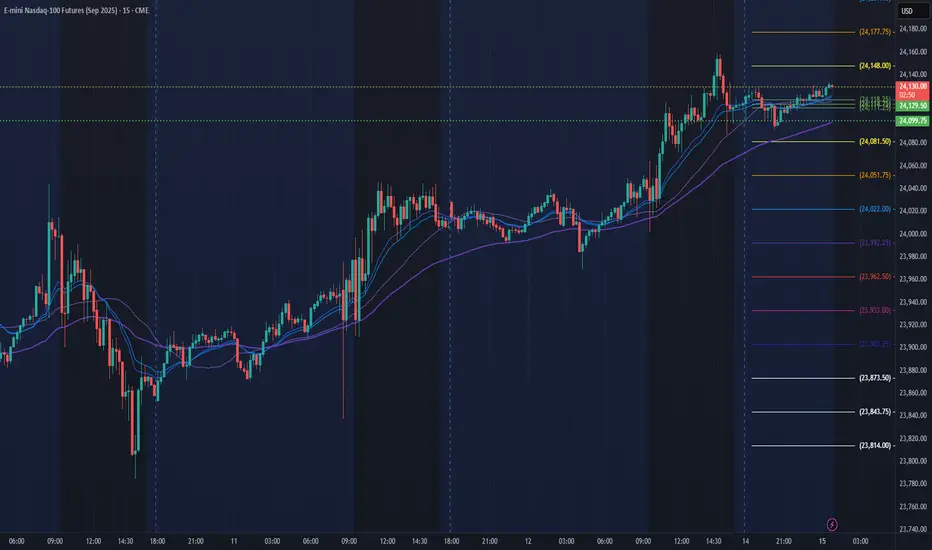
NQ FUTURES IDEA 9/15We are looking to re test the top of 24,159 NQ but first we might drop to 24,000 NQ. I think we trade around this 24,064 range and then start pushing back up to re test 24,159 NQ.
Trade ideas

NQ Power Range Report with FIB Ext - 9/15/2025 SessionCME_MINI:NQU2025
- PR High: 24129.50
- PR Low: 24099.75
- NZ Spread: 66.75
No key scheduled economic events
Contract rollover week
- Advertising potential to continue ATH march
Session Open Stats (As of 12:45 AM 9/15)
- Session Open ATR: 270.13
- Volume: 13K
- Open Int: 273K
- Trend Grade: Long
- From BA ATH: -0.1% (Rounded)
Key Levels (Rounded - Think of these as ranges)
- Long: 25217
- Mid: 22503
- Short: 21790
Keep in mind this is not speculation or a prediction. Only a report of the Power Range with Fib extensions for target hunting. Do your DD! You determine your risk tolerance. You are fully capable of making your own decisions.
BA: Back Adjusted
BuZ/BeZ: Bull Zone / Bear Zone
NZ: Neutral Zone
Both Side NQ for the week of 15-20/09/2025NQ will retrace a bit lower just to continue higher. If we reach the 24500 I can see having a bearish close the last two day of the week.
Always remember, Caution, Patience and Risk!
GL!
If you like the content give me a follow on X!
Check Bio. Cheers!

Weekly Market Update & Analysis - 14-September-2025Weekly Market Update & Analysis
Week Ending : September 14, 2025
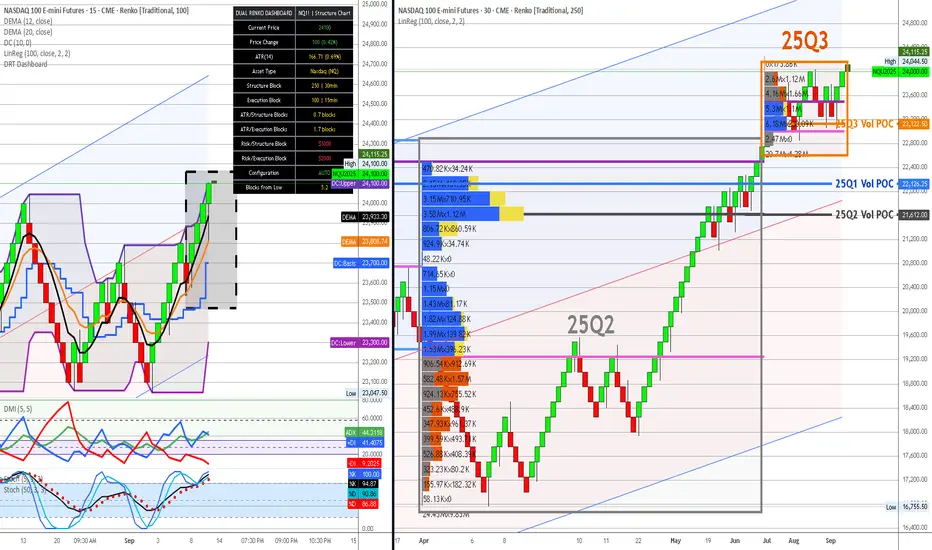
Analysis Framework : Institutional Intelligence Dual Renko System
Executive Summary
The past week delivered exceptional validation of our institutional intelligence framework across equity indices while confirming the deteriorating conditions in commodity and currency markets. Our three primary equity opportunities (NQ, ES, YM) demonstrated the power of trading with institutional backing, while defensive positioning in overextended and institutionally-abandoned assets proved essential for capital preservation.
Portfolio performance reflects the strength of systematic institutional intelligence application , with equity allocations advancing while defensive positioning prevented significant losses in deteriorating sectors.
Primary Opportunities - Institutional Validation Continues
1. NASDAQ 100 (NQ) - EXCEPTIONAL PERFORMANCE VALIDATION
Previous Week Assessment : 25-30% allocation with 26.8:1 institutional backing at 23,963
Current Status : 24,100 (+0.57% weekly advance)
Institutional Intelligence Confirmed :
Structure Chart Validation : Trading above Q3 institutional accumulation with volume support
Dashboard Metrics : ATR 166.71 (0.69%) confirms low volatility, optimal block sizing maintained
Risk Management : $5,000 per 100-point execution block = excellent position sizing precision
Technical Status : All momentum indicators supporting institutional positioning
Weekly Performance Analysis :
Price Action : Steady advance above institutional zones validates smart money accumulation
Volume Confirmation : Sustained institutional engagement throughout advance
Risk Control : Minimal drawdown with institutional support holding
Momentum Quality : Clean upward progression without excessive volatility
Coming Week Outlook :
Bullish Scenario (75%) : Continuation toward 24,500-25,000 resistance levels
Consolidation (20%) : Range trading 23,800-24,300 for momentum reset
Correction (5%) : Pullback to 23,500 institutional support for accumulation
Strategy : Maintain full 25-30% allocation, trail stops using 100-point swing lows
2. S&P 500 (ES) - SOLID INSTITUTIONAL FOUNDATION
ES Combined View:
Previous Week Assessment : 20-25% allocation with 5.21:1 institutional backing at 6,575
Current Status : 6,600 (+0.38% weekly advance)
Institutional Intelligence Confirmed :
Structure Chart : Maintaining position above Q3 POC institutional accumulation
Dashboard Metrics : ATR 37.37 (0.56%) supporting current 25-point execution blocks
Volume Profile : Sustained engagement above institutional zones
Risk Framework : $1,250 per 25-point block enabling precise risk management
Weekly Performance Analysis :
Steady Advance : Consistent progress above institutional support levels
Volume Quality : Professional participation supporting price advance
Technical Health : Momentum indicators maintaining bullish alignment
Volatility Control : Low ATR environment supporting systematic approach
Coming Week Outlook :
Bullish Scenario (70%) : Advance toward 6,700-6,750 resistance zone
Consolidation (25%) : Range development 6,550-6,650 for base building
Correction (5%) : Test of 6,500 institutional support
Strategy : Maintain 20-25% core allocation with systematic profit-taking above 6,700
3. DOW JONES (YM) - OPTIMAL RISK/REWARD POSITIONING
YM Combined View:
Previous Week Assessment : 25-30% allocation with perfect YTD POC alignment at 46,050
Current Status : 46,050 (unchanged, consolidating at optimal institutional level)
Institutional Intelligence Excellence :
YTD POC Validation : Trading precisely at institutional consensus level (45,150 area)
Dashboard Metrics : ATR 238.47 (0.52%) confirming 150-point execution blocks optimal
Risk Profile : $750 per 150-point block = superior risk management
Support Quality : Cross-timeframe institutional validation providing exceptional downside protection
Weekly Performance Analysis :
Consolidation Strength : Holding institutional consensus demonstrates smart money confidence
Volume Distribution : Balanced institutional participation during consolidation
Risk Management : Minimal downside exposure with institutional support
Setup Quality : Optimal positioning for next institutional advance
Coming Week Outlook :
Bullish Scenario (80%) : Breakout toward 46,800-47,200 levels with institutional support
Consolidation (15%) : Continued range at institutional consensus for accumulation
Correction (5%) : Brief test toward 45,500 for final institutional positioning
Strategy : Maintain maximum 25-30% allocation, add on any weakness toward 45,700
Secondary Holdings - Defensive Management Required
4. WTI CRUDE OIL (CL) - TECHNICAL IMPROVEMENT NOTED
CL Combined View:
Previous Week Assessment : 8-12% defensive allocation due to technical conflicts at 62.94
Current Status : 62.25 (-1.10% weekly decline)
Mixed Signal Assessment :
Institutional Support : Structure chart shows continued Q2/Q3 accumulation backing
Technical Challenges : Dashboard ATR 0.33 (0.53%) appropriate, but momentum concerns persist
Price Action : Testing lower end of institutional accumulation zone
Risk Management : $250 per 0.25 execution block maintaining precision
Weekly Performance Analysis :
Institutional Respect : Decline contained within smart money accumulation zones
Volume Behavior : Some institutional support visible near Q2 POC levels
Technical Status : DEMA maintaining bullish bias despite price weakness
Defensive Positioning : Lower allocation preventing significant capital impact
Coming Week Outlook :
Bullish Scenario (50%) : Recovery above 63.50 with institutional volume confirmation
Neutral Scenario (35%) : Range trading 62.00-64.00 within institutional zone
Bearish Scenario (15%) : Break below 61.50 requiring defensive exit protocols
Strategy : Maintain 8-12% defensive allocation, monitor for technical confirmation signals
High-Risk Positions - Defensive Protocols Validated
5. NATURAL GAS (NG) - INSTITUTIONAL ABANDONMENT ACCELERATING
NG Combined View:
Previous Week Assessment : 3-5% minimal allocation due to institutional disengagement at 2.950
Current Status : 2.960 (+0.34% minor recovery)
Deteriorating Fundamentals :
Institutional Intelligence : 65% volume decline from Q1 peaks continues
Dashboard Warning : ATR 0.04 (1.41%) suggesting continued volatility risk
Technical Status : Bearish momentum persisting despite minor recovery
Liquidity Concerns : /MNG volume insufficient for meaningful position sizing
Weekly Performance Analysis :
Minimal Recovery : Slight advance insufficient to reverse institutional disengagement
Volume Quality : Limited institutional participation in recovery attempt
Risk Limitation : 3-5% allocation preventing significant portfolio impact
Framework Validation : Defensive positioning justified by continued weakness
Coming Week Outlook :
Neutral Scenario (45%) : Range trading 2.90-3.10 with limited institutional interest
Bearish Scenario (40%) : Resumption of decline toward 2.70-2.80 levels
Bullish Scenario (15%) : Recovery above 3.20 requiring fresh institutional engagement
Strategy : Maintain minimal 3-5% allocation, avoid increases until institutional return
6. EURO FUTURES (6E) - EXTENSION CORRECTION ACCELERATING
6E Combined View:
Previous Week Assessment : 2-3% minimal allocation due to 12.9% dangerous extension at 1.1792
Current Status : 1.1800 (+0.07% minimal advance)
Dangerous Extension Persists :
YTD POC Distance : Still 12.1% above institutional consensus at 1.0525
Dashboard Metrics : ATR 0.0 (0.23%) showing compressed volatility before correction
Technical Deterioration : Extension beyond all institutional positioning zones
Risk Assessment : $1,250 per 0.002 block = high risk per unit exposure
Weekly Performance Analysis :
Consolidation Warning : Minimal movement often precedes major corrections
Institutional Void : Trading well beyond any smart money positioning
Defensive Success : 2-3% allocation limiting portfolio exposure
Correction Preparation : Framework positioning for mean reversion opportunity
Coming Week Outlook :
Bearish Scenario (65%) : Correction toward 1.1200-1.0800 institutional zones
Neutral Scenario (25%) : Continued consolidation at dangerous extension levels
Bullish Scenario (10%) : Further extension creating extreme correction risk
Strategy : Maintain minimal 2-3% defensive allocation, prepare for correction opportunity
7. GOLD FUTURES (GC) - VOID TERRITORY CORRECTION UNDERWAY
GC Combined View:
Previous Week Assessment : 0% allocation due to catastrophic void territory at 2,682
Current Status : 2,687 (+0.19% minor advance)
Catastrophic Risk Confirmed :
Institutional Void : Still 12.2%+ beyond all smart money positioning
Dashboard Alert : ATR 15.93 (0.59%) insufficient for current extension risk
Technical Status : Trading in complete institutional abandonment zone
Correction Vulnerability : $500 per 5-point block = extreme risk if positioned
Weekly Performance Analysis :
Void Persistence : Continued trading beyond institutional intelligence zones
Correction Preparation : Framework positioning for eventual return to smart money levels
Capital Preservation : 0% allocation preventing catastrophic losses during correction
Professional Discipline : Maintaining avoidance despite minor advances
Coming Week Outlook :
Bearish Scenario (70%) : Major correction toward 2,380-2,450 institutional zones
Neutral Scenario (20%) : Continued consolidation at void territory levels
Bullish Scenario (10%) : Further extension creating ultimate correction setup
Strategy : Maintain 0% allocation, prepare for institutional zone re-entry opportunity
Portfolio Management & Risk Assessment
Current Allocation Status
Equity Indices : 70-80% (NQ 25-30%, ES 20-25%, YM 25-30%)
Defensive Commodities : 10-15% (CL 8-12%, NG 3-5%)
High-Risk Positions : 2-3% (6E minimal allocation)
Avoided Assets : 0% (GC complete avoidance)
Cash/Opportunity : 10-15% (correction and opportunity preparation)
Risk Management Performance
Institutional Validation : Equity positions performing as expected with smart money backing
Defensive Success : Limited commodity exposure preventing significant losses
Framework Discipline : Systematic adherence to institutional intelligence preventing major errors
Professional Standards : Dashboard integration enabling precise risk control
ATR Monitoring & Block Size Validation
All Markets : ATR levels within acceptable ranges for current block sizing
Volatility Environment : Low volatility across indices supporting systematic approach
Risk Per Block : All position sizing maintaining 2% account risk parameters
Configuration Status : No block size adjustments required across tracked markets
Coming Week Strategic Framework
Primary Focus Areas
Equity Strength Continuation : Monitor institutional level respect and momentum sustainability
Commodity Stabilization : Watch for technical improvements and institutional re-engagement
Extension Corrections : Prepare for mean reversion opportunities in overextended assets
Risk Management : Maintain systematic discipline with institutional intelligence framework
Market Scenarios for Coming Week
Scenario A: Equity Momentum Continuation (70% probability)
Characteristics : Institutional accumulation continues supporting index advances
Winners : NQ, ES, YM maintain leadership with systematic advances
Strategy : Maintain high equity allocation, systematic profit-taking at resistance
Risk Management : Trail stops using institutional support levels
Scenario B: Market Consolidation (25% probability)
Characteristics : Range development around current institutional zones
Opportunity : Accumulate additional positions near institutional support
Management : Patience for breakout confirmation from consolidation
Defensive Positioning : Maintain current commodity allocations
Scenario C: Correction & Opportunity (5% probability)
Trigger : Break below institutional support requiring defensive protocols
Response : Systematic position reduction with cash accumulation
Opportunity : Preparation for institutional zone re-entry
Framework : Maintain institutional intelligence discipline during volatility
Trading Insights
Institutional Intelligence Validation
Framework Success : Systematic application preventing major allocation errors
Smart Money Alignment : Trading with institutional positioning generating consistent results
Risk Prevention : Defensive protocols successful in avoiding overextended assets
Professional Standards : Dashboard integration providing institutional-grade oversight
Technical Analysis Integration
Dual Chart Methodology : Structure/execution integration providing complete market intelligence
Enhanced Indicators : DMI, DEMA, stochastics optimization delivering precise signals
Block Size Efficiency : Renko configuration filtering noise while preserving institutional intelligence
Visual Framework : Professional chart standards enabling rapid decision-making
Risk Management Excellence
Systematic Position Sizing : 2% account risk framework maintaining capital preservation
Institutional Distance Monitoring : Extension risk assessment preventing dangerous allocations
Correlation Management : Cross-asset allocation preventing concentration risk
Professional Discipline : Adherence to framework over emotional decision-making
Key Success Factors for Coming Week
Maintain Framework Discipline
Institutional Intelligence Priority : Continue systematic application of smart money positioning
Technical Confirmation : Require execution chart validation for all allocation changes
Risk Management : Maintain systematic position sizing and stop placement protocols
Professional Standards : Use dashboard metrics for all risk assessment decisions
Monitor Key Developments
Equity Momentum : Watch for institutional level breaks requiring strategy adjustment
Commodity Recovery : Monitor for technical improvements enabling allocation increases
Extension Corrections : Prepare for mean reversion opportunities in overextended assets
Volume Profile Evolution : Track institutional engagement changes across all markets
Implementation Priorities
Daily Monitoring : Use combined charts for efficient institutional intelligence assessment
Weekly Reviews : Systematic evaluation of framework performance and market evolution
Monthly Calibration : Deep structure chart analysis and technical indicator validation
Quarterly Overhaul : Complete institutional intelligence framework reassessment
Market Outlook Summary : The institutional intelligence framework continues delivering exceptional results through systematic application of smart money positioning analysis. Equity markets demonstrate the power of trading with institutional backing, while defensive positioning in overextended and abandoned assets validates professional risk management protocols.
Strategic Positioning : Maintain high equity allocation (70-80%) with systematic profit-taking protocols, defensive commodity management, and complete avoidance of void territory assets. The framework's ability to identify optimal risk-adjusted opportunities while preventing catastrophic losses represents institutional-grade market intelligence application.
Professional Discipline : Continue systematic adherence to institutional intelligence over short-term market noise, maintain enhanced visual framework standards, and apply professional risk management protocols across all timeframes and market conditions.
Next Review : Weekly combined chart analysis scheduled for September 21, 2025, with continued focus on institutional intelligence validation and systematic framework application.
Risk Disclaimer : All trading involves substantial risk of loss. Past performance does not guarantee future results. The institutional intelligence framework provides analytical tools for risk assessment but cannot eliminate market risk. Position sizing and risk management protocols must be adjusted based on individual account size, risk tolerance, and market conditions.
Professional Standards : This analysis represents systematic application of institutional intelligence methodology developed through extensive market research and validation. Continued framework discipline and professional risk management remain essential for sustainable trading success.
Results of Day One of our Radical Departure from YouTube WisdomFollowing our Breakout Plan from Chart 1 we banked $4,546.68.
Account Value: $54,546.68
At day's end we are 2L NQ and 8L MNQ.
Intraday Margin Required:
1.NQ: 2 x $1000.00 = $2000.00
2.MNQ: 8 x $100.00 = $800.00
Initial Margin Required: $68,376.00
Problem: At day's end we cannot cover Initial Margin.
Solution: At 4:30 PM New York time sell 6 MNQs. When the market opens 9/7/25 at 6:00 PM New York time buy them back at a lower Px if possible.
Math:
You are 2.8L NQ
68,376/2.8 = 24,420 for each NQ contract
24,420/10 = 2,442 for each MNQ contract
68,376 - 54,546.68 = 13,829.32
13,829.32/2,442 = 5.6631122
Radical Departure from YouTube WisdomShall we buck conventional YouTube Wisdom which says one must use a stop loss and one must have at least a 1.1R target?
Let's start with an hypothetical $50,000.00 account and document its success or failure with the following Trade Plan:
1.Buy the Breakout
2.Buy the Dip
3.Buy the Pivot
We will use this chart as our starting point. As we progress, we will flesh out our Trading Plan. We will lay down Foundational Principles which will be the bedrock upon which we build. Skyscrapers exist on lower Manhattan because of the bedrock beneath. Francis Schaeffer called this True Truth - things that are true for all people at all times.
Buy the Breakout Plan
1.Buy 1 contract of NQ at every multiple of 10 with a target of 19 points.
2.Buy 4 contracts of MNQ at every multiple of 5 with a target of 19 points.
Away we go!

NQ Long IdeaI am not a Indices guy this is my Idea for NQ/ES We have retraced to discounted levels and OTE levels with Premium Array

Role of G7 and G20 in World Markets1. Historical Background
1.1 Origins of the G7
The G7 originated in the 1970s oil crisis and currency instability. The breakdown of the Bretton Woods system (1971) and the 1973 oil shock forced leaders of the US, UK, France, West Germany, Italy, and Japan to coordinate policies.
The first meeting took place in 1975 at Rambouillet, France. Canada joined in 1976, making it the G7.
The forum was designed as an informal space for dialogue among advanced economies, free from the rigid bureaucracy of the IMF or UN.
1.2 Expansion into G20
By the late 1990s, globalization had empowered emerging markets like China, India, Brazil, and South Africa.
The Asian Financial Crisis of 1997–98 exposed the limitations of the G7, which could not represent the interests of developing nations.
The G20 was created in 1999, initially as a forum for finance ministers and central bank governors.
Following the 2008 Global Financial Crisis, the G20 was elevated to a leaders’ summit level, becoming the “premier forum for international economic cooperation.”
2. Membership & Structure
2.1 G7
Members: United States, Canada, United Kingdom, France, Germany, Italy, Japan, and the EU (as an observer).
Characteristics: Advanced, high-income democracies with strong global financial markets.
Focus: Monetary policy coordination, financial stability, trade, development aid, sanctions, and geopolitical security.
2.2 G20
Members: 19 countries + European Union. Includes major emerging economies like China, India, Brazil, Russia, South Africa, Mexico, Indonesia, Turkey, Argentina, Saudi Arabia, and others.
Coverage: Represents 85% of global GDP, 75% of international trade, and two-thirds of the world’s population.
Focus: Broader economic and financial stability, trade, infrastructure investment, climate change, digital economy, inclusive development.
3. Role in Financial Markets
3.1 Market Stability
The G7 historically acted as a currency stabilizer. For example, the Plaza Accord (1985) coordinated interventions to weaken the US dollar, reshaping forex markets.
The Louvre Accord (1987) similarly stabilized exchange rates. These decisions had immediate effects on bond yields, commodity prices, and stock market sentiment.
The G20, after 2008, coordinated stimulus packages worth trillions of dollars. This joint effort restored investor confidence, stabilized equity markets, and prevented a deeper depression.
3.2 Regulatory Standards
Both groups influence the Basel Committee on Banking Supervision, which sets global banking capital requirements.
The G20’s Financial Stability Board (FSB) was established in 2009 to monitor risks, enforce transparency, and reduce systemic threats. This has reshaped financial markets, particularly derivatives and shadow banking oversight.
3.3 Debt Management & Sovereign Risk
G7 finance ministers often negotiate debt relief for low-income countries, working alongside the IMF and World Bank.
The G20 launched the Debt Service Suspension Initiative (DSSI) in 2020, allowing the poorest nations to defer debt payments during the pandemic—affecting global bond market pricing of sovereign risk.
4. Role in Global Trade
4.1 G7’s Trade Leadership
G7 economies historically dominated WTO negotiations and set the tone for trade liberalization.
The G7 often pushes for open markets, free trade agreements, and intellectual property rights protection.
However, it has also been accused of protectionism—for instance, through agricultural subsidies or technology restrictions.
4.2 G20 and Trade Balancing
The G20 plays a bigger role in mediating between advanced and emerging economies.
After 2008, the G20 pledged to avoid protectionism and keep markets open. This was crucial in preventing a collapse of world trade.
More recently, the G20 has dealt with US-China trade tensions, global supply chain resilience, and reforms of the WTO dispute system.
5. Role in Investment & Infrastructure
5.1 Investment Flows
G7 countries, as capital exporters, dominate foreign direct investment (FDI) and global finance. Their regulatory policies shape global flows.
The G20 promotes inclusive investment frameworks, encouraging capital flows into Africa, Asia, and Latin America.
5.2 Infrastructure Financing
The G20 launched the Global Infrastructure Hub (2014) to connect investors with large-scale infrastructure projects.
The Partnership for Global Infrastructure and Investment (PGII), promoted by G7 in 2022, was designed as a counter to China’s Belt and Road Initiative (BRI).
6. Role in Crisis Management
6.1 2008 Financial Crisis
G7 alone lacked credibility, as emerging markets were now critical players.
The G20’s emergency summits (2008–2009) led to coordinated fiscal stimulus, global liquidity injections, and bank recapitalizations. This stabilized world stock markets.
6.2 Eurozone Debt Crisis (2010–2012)
G7 central banks coordinated to provide liquidity and backstop the euro.
G20 forums pressured European leaders to balance austerity with growth measures.
6.3 COVID-19 Pandemic (2020–2021)
G20 pledged $5 trillion in economic stimulus, central banks slashed interest rates, and liquidity lines were extended across borders.
G7 coordinated on vaccine financing (COVAX) and kept supply chains for medical goods functioning.
7. Role in Currency & Monetary Policy
G7 historically managed exchange rate diplomacy (e.g., Plaza Accord).
The G20 now addresses global imbalances, such as China’s currency valuation, US trade deficits, and emerging market vulnerabilities.
Both groups’ central banks’ policies (Fed, ECB, BOJ, PBOC, etc.) directly influence capital markets worldwide.
8. Role in Technology & Digital Economy
G7 promotes data governance, cybersecurity standards, AI regulations, and digital taxation frameworks.
G20 addresses digital inclusion, fintech growth, cross-border payment systems, and crypto regulation.
These policies affect stock valuations in the tech sector, investor confidence, and cross-border capital mobility.
9. Future Outlook
The G7 will likely remain a strategic and political coordination forum for Western democracies, focusing on sanctions, technology standards, and security-linked economics.
The G20 will remain the central platform for global economic governance, especially in addressing:
Climate financing
Sustainable debt frameworks
Digital currencies (CBDCs)
AI-driven market disruptions
Geopolitical risks in trade and energy
Their role will be critical as the world transitions into a multipolar economic order where no single power dominates.
10. Conclusion
The G7 and G20 act as twin pillars of global economic governance. While the G7 provides leadership from advanced democracies, the G20 reflects the diversity of the modern global economy. Their combined influence extends across financial markets, trade, investment, crisis management, energy security, and digital governance.
Though criticized for exclusivity, lack of enforcement, or internal divisions, both remain indispensable. In times of global crisis—whether financial collapse, pandemics, or geopolitical shocks—they have demonstrated the capacity to restore market confidence and stabilize the world economy.
Ultimately, the G7 and G20 do not replace institutions like the IMF, World Bank, or WTO, but they provide the political will and high-level coordination necessary to steer the world through uncertainty. In a world of interconnected markets, their role will only deepen in shaping the future of global capitalism.
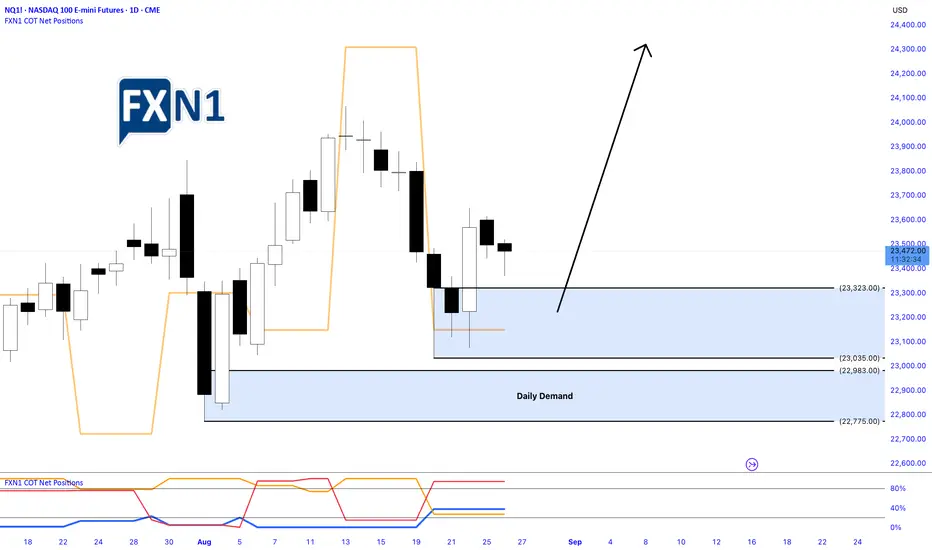
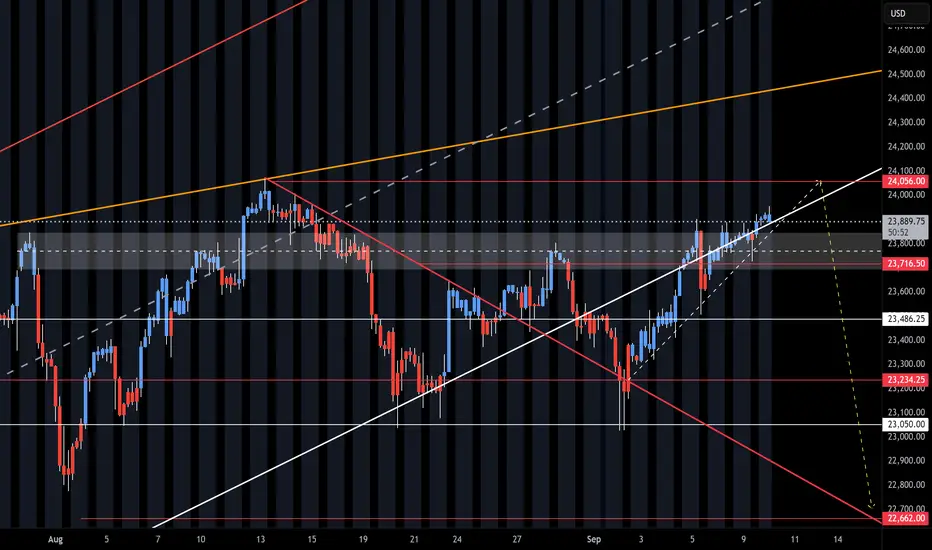
Nasdaq Pulls Back After Friday’s Rally: Identifying Demand ZoneYesterday, the Nasdaq underwent a pullback following a robust bullish surge on Friday. During this correction, a fresh Daily Demand Zone emerged on the chart, signaling potential support levels. Traders are now eyeing this area as an opportunity to position for a possible new high, should the market retrace further today. The current outlook favors a long setup, with anticipation of a continued upward move contingent on the price respecting the identified demand zone.
✅ Please share your thoughts about NQ1! in the comments section below and HIT LIKE if you appreciate my analysis. Don't forget to FOLLOW ME; you will help us a lot with this small contribution.
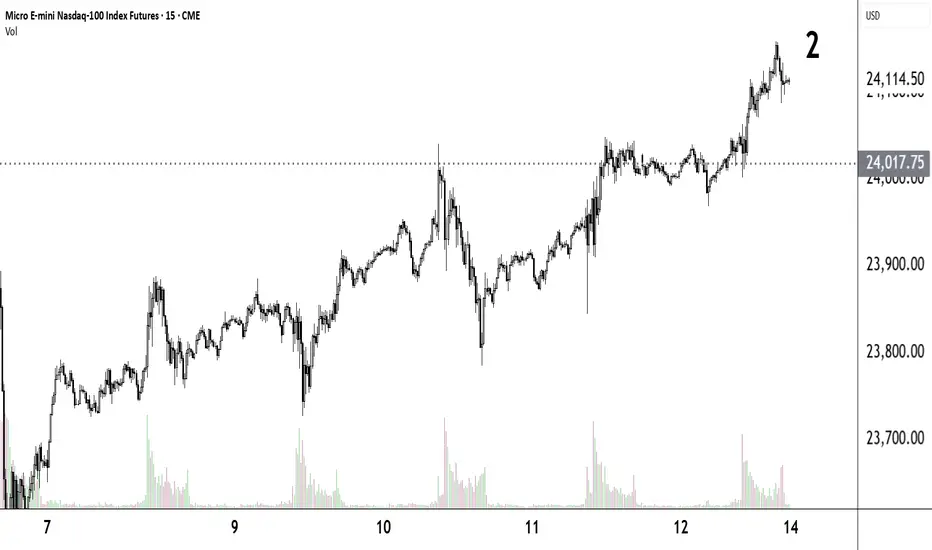
Buy the DipHere is the most recent Buy the Dip area. It is a beautiful accumulation/distribution area. The 24,017.75 blue line through the middle is the prior day's close, frequently a good pivot point. It is also POC for 9/9 to the present.
Protect the King.

Dow Futures Trade /LongI plan to get better with my videos and explainations. I am a futures stock and forex trader. I have mastered charting assets of any class using price action. This is a current long idea and active trade. We are breaking all time highs on the nasdaq and I want to be apart of that journey.

Wyckoff VSA - Why Buying Happens On Down Moves/Selling Up MovesThe Markets move on supply and demand, no supply and no demand and cause and effect, effort vs result.
This short video shows why and how.

NQ Power Range Report with FIB Ext - 9/12/2025 SessionCME_MINI:NQU2025
- PR High: 24029.25
- PR Low: 24001.00
- NZ Spread: 63.25
No key scheduled economic events
Teasing ATH break
Session Open Stats (As of 12:45 AM 9/12)
- Session Open ATR: 277.00
- Volume: 17K
- Open Int: 283K
- Trend Grade: Long
- From BA ATH: -0.1% (Rounded)
Key Levels (Rounded - Think of these as ranges)
- Long: 24382
- Mid: 23239
- Short: 22096
Keep in mind this is not speculation or a prediction. Only a report of the Power Range with Fib extensions for target hunting. Do your DD! You determine your risk tolerance. You are fully capable of making your own decisions.
BA: Back Adjusted
BuZ/BeZ: Bull Zone / Bear Zone
NZ: Neutral Zone
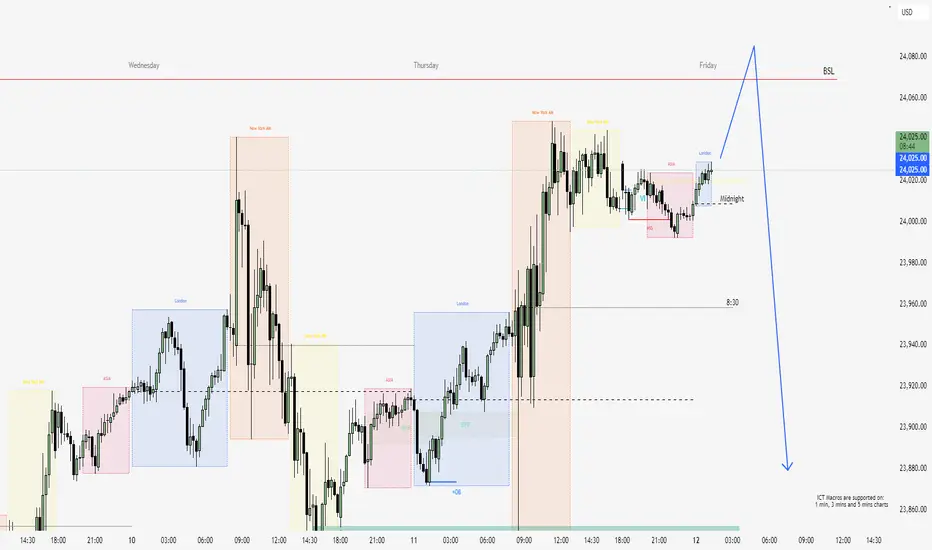
Friday Liquidity Sweep & Reversal Setup – NQNarrative:
Price action on NQ has swept the Buy Side Liquidity (BSL) on the daily timeframe around 24,060 during Thursday’s NY session. After the sweep, price consolidated just below the high, suggesting the potential for a Friday Reversal, in line with ICT’s classic "Reversal Friday" concept.
Today (Friday), I am watching for a potential Judas Swing to the upside during the New York AM session, aiming to lure breakout buyers above yesterday’s highs.
Once that buy-side liquidity is taken, I’ll look for:
A Market Structure Shift (MSS) on the 5M or 3M chart.
Entry on a Fair Value Gap (FVG) or a refined Order Block.
Stop Loss just above the Friday high (above the sweep).
Target 1: Return to the weekly open area or 1H OB.
Target 2: 23,880–23,900 → previous BPR zone and discount level.
Confluences:
✅ Daily BSL swept.
✅ Asian MSS already occurred.
✅ Price is sitting inside premium & consolidating.
🔍 Watching for SMT divergence between NQ and ES (S&P) – if ES breaks high and NQ doesn’t → bearish confirmation.
Execution:
Will wait for price to spike above the current range (Judas), then confirm BOS/MSS and enter short on the retracement.
Buy The Dip I always look to Buy the Dip. The green shaded area is prime territory. As you can see, it is an accumulation/distribution zone. The faint orange line through the middle of it was a vpoc from 8/27 - 9/04.
Depending on the chart, general tenor of the markets and/or any market moving news, I will place my orders in advance, kind of like a shark waiting for the prey to arrive. Otherwise, I wait for the bounce then I pounce. (A little Ali).
I buy 1 MNQ contract every 5 points. If the markets are sluggish my target is 16 points. If they are hopping my target is 21 points. My goal is five of these a day, five days a week. 16 x $2.00 - $.91 x 2 = $30.18 x 5 x 5 x 50(weeks) = $37,725.00.
Often the same entry will fill and hit its target more than once. In this chart let's say the 23,835 fills and quickly hits its target then I will enter that order a second time and maybe a third time. And so on down to the bottom of the shaded area.
Be careful with these. Read the charts and markets carefully. Always be certain you have enough margin to cover in case the px drops through the bottom. Sometimes it does.
I call these trades Fun Money.
It's a starting point. I usually average far more than 25 trades a week.

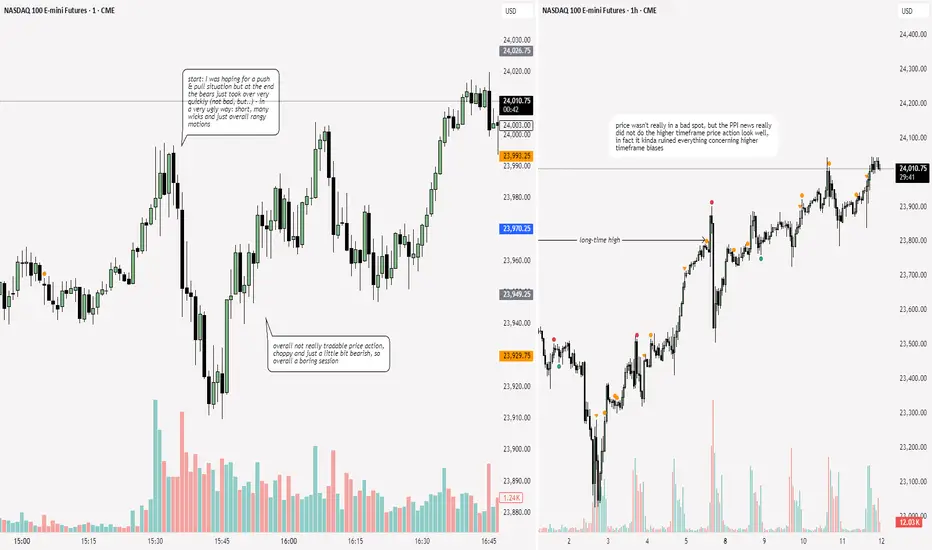
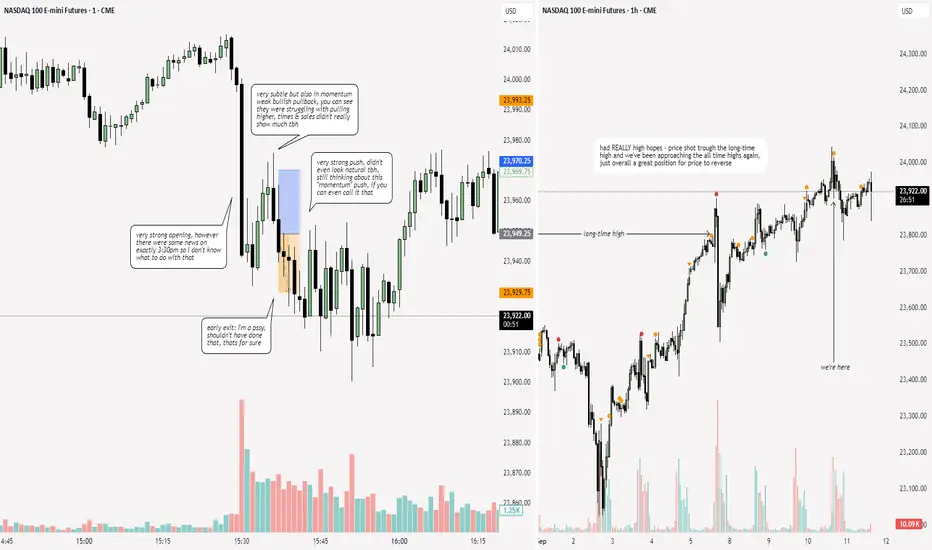
NQ: 250th trading session - recapBad session today due to really bad price action, I was really focused so that is not a problem
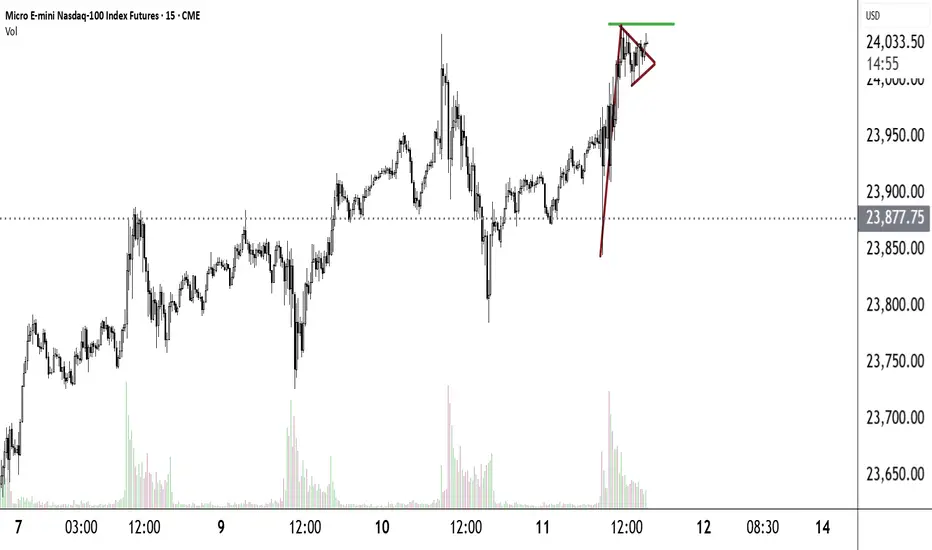
Buy The BreakoutBeautiful Pennant Pattern during a bull market.
I will buy the breakout at 24,050 and "climb the ladder". i.e. each 10 points I will buy 1 or more contracts with a 19 point target for each entry.
Multi-Asset Execution Chart Analysis & TradesAnalysis Date : September 11, 2025
Trading Analyst : Institutional Intelligence Framework
Methodology : Enhanced Dual Renko Chart System with Optimized Technical Indicators
Executive Summary
Execution chart analysis validates the exceptional institutional opportunities identified in our structure analysis. All three primary equity indices show perfect technical confirmation of institutional positioning with strong momentum indicators. Commodity and currency markets reveal significant technical conflicts requiring defensive positioning adjustments.
Enhanced Indicator Configuration
DMI/ADX Visual Standards :
ADX (Green) : Trend strength indicator (>25 = strong trend)
+DI (Blue) : Bullish directional movement
-DI (Red) : Bearish directional movement
Line Weight : 3pt for enhanced visibility
Dual Stochastics Configuration :
Tactical (5,3,3) : %K (Dark Blue), %D (Teal) - Short-term momentum
Strategic (50,3,3) : %K (Black), %D (Red Circles) - Medium-term context
Primary Opportunities - Technical Validation (75-85% Total Allocation)
1. DOW JONES (YM) - 30-35% ALLOCATION
Classification : OPTIMAL RISK/REWARD - Superior Technical Confirmation
YM Execution View:
Execution Signal Analysis :
DEMA Status : Bullish alignment confirmed (black above orange)
ADX : 47.74 (highest trend strength among all indices)
+DI/-DI Ratio : 2.69:1 bullish dominance
Momentum Quality : Exceptional - strongest ADX with optimal positioning
Stochastics : Tactical 98.86/84.24, Strategic 98.86/84.02 (peak momentum)
Technical Trade Setup :
Bullish Scenario (80% probability) :
Entry : /MYM at current levels 46,050 (optimal positioning confirmed)
Technical Edge : Strongest ADX + minimal extension risk
Stop Loss : 45,000 (2.3% risk - best among indices)
Target 1 : 47,000 (+2.1% - close 40% position)
Target 2 : 48,000 (+4.2% - close 30% position)
Trail Strategy : 150-point swing lows on remaining 30%
Consolidation Scenario (15% probability) :
Range : 45,500-46,500 around YTD POC consensus
Strategy : Accumulate on any dips to 45,700
Advantage : Minimal downside to institutional support
Risk Management : Optimal positioning within institutional zone
Bearish Scenario (5% probability) :
Trigger : Break below 45,000 (institutional consensus violation)
Action : Reduce position by 50%
Probability : Very low given YTD POC validation and technical strength
Re-entry : Require fresh institutional accumulation evidence
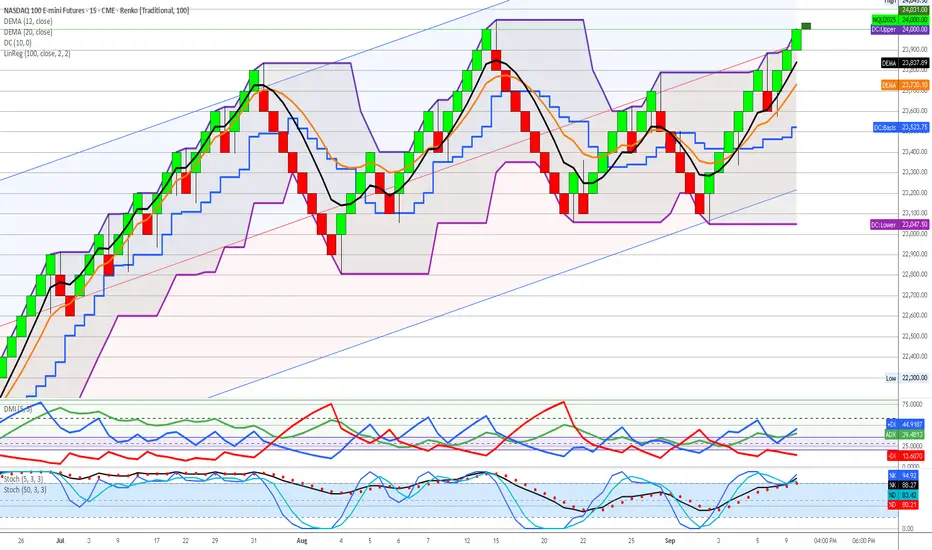
2. NASDAQ 100 (NQ) - 25-30% ALLOCATION
Classification : EXCEPTIONAL MOMENTUM - Exceptional Institutional Backing
NQ Execution View:
Execution Signal Analysis :
DEMA Status : Strong bullish alignment (black above orange)
ADX : 44.91 (exceptional trend strength)
+DI/-DI Ratio : 2.90:1 bullish dominance (highest among indices)
Momentum Quality : Exceptional directional bias
Stochastics : Tactical 88.27/80.21, Strategic 88.27/80.21 (strong sustainable)
Technical Trade Setup :
Bullish Scenario (75% probability) :
Entry : /MNQ at current levels or pullback to 23,700-23,800
Technical Edge : Highest +DI/-DI ratio with institutional backing
Stop Loss : 23,000 (4.3% risk)
Target 1 : 25,000 (+4.3% - close 50% position)
Target 2 : 25,500 (+6.1% - close 25% position)
Trail Strategy : 100-point swing lows on remaining 25%
Consolidation Scenario (20% probability) :
Range : 23,500-24,500 above institutional accumulation
Strategy : Scale into weakness, maintain core position
Management : Use tactical stochastics for entry timing
Support : 26.8:1 institutional backing provides confidence
Bearish Scenario (5% probability) :
Trigger : Break below 23,000 (Q3 POC violation)
Action : Exit all positions immediately
Reassessment : Wait for institutional re-accumulation
Probability : Very low given exceptional institutional support
3. S&P 500 (ES) - 20-25% ALLOCATION
Classification : SOLID CONFIRMATION - Strong Institutional Support
ES Execution View:
Execution Signal Analysis :
DEMA Status : Bullish alignment maintained (black above orange)
ADX : 41.32 (strong trend strength)
+DI/-DI Ratio : 1.74:1 bullish dominance
Momentum Quality : Solid institutional validation
Stochastics : Tactical 34.44/93.30, Strategic 98.26/95.30 (extreme overbought)
Technical Trade Setup :
Bullish Scenario (70% probability) :
Entry : /MES on any pullback to 6,450-6,500
Current Caution : Strategic stochastics extremely overbought
Stop Loss : 6,300 (3.8% risk)
Target 1 : 6,700 (+2.8% - close 50% position)
Target 2 : 6,800 (+4.4% - close 25% position)
Profit Management : Take profits on strength given overbought conditions
Consolidation Scenario (25% probability) :
Range : 6,400-6,600 around institutional levels
Strategy : Wait for tactical stochastics to reset before adding
Management : Reduce position size until momentum cools
Context : Strategic overbought suggests pause needed
Bearish Scenario (5% probability) :
Trigger : Break below 6,300 (institutional support failure)
Action : Systematic position reduction
Management : Tight stops given overbought technical readings
Re-entry : Wait for technical reset and institutional validation
Secondary Opportunities - Mixed Technical Signals (10-15% Total Allocation)
4. WTI CRUDE OIL (CL) - 8-12% ALLOCATION
Classification : INSTITUTIONAL CONFLICT - Defensive Positioning Required
CL Execution View:
Execution Signal Analysis :
DEMA Status : Bullish alignment (black above orange)
ADX : 42.19 (strong trend strength)
+DI/-DI Ratio : BEARISH 2.44:1 (-DI 42.10 vs +DI 17.86)
Critical Conflict : DEMA bullish vs DMI strongly bearish
Stochastics : Tactical 9.26/27.64, Strategic 27.64/33.61 (oversold setup)
Technical Trade Setup :
Bullish Scenario (45% probability) :
Entry Criteria : WAIT for +DI to cross above -DI for confirmation
Current Action : Reduce position size due to momentum conflict
Stop Loss : 61.50 (tight due to bearish momentum)
Target : 65.50 if technical alignment achieved
Risk Management : Maximum 1.5% account risk due to signal conflict
Neutral Scenario (35% probability) :
Range : 62.00-64.00 within institutional accumulation
Strategy : Maintain minimal defensive position
Monitoring : Daily +DI/-DI relationship for momentum shift
Institutional Support : Strong Q2 accumulation provides floor
Bearish Scenario (20% probability) :
Trigger : Break below 61.00 (institutional support failure)
Action : Complete position liquidation
Reason : Bearish momentum confirming institutional breakdown
Re-entry : 58.00 area (Q2 POC support) with technical confirmation
High-Risk Positions - Technical Deterioration (0-8% Total Allocation)
5. NATURAL GAS (NG) - 3-5% ALLOCATION
Classification : HIGH RISK - Institutional Disengagement Confirmed
NG Execution View:
Execution Signal Analysis :
DEMA Status : Bearish alignment (black below orange)
ADX : 42.79 (strong trend - bearish direction)
+DI/-DI Ratio : EXTREME BEARISH 6.30:1 (-DI 53.25 vs +DI 8.45)
Technical Reality : All major indicators bearishly aligned
Stochastics : Tactical 0.00/6.70 (maximum oversold), Strategic 51.98/65.70
Technical Trade Setup :
Bullish Scenario (20% probability) :
Entry Criteria : AVOID - all technical signals bearish
Required Confirmation : DEMA bullish cross + DMI reversal + institutional re-engagement
Current Action : Complete avoidance recommended
Speculative Only : Maximum 1% account risk if attempting reversal play
Neutral Scenario (30% probability) :
Range : 2.80-3.20 with declining institutional participation
Strategy : Avoid new positions, monitor for institutional return
Risk : 65% volume decline from Q1 peak activity
Liquidity : /MNG insufficient volume (13,991) for meaningful sizing
Bearish Scenario (50% probability) :
Continuation : Further decline toward 2.50-2.70 historical lows
Institutional Reality : Smart money disengagement pattern
Technical Confirmation : 6.30:1 bearish momentum supports decline
Strategy : Complete avoidance until institutional re-engagement
6. EURO FUTURES (6E) - 2-3% ALLOCATION
Classification : DANGEROUS EXTENSION - Technical Breakdown Confirmed
6E Execution View:
Execution Signal Analysis :
DEMA Status : Bearish crossover (black below orange)
ADX : 29.21 (moderate trend strength)
+DI/-DI Ratio : BEARISH 1.19:1 (-DI 29.21 vs +DI 24.49)
Extension Risk : 12.1% above YTD POC institutional consensus
Stochastics : Tactical 23.24/66.57, Strategic 74.26/90.89 (extremely overbought)
Technical Trade Setup :
Bullish Scenario (15% probability) :
Entry : AVOID - dangerous extension with technical breakdown
Existing Positions : Immediate systematic profit-taking required
Risk : Overextension + bearish technical = correction imminent
Management : Emergency profit-taking protocols engaged
Neutral Scenario (25% probability) :
Range : 1.1650-1.1800 at dangerous extension levels
Strategy : Avoid range trading given extension risk
Risk Assessment : All signals point to mean reversion
Professional Response : Defensive positioning only
Bearish Scenario (60% probability) :
Target : Return to YTD POC 1.0525 (-12.1% correction)
Technical Trigger : DEMA bearish cross + momentum deterioration
Strategy : Short opportunities on any strength above 1.1780
Entry : /M6E shorts with tight stops above 1.1820
Risk Control : Maximum 1% account risk given extension
7. GOLD FUTURES (GC) - 0% ALLOCATION
Classification : LIQUIDATION - High Risk Territory
GC Execution View:
Execution Signal Analysis :
DEMA Status : Bearish crossover from distribution highs
ADX : 34.91 (declining trend strength)
+DI/-DI Ratio : BEARISH 1.31:1 (-DI 34.91 vs +DI 26.64)
Extension Risk : 12.2%+ beyond ALL institutional positioning
Stochastics : Tactical 11.25/30.89, Strategic 89.46/93.86 (maximum overbought)
Technical Trade Setup :
Emergency Liquidation Protocol :
Immediate Action : Complete liquidation using market orders if necessary
Rationale : Void territory + technical breakdown = catastrophic risk
No Stops : Emergency exit protocols - immediate execution required
Reallocation : Proceeds to YM, NQ, ES primary opportunities immediately
Short Opportunity (High Probability) :
Strategy : /MGC shorts on any rallies above 2,690
Target : 2,380-2,400 (return to institutional zones)
Stop : 2,720 (tight risk control)
Correction Magnitude : 12-15% decline expected
Risk : Maximum 1% account risk for speculative short
Portfolio Risk Management Protocols
Position Sizing Framework
Maximum Risk Per Trade : 2% account value (1.5% for conflicted signals)
Portfolio Heat Limit : 15% total risk across all positions
Correlation Controls : Maximum 85% equity exposure given technical alignment
Cash Management : 5-10% opportunity fund for technical setups
Technical Signal Hierarchy
Primary Confirmation : DEMA + DMI + ADX alignment required
Entry Timing : Stochastics for tactical positioning optimization
Risk Management : Institutional levels for strategic stop placement
Profit Taking : Systematic protocol at 2:1, 3:1, trail remainder
Market Scenario Analysis
Scenario A: Continued Equity Strength (70% probability)
Characteristics : Technical momentum sustains institutional accumulation
Winners : YM, NQ, ES (maximize allocation to 85%)
Losers : GC, 6E (extension corrections accelerate)
Strategy : Aggressive equity positioning, complete defensive liquidation
Technical Catalyst : ADX strength maintenance + DEMA alignment
Scenario B: Technical Consolidation (25% probability)
Characteristics : Momentum indicators cool, range-bound trading
Management : Reduce position sizes, use stochastics for timing
Opportunity : Accumulate on pullbacks to institutional levels
Risk Control : Tighter stops, faster profit-taking on strength
Technical Signal : ADX decline below 35, stochastics reset
Scenario C: Technical Breakdown (5% probability)
Trigger : DEMA bearish crosses on primary indices
Action : Emergency position reduction protocols
Management : Systematic liquidation, increase cash to 25%+
Re-entry : Wait for institutional level retests with technical confirmation
Probability : Very low given exceptional institutional backing
Weekly Monitoring Checklist
Daily Technical Assessment
DEMA relationship maintenance across all positions
DMI momentum quality and directional bias confirmation
Stochastics positioning for entry/exit timing optimization
ADX strength validation for trend continuation
Risk Management Verification
Position sizing within 2% account risk per trade
Portfolio heat below 15% total risk exposure
Stop loss proximity to institutional support levels
Profit-taking discipline at predetermined targets
Technical Signal Evolution
Cross-asset momentum convergence/divergence analysis
Stochastics reset opportunities for position optimization
DEMA separation quality for trend strength assessment
Institutional level respect vs violation monitoring
Key Success Factors
Technical Execution Excellence
Signal Clarity : Enhanced visual indicators enable precise timing
Risk Discipline : Systematic adherence to technical signal hierarchy
Momentum Quality : ADX + DMI confirmation prevents false signals
Entry Optimization : Dual stochastics for tactical timing precision
Institutional Integration
Strategic Context : Structure charts provide positioning intelligence
Tactical Timing : Execution charts optimize entry/exit precision
Risk Management : Institutional levels anchor stop placement
Professional Standards : Both frameworks align for optimal decisions
Framework Validation Results
Primary Opportunities : Perfect technical confirmation of institutional intelligence
Risk Identification : Technical signals validate structure chart warnings
Professional Execution : Enhanced indicators enable institutional-grade precision
Capital Preservation : Systematic risk management across all timeframes
Risk Disclaimer : All trading involves substantial risk of loss. Past performance does not guarantee future results. Technical analysis and institutional intelligence frameworks are tools for risk assessment and should not be considered guaranteed predictors of future price movement. Position sizing and risk management protocols must be adjusted based on individual account size, risk tolerance, and market conditions.
Document Status : Active execution framework requiring daily technical monitoring and weekly risk assessment updates. Integration with structure analysis mandatory for optimal decision-making.
Framework Evolution : Enhanced visual indicators and systematic technical analysis represent significant advancement in execution precision. Continuous optimization based on market regime changes and signal quality assessment required.
NQ Range (09-10-25)NAZ has been nibbling higher for 3 days and stopping at 23,900. Turn Zone above is 24,060, watch O/N Pump/Dump today at Reg Session open. Looking for yellow arrow to play out. Watch the Tweets during the Dead Zone or any Govt issued news (to the Long side). These may be knee jerk head fake longs or stall out set up to the short side. No drop, BTD and FOMO with the crowd.
Multi-Asset Market Analysis & Trade IdeasAnalysis Date : September 10, 2025
Trading Analyst : Institutional Intelligence Framework
Methodology : Dual Renko Chart System with Enhanced Volume Profile Analysis
Executive Summary
Current market analysis reveals exceptional institutional opportunities across equity indices with significant commodity sector divergence. The enhanced institutional intelligence framework identifies unprecedented buying dominance in major equity markets while revealing dangerous extensions in traditional safe-haven assets.
Portfolio Allocation Strategy : 75-85% equity allocation with minimal commodity/currency exposure based on institutional positioning intelligence.
Primary Opportunities (70-85% Total Allocation)
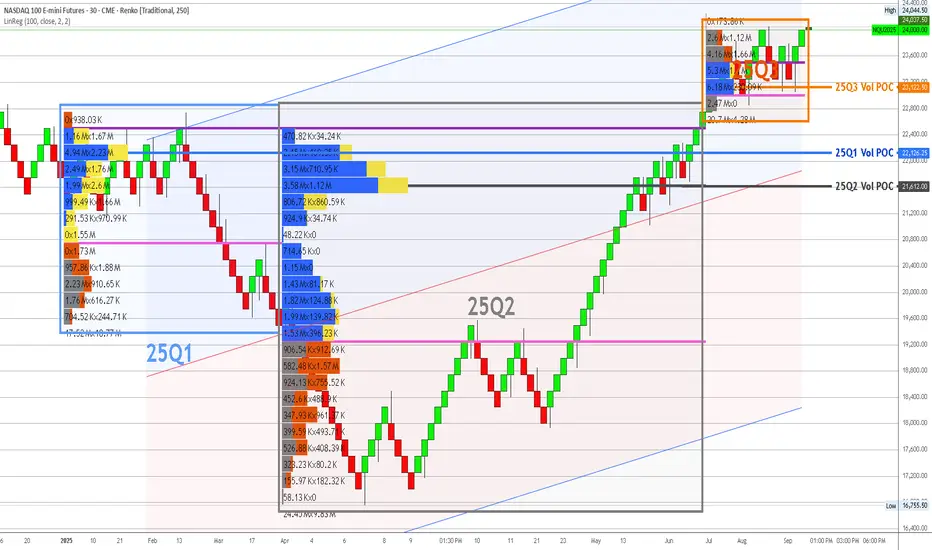
1. NASDAQ 100 (NQ) - 25-30% ALLOCATION
Classification : PRIMARY OPPORTUNITY - Institutional Backing
YTD View:
Institutional Intelligence :
Q3 Volume Analysis : 26.8:1 buying dominance (6.18M UP vs 230.69K DOWN)
Current Position : 23,963 (+3.4% above Q3 POC 23,186)
Support Structure : Exceptional multi-quarter institutional foundation
Risk Assessment : LOWEST RISK - strongest institutional conviction identified
Trade Recommendations :
Bullish Scenario (65% probability) :
Entry : /MNQ at current levels or any pullback to 23,500-23,600
Position Size : Maximum 2.5% account risk per position
Target 1 : 24,500 (close 50% position)
Target 2 : 25,000 (close 25% position)
Target 3 : 25,500+ (trail remaining 25%)
Stop Loss : 23,000 (below Q3 institutional support)
Neutral Scenario (25% probability) :
Range : 23,200-24,200 consolidation
Strategy : Scale into positions on weakness toward 23,400
Management : Hold core position, trade edges of range
Re-evaluation : Weekly basis for breakout confirmation
Bearish Scenario (10% probability) :
Trigger : Break below 23,000 (institutional support failure)
Action : Exit all positions immediately
Re-entry : Require fresh institutional accumulation evidence
Risk Control : Maximum 2% loss on allocation
2. S&P 500 (ES) - 25-30% ALLOCATION
Classification : PRIMARY OPPORTUNITY - Strong Institutional Support
3-QTR View:
YTD View:
Institutional Intelligence :
Q3 Volume Analysis : 5.21:1 buying dominance (11.3M UP vs 2.17M DOWN)
Current Position : 6,550 (+2.7% above Q3 POC 6,375)
Support Structure : Consistent institutional accumulation across quarters
Risk Assessment : LOW RISK - exceptional institutional backing
Trade Recommendations :
Bullish Scenario (70% probability) :
Entry : /MES at current levels or pullback to 6,450-6,500
Position Size : Maximum 2.5% account risk per position
Target 1 : 6,650 (close 50% position)
Target 2 : 6,750 (close 25% position)
Target 3 : 6,850+ (trail remaining 25%)
Stop Loss : 6,300 (below Q3 institutional support)
Neutral Scenario (20% probability) :
Range : 6,400-6,600 consolidation
Strategy : Accumulate on weakness, trim on strength
Management : Maintain core position size
Monitoring : Weekly institutional level respect
Bearish Scenario (10% probability) :
Trigger : Break below 6,300 (institutional support violation)
Action : Systematic position reduction
Stop Loss : 6,250 (complete exit level)
Re-entry : Wait for institutional re-engagement signals
3. DOW JONES (YM) - 20-25% ALLOCATION
Classification : HIGH CONVICTION - YTD POC Validation
3-QTR View:
YTD View:
Institutional Intelligence :
Q3 Volume Analysis : 11.5:1 buying dominance (455.32K UP vs 83.17K DOWN)
YTD POC Alignment : Perfect alignment with Q1 POC at 45,150
Current Position : 45,651 (+1.1% above institutional consensus)
Risk Assessment : VERY LOW RISK - optimal positioning
Trade Recommendations :
Bullish Scenario (75% probability) :
Entry : /MYM at current levels (optimal positioning confirmed)
Position Size : Maximum 2.5% account risk per position
Target 1 : 46,200 (close 40% position)
Target 2 : 46,800 (close 30% position)
Target 3 : 47,500+ (trail remaining 30%)
Stop Loss : 44,800 (below YTD/Q1 POC consensus)
Neutral Scenario (20% probability) :
Range : 45,000-46,000 consolidation around institutional consensus
Strategy : Hold core position, add on dips to 45,200
Management : Optimal risk/reward positioning maintained
Advantage : Minimal downside to institutional support
Bearish Scenario (5% probability) :
Trigger : Break below 45,000 (YTD POC violation)
Action : Reduce position by 50%
Ultimate Stop : 44,500 (complete exit)
Assessment : Highly unlikely given institutional validation
Secondary Opportunities (15-20% Total Allocation)
4. WTI CRUDE OIL (CL) - 15-20% ALLOCATION
Classification : SOLID OPPORTUNITY - Strong Institutional Foundation
3-QTR View:
YTD View:
Institutional Intelligence :
Q3 Volume Analysis : 1.94:1 buying dominance (1.38M UP vs 710.76K DOWN)
Current Position : 63.27 (within Q3 institutional accumulation zone)
Support Structure : Massive Q2 institutional accumulation at 57.50
Risk Assessment : LOW RISK - multiple institutional support layers
Trade Recommendations :
Bullish Scenario (60% probability) :
Entry : /MCL at current levels or pullback to 62.50-63.00
Position Size : Maximum 2% account risk per position
Target 1 : 67.00 (close 50% position)
Target 2 : 69.00 (close 25% position)
Target 3 : 71.00+ (trail remaining 25%)
Stop Loss : 61.50 (below Q3 institutional support)
Neutral Scenario (30% probability) :
Range : 62.00-65.00 consolidation within institutional zone
Strategy : Scale into positions on weakness
Management : Patient accumulation approach
Support : Strong institutional backing provides downside protection
Bearish Scenario (10% probability) :
Trigger : Break below 61.00 (institutional support failure)
Action : Exit positions systematically
Re-entry : 58.00 area (Q2 POC support)
Risk Management : Tight stops due to support proximity
Defensive Positions (8-12% Total Allocation)
5. NATURAL GAS (NG) - 8-12% ALLOCATION
Classification : MODERATE RISK - Declining Institutional Engagement
3-QTR View:
YTD View:
Institutional Intelligence :
Q3 Volume Analysis : Mixed activity with reduced institutional participation
Q1 Peak : 10.6:1 buying dominance (697K UP vs 65K DOWN) - historical high
Current Concern : 65% volume decline from Q1 peaks
Risk Assessment : MODERATE - institutional disengagement evident
Trade Recommendations :
Bullish Scenario (45% probability) :
Entry : Current levels only with tight risk controls
Position Size : Maximum 1.5% account risk per position
Target 1 : 3.40 (close 60% position)
Target 2 : 3.60 (close remaining 40%)
Stop Loss : 2.90 (below Q3 POC support)
Neutral Scenario (35% probability) :
Range : 3.00-3.20 consolidation
Strategy : Avoid new positions, monitor for re-engagement
Management : Maintain defensive positioning
Watch : Volume quality for institutional return
Bearish Scenario (20% probability) :
Trigger : Break below 2.90 (Q3 support failure)
Action : Complete position liquidation
Assessment : Institutional abandonment acceleration
Avoidance : No re-entry until fresh accumulation evidence
Risk Management Positions (8-13% Total Allocation)
6. EURO FUTURES (6E) - 5-8% ALLOCATION
Classification : DEFENSIVE ONLY - Dangerous Extension
3-QTR View:
YTD View:
Institutional Intelligence :
YTD POC Analysis : 1.0525 (aligned with Q1 POC)
Current Position : 1.1769 (+12.9% above institutional consensus)
Extension Risk : DANGEROUS - trading far beyond smart money positioning
Risk Assessment : HIGH RISK - profit-taking territory
Trade Recommendations :
Bullish Scenario (25% probability) :
Entry : AVOID new long positions
Existing Positions : Systematic profit-taking recommended
Target : 1.1850 maximum (close all positions)
Risk : Overextension beyond institutional support
Neutral Scenario (35% probability) :
Range : 1.1650-1.1800 at dangerous extension levels
Strategy : Range trading only with tight stops
Position Size : Maximum 1% account risk
Management : Defensive positioning required
Bearish Scenario (40% probability) :
Trigger : Any breakdown below 1.1700
Target : Return to institutional consensus (1.0525)
Action : Short opportunities on strength
Strategy : Mean reversion to YTD POC likely
7. GOLD FUTURES (GC) - 3-5% ALLOCATION
Classification : EXTREME CAUTION - Maximum Extension
3-QTR View:
YTD View:
Institutional Intelligence :
Extension Analysis : 12.2% above all institutional positioning
Q2 Peak Activity : 11.5:1 buying dominance at 3,430 levels
Current Position : 2,676 (extremely overextended)
Risk Assessment : MAXIMUM RISK - correction vulnerability
Trade Recommendations :
Bullish Scenario (15% probability) :
Entry : AVOID all new long positions
Existing : Immediate profit-taking recommended
Risk : Extreme overextension unsustainable
Management : Defensive exit strategy only
Neutral Scenario (25% probability) :
Range : 2,650-2,700 at unsustainable levels
Strategy : No positioning recommended
Assessment : Range trading too risky given extension
Monitoring : Watch for breakdown signals
Bearish Scenario (60% probability) :
Target : 3,400-3,500 (return to institutional zones)
Correction Magnitude : 12-15% decline likely
Strategy : Short opportunities on any strength
Entry : /MGC shorts on rallies above 2,690
Stop : 2,720 (tight risk control)
Target : 3,450 (institutional accumulation zone)
Risk Management Protocols
Position Sizing Framework
Maximum Risk Per Trade : 2% of account value
Maximum Sector Exposure : 6% (energy, metals, currencies)
Portfolio Heat : Maximum 15% total risk across all positions
Cash Reserve : 5-12% for opportunities and margin requirements
Stop Loss Hierarchy
Tactical Stops : 2-3 Renko blocks on execution charts
Strategic Stops : Below/above institutional POC levels
Emergency Stops : Below major quarterly support levels
Time Stops : Exit if no progress within 15 trading days
Profit Taking Protocol
Systematic Approach :
Target 1 : Close 40-50% of position at 2:1 risk/reward
Target 2 : Close 25-30% of position at 3:1 risk/reward
Target 3 : Trail remaining 20-25% with institutional level stops
Correlation Management
Equity Exposure : Maximum 75-85% combined (NQ+ES+YM)
Commodity Exposure : Maximum 25-30% combined (CL+NG)
Currency Exposure : Maximum 10% (6E only)
Safe Haven Exposure : Maximum 5% (GC defensive only)
Market Scenario Planning
Scenario A: Continued Equity Strength (60% probability)
Characteristics : Institutional accumulation continues, economic resilience
Winners : NQ, ES, YM (maximize equity allocation)
Losers : GC, 6E (extension corrections)
Strategy : Aggressive equity positioning, defensive commodity stance
Scenario B: Market Consolidation (25% probability)
Characteristics : Range-bound trading around institutional levels
Winners : YM (optimal positioning), CL (institutional support)
Neutral : NQ, ES (trade ranges)
Strategy : Reduce position sizes, focus on institutional level trading
Scenario C: Risk-Off Environment (15% probability)
Characteristics : Institutional support failure, flight to quality
Winners : Cash, defensive positioning
Losers : All risk assets
Strategy : Emergency protocols, systematic position reduction
Trigger : Break below major institutional support levels
Weekly Monitoring Checklist
Daily Assessment
Institutional POC level respect across all markets
Volume quality and institutional engagement trends
Position sizing within risk parameters
Stop loss proximity to institutional levels
Weekly Review
Portfolio allocation vs. target percentages
Risk/reward ratios for all open positions
Institutional volume profile evolution
Correlation analysis across positions
Performance tracking vs. benchmarks
Monthly Evaluation
Quarterly volume profile updates
YTD POC alignment reassessment
Strategy performance attribution
Risk management protocol effectiveness
Market regime change identification
Key Success Factors
Institutional Intelligence Priority
Decision Hierarchy :
Institutional volume profile positioning (strategic)
YTD POC alignment validation (tactical)
Technical indicator confirmation (execution)
Risk management protocols (defensive)
Discipline Requirements
Systematic adherence to position sizing formulas
Emotional detachment from individual trade outcomes
Institutional level respect over short-term price action
Professional risk management with systematic protocols
Performance Expectations
Win Rate Target : 55-65% (institutional backing advantage)
Risk/Reward Minimum : 2:1 average across all trades
Maximum Drawdown : <8% of trading capital
Consistency : Positive monthly returns 65%+ of time
Disclaimer : All trading involves risk of loss. Past performance does not guarantee future results. Position sizes and risk management protocols must be adjusted based on individual account size and risk tolerance. This analysis is for educational purposes and should not be considered personalized investment advice.
Document Status : Active trading framework requiring weekly updates and quarterly reassessment.
NQ: 249th trading session - recapSmall win yesterday, still thinking about it tbh, the trade was an A setup, without the higher timeframe confirmation I definitely SHOULD NOT have taken that - even on my eval, let alone on my funded acc
NQ Power Range Report with FIB Ext - 9/11/2025 SessionCME_MINI:NQU2025
- PR High: 23908.75
- PR Low: 23852.75
- NZ Spread: 125.25
Key scheduled economic events:
08:30 | Initial Jobless Claims
- CPI (Core|MoM|YoY)
13:00 | 30-Year Bond Auction
Temp 25% AMP margins increase for expected pre-RTH news-based volatility spike
Session Open Stats (As of 12:15 AM 9/11)
- Session Open ATR: 285.32
- Volume: 17K
- Open Int: 280K
- Trend Grade: Long
- From BA ATH: -0.7% (Rounded)
Key Levels (Rounded - Think of these as ranges)
- Long: 24382
- Mid: 23239
- Short: 22096
Keep in mind this is not speculation or a prediction. Only a report of the Power Range with Fib extensions for target hunting. Do your DD! You determine your risk tolerance. You are fully capable of making your own decisions.
BA: Back Adjusted
BuZ/BeZ: Bull Zone / Bear Zone
NZ: Neutral Zone
NQ FUTURES IDEA 9/11We are looking to re test the top of 24,000 NQ but first we will fall to 23,752 NQ. I think we trade around this 23,752 range and then start pushing back up to re test 24,000 NQ tomorrow. The Fed debates its next interest rate move, with markets pricing in a 90% chance of a 25 basis point cut at its policy meeting next week, according to the CME Fed Watch tool. I think this keeps use from pushing lower and i think we see a 50 basis point cut. The only thing that can stop this market is the unemployment rate above 5.3%. I think we get there next year the first quarter.
