Lessons Learned from Past Meltdowns (2008, 2020, etc.)1. The 2008 Financial Crisis: A Wake-Up Call for Systemic Risk
The 2008 Global Financial Crisis (GFC) was triggered by the collapse of the U.S. housing bubble, excessive leverage in financial institutions, and the widespread use of complex derivatives such as mortgage-backed securities (MBS) and collateralized debt obligations (CDOs). When Lehman Brothers filed for bankruptcy in September 2008, panic spread globally. The crisis led to trillions in lost wealth, millions of job losses, and the deepest recession since the Great Depression.
Key Lessons from 2008:
a. Importance of Transparency and Regulation:
The 2008 crisis revealed how opaque financial products and inadequate oversight can destabilize the entire financial ecosystem. Banks took excessive risks without sufficient capital buffers, while rating agencies failed to assess true risk levels. Post-crisis reforms, such as Basel III norms, Dodd-Frank Act, and stress testing frameworks, were introduced to improve capital adequacy, liquidity, and accountability.
b. Systemic Risk Can Spread Rapidly:
The interconnection of global banks turned what began as a housing market issue into a worldwide meltdown. The concept of “too big to fail” became central to financial discourse. The lesson: monitoring systemic risk is as important as regulating individual institutions. Financial contagion can cross borders instantly, necessitating global cooperation among central banks and regulators.
c. Moral Hazard and Bailouts:
Massive government bailouts (e.g., TARP in the U.S.) saved the system but raised questions about moral hazard—whether saving reckless institutions encourages future risk-taking. The lesson was clear: regulation should prevent risk-taking before it requires taxpayer-funded rescues.
d. The Role of Monetary Policy:
Central banks realized their power and limitations. The U.S. Federal Reserve’s near-zero interest rate policy and quantitative easing (QE) became critical tools to stabilize markets. However, these also laid the groundwork for future inflationary pressures and asset bubbles. Lesson: monetary easing is effective but must be balanced with fiscal prudence and structural reforms.
e. Behavioral Economics Matters:
Investor psychology—greed during booms and fear during crashes—played a decisive role. Overconfidence, herd behavior, and the illusion of endless housing price appreciation fueled the bubble. Behavioral finance emerged as a crucial field for understanding and mitigating irrational market behavior.
2. The 2020 Pandemic Crash: A Crisis Like No Other
Unlike 2008, which was a financial crisis rooted in excess and mismanagement, the 2020 crash was a health crisis turned economic catastrophe. When COVID-19 spread globally in early 2020, lockdowns halted production, trade, and travel, triggering a sudden and sharp global recession. Stock markets collapsed, oil prices turned negative, and unemployment soared. Yet, recovery was surprisingly swift—thanks to unprecedented fiscal and monetary interventions.
Key Lessons from 2020:
a. Speed and Scale of Policy Response Matter:
Governments and central banks acted far faster in 2020 than in 2008. The U.S. Federal Reserve slashed rates to zero within weeks and launched unlimited QE, while fiscal packages like the CARES Act pumped trillions into the economy. Similarly, India announced the Atmanirbhar Bharat stimulus. The lesson: speed and magnitude of support can prevent temporary shocks from becoming long-term depressions.
b. Technology as an Economic Lifeline:
The digital economy emerged as a savior. Remote work, e-commerce, fintech, and cloud computing allowed many sectors to survive and even thrive. The pandemic accelerated the digital transformation of business and finance, leading to greater adoption of digital payments, virtual collaboration, and online education. Lesson: digital infrastructure is not optional—it is a core pillar of economic resilience.
c. The Fragility of Global Supply Chains:
The shutdown of manufacturing hubs in China and other countries exposed how deeply global supply chains were interconnected and vulnerable. The shortage of semiconductors, medical supplies, and essential goods highlighted the risk of over-dependence on a few suppliers. Lesson: economies must build supply chain diversification and strategic self-reliance.
d. Inequality and Social Resilience:
The pandemic widened existing inequalities. While asset prices recovered quickly, millions of small businesses and low-income workers faced lasting damage. Lesson: inclusive recovery must be prioritized; safety nets and targeted fiscal support are crucial for societal stability.
e. Investor Behavior and Market Resilience:
The 2020 crash also showcased how investor psychology had evolved. Retail investors, aided by trading apps and social media, became a dominant force. Markets rebounded sharply, partly due to liquidity and optimism about vaccines and technology. Lesson: information flow, sentiment, and social media can now move markets faster than ever.
3. Common Threads Between 2008 and 2020
Though different in origin, both crises shared key characteristics that reveal the vulnerabilities of modern capitalism.
a. Interconnected Global Systems:
Both crises demonstrated how local shocks quickly became global due to financial, trade, and psychological linkages. Whether it was mortgage-backed securities in 2008 or supply chain disruptions in 2020, the globalized economy magnifies contagion. The lesson: resilience depends on diversification—not isolation.
b. Central Bank Dominance:
In both crises, central banks played an unprecedented role. The Federal Reserve, European Central Bank, and others became the “market backstop.” Their actions stabilized confidence but also increased dependence on monetary intervention. This dependence raises long-term concerns about asset bubbles and debt sustainability.
c. The Importance of Communication and Trust:
Both meltdowns showed that trust is the ultimate currency in a crisis. When financial institutions, governments, or investors lose confidence, panic sets in faster than any policy can react. Transparent communication by policymakers can anchor expectations and prevent spirals of fear.
d. Innovation Follows Crisis:
Both periods triggered innovation. After 2008, fintech and blockchain rose from the ashes of mistrust in traditional banks. After 2020, remote work tech, digital health, and AI-driven analytics became mainstream. History proves: crises often accelerate technological and structural evolution.
4. Lessons for Policymakers
a. Build Buffer Capital and Fiscal Space:
Governments and banks must maintain sufficient reserves for emergencies. High fiscal deficits and excessive leverage before a crisis reduce the ability to respond later. Prudent fiscal management and healthy capital ratios are essential for resilience.
b. Develop Counter-Cyclical Tools:
Automatic stabilizers—such as unemployment benefits and targeted stimulus—can cushion economic shocks. Regulators must enforce counter-cyclical lending and investment practices to prevent overheating during booms.
c. Strengthen Global Coordination:
Global problems require global responses. The 2008 and 2020 crises both highlighted how coordination among G20 nations, IMF, and World Bank was vital. Shared frameworks for debt relief, liquidity swaps, and vaccine distribution illustrate the power of cooperation.
d. Invest in Data and Predictive Systems:
Early warning systems using AI and real-time data could help detect vulnerabilities before they escalate. Governments and financial regulators must embrace data-driven policy frameworks for crisis prevention.
5. Lessons for Financial Institutions
a. Risk Management Must Be Dynamic:
Traditional models failed to predict both crises. Stress testing must account for low-probability, high-impact events like pandemics or geopolitical disruptions. Banks must integrate climate risk, cyber risk, and behavioral risk into their frameworks.
b. Liquidity Is King:
Both meltdowns reinforced that liquidity dries up first in a panic. Institutions must maintain adequate short-term funding buffers. Central banks’ liquidity facilities are a lifeline, but dependence should be reduced through prudent planning.
c. ESG and Sustainable Finance:
The 2020 crisis emphasized environmental and social resilience. Firms with strong ESG principles fared better, reflecting investor preference for sustainability. Lesson: ethics and responsibility are now financial imperatives, not optional ideals.
6. Lessons for Investors
a. Stay Rational Amid Panic:
The biggest losses occur when investors react emotionally. Those who stayed invested or bought during the 2020 crash witnessed record recoveries. Lesson: time in the market often beats timing the market.
b. Diversification Works:
Diversified portfolios—across asset classes, sectors, and geographies—performed better in both crises. Lesson: never rely solely on one market or theme.
c. Long-Term Vision Pays Off:
Both crises produced winners—innovative companies that adapted early. Investors who focused on fundamentals and long-term growth stories reaped massive returns. Lesson: focus on quality, adaptability, and innovation.
7. Structural Shifts Triggered by Crises
a. Rise of Alternative Finance:
Post-2008, distrust in banks led to the growth of fintech, crypto assets, and decentralized finance (DeFi). These innovations democratized finance but also created new regulatory challenges.
b. Work and Consumption Redefined:
After 2020, remote work, digital payments, and online services became embedded in everyday life. Businesses now prioritize resilience over efficiency—shifting from “just-in-time” to “just-in-case” models.
c. Inflation and Monetary Reckoning:
Massive stimulus in 2020 eventually fueled inflationary pressures by 2022–23. This underscored that liquidity without productivity creates long-term imbalances. Lesson: monetary expansion must be matched with real economic output.
8. Preparing for the Next Crisis
While we can’t predict the next meltdown, we can prepare for it. Future shocks might stem from climate change, AI-driven job disruptions, or cyber warfare. The lessons from 2008 and 2020 teach us that flexibility, coordination, and foresight are the best defenses.
Anticipate the Unthinkable: Stress testing and scenario modeling must include black swan events.
Prioritize Human Capital: Education, healthcare, and social safety nets ensure societies rebound faster.
Embrace Sustainable Growth: Over-leverage and short-term gains always backfire.
Enhance Financial Literacy: Empowering individuals to understand risk and debt reduces systemic vulnerability.
Conclusion
The crises of 2008 and 2020 were vastly different in origin—one financial, the other biological—but they shared a common truth: economic systems are only as strong as the trust, transparency, and adaptability they embody. The lessons learned from these meltdowns go beyond economics—they speak to governance, ethics, and collective responsibility.
In both cases, the world witnessed immense pain but also extraordinary recovery and innovation. As we move deeper into an era of digital finance, geopolitical shifts, and environmental challenges, these lessons form the blueprint for building a resilient, equitable, and sustainable global economy—one that learns from its scars and grows stronger after every crisis.
Micro E-mini Nasdaq-100 Index Futures
No trades
Market insights

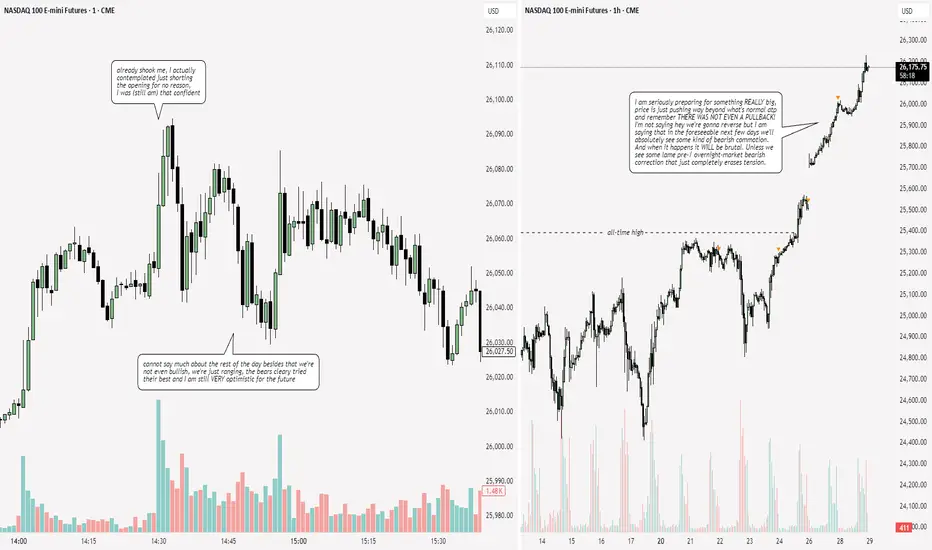
NQ: 278th trading session - recapGood session today, I'm just completely surprised again that we didn't get a single taste of bearish strength. I find it still very strange.
what if that was the meltup?think we get something like this going into Q1 '26
so many potential headwinds out there with the big boys priced for EXCEEDINGLY GOOD OUTCOMES...
lotta risk out there right now.
GOOD LUCK

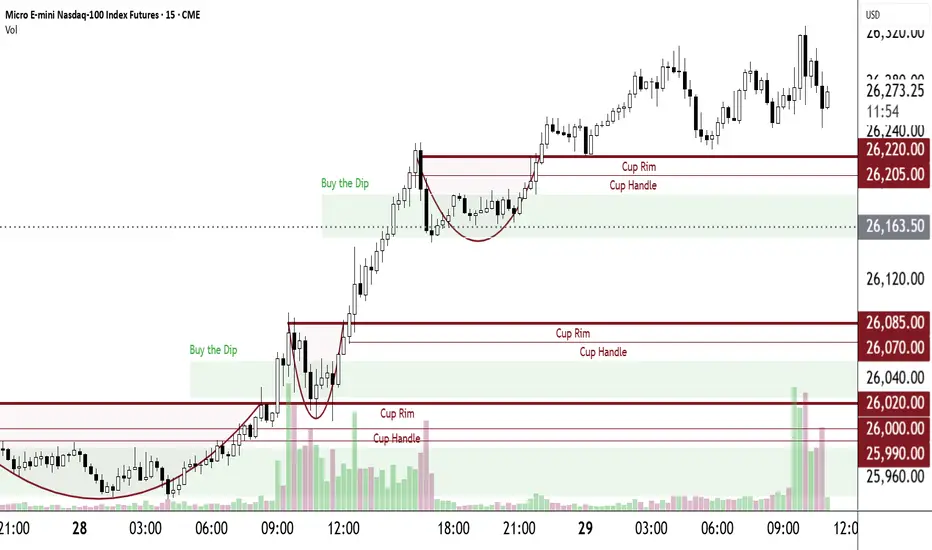
MNQ Ladder of SuccessEntries: every ought and every five. i.e. every number divisible by 10 and every number divisible by 5.
Exits: 19 points for each and every entry.
Stop Loss: none
Entry type: stop market
Exit type: stop limit
Example
Let's say this bounces on 26220 with a high of 26243.
Entries will start @ 26245 and every 5 points thereafter.
Exits will start @ 26264 and every 5 points thereafter
You are now on The MNQ Ladder of Success. Once you reach the fourth rung you will have a revenue stream every 5 points. Until you don't i.e. after a pullback. When there is a pullback, wait for a bounce and start the process all over again.
If you combine this with A Pawn for a King trading plan your first entry will be -1 @ 26244.50. Beginning @ 26245 and every 5 points thereafter you will buy 2 contracts.
Raw numbers on a page can be confusing and intimidating. Demo trade this and you will see its simplicity.
Don't forget the Pawn is redeemable after a pullback.
Simple short Idea on NQOnce we didn't have much speed after respecting 1st P.FVG and broke below the OB- I was short, watch and see how I managed the trade and my thoughts.

Short Analysis for the NQ ft. ES, DOW & DXYNQ: Range bound , 50/50 as of the time posting this; due to the discrepancies in the 3 sisters and the unreliability of the DXY.
ES: Same situation as the NQ
DOW: Potentially pursuing higher highs with a probability of dragging the NQ and the ES along with it. Although they do not show such interests for now.
News: CPI, PPI, Non-Farm and other market drivers coming up in the next few weeks, which might provide some clarity on the mid to short-term. Calling a top now would be equivalent to gambling, in my opinion.

NQ UpdateWaaaay overbought and they're still trying to pump NQ. I think Powell tanks the market tomorrow. If not Trump will Friday.
If there was ever a time to try to short QQQ or SPY, this is probably it, but options premiums are high so the return won't be very good. If you get next Friday's puts, you're gonna basically get 100% return if the gap fills.

NQ GOES TECH PARTY LIKE IT'S 1999, AHEAD OF ITS FINAL CRASHI was dreamin' when I wrote this
So sue me if I go too fast
But life is just a party
And parties weren't meant to last
...
I got a lion in my pocket
And, baby, he's ready to roar, yeah, yeah
Everybody's got a bomb
We could all die any day, oh
But before I'll let that happen
I'll dance my life away
Oh
Yeah
--
Best wishes,
@PandorraResearch Team

AMP Futures - Introducing Multi-Condition alertsIn this idea we will demonstrate how to create Multi-Condition alerts using Tradingview.

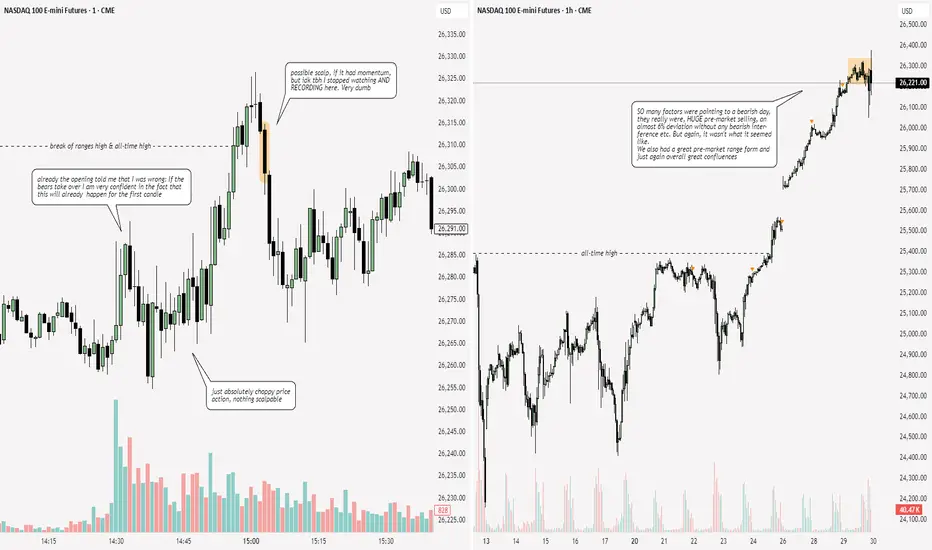
NQ: 277th trading session - recapVery interesting day today. I will be here tomorrow, but probably not on friday. I just really have to hope the bearish increase happens tomorrow or the day after that.
Pop Quiz5m chart. Which candle is shouting "I want to bounce!''? Correct - the 09:55 candle.
Where is it most likely to bounce? Correct once again - the Buy the Dip area especially at prior day's close.
Will it bounce here? Now that's the $64,000.00 question. Therein lies the challenge. As long as you manage your margin and as long as you have one or more Pawns in your pocket, you'll be fine. Prior posts go into both subjects in detail.

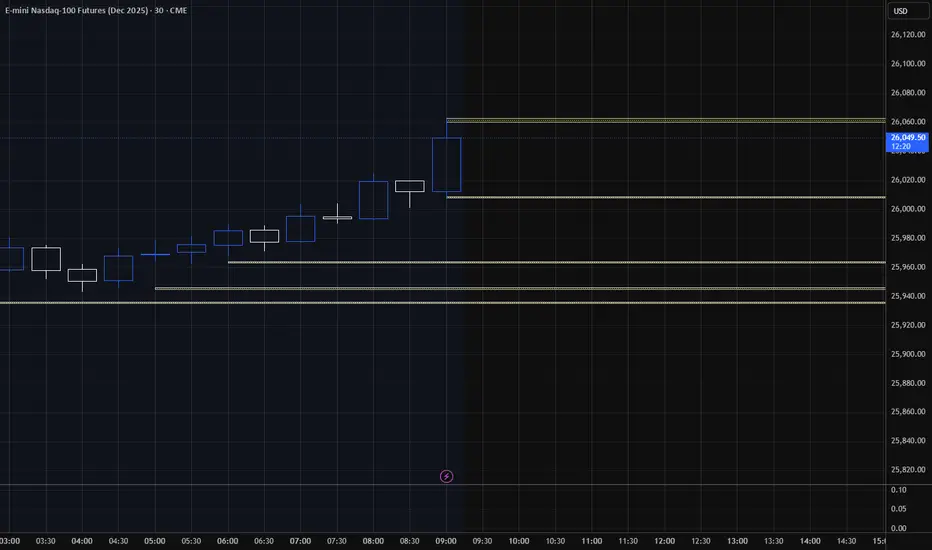
Target areas - NQ price for Market open.10/27/25 - These are the target areas - NQ price for Market open depending if price moves up or down. Will look for trades into these areas.
NQ UpdateI totally forgot about the Fed meeting this week.
NQ melting up like I suspected that it would even with two open gaps below. My guess here is that either Powell says something to tank the market or Trump does Friday, lol. Usually what happens when it climbs too high too fast. Or maybe it's buy the rumors, sell the news event.
The market will probably pump right up to the meeting. No point in buying puts until then. I might just stay out of it since the whipsaw is gonna be HUGE. There will be China trade news on Friday too.
RSI and MFI overbought, typical of a melt up, but something always ends a melt up.

"Duct Tape" RallySo says Brian Brenberg of Fox Business's The Big Money Show.
Hopeful news over the weekend about a possible easing of U.S.- China trade tensions gave us today's rally. It's just another duct tape patch. Communism is based on a lie. No matter how cleverly designed and alluring, a lie is still a lie.
"Rob, Replicate and Replace" is a term commonly used when referring to Communist China's Trade policy. Thankfully, for now, we have an administration that knows this and knows how to handle this. Of course, China will continue to lie, obfuscate and delay, delay and delay some more, waiting for a new administration that won't be wise.
Despite this ongoing tension that gives us "duct tape" rallies and volatility, we do have an historical bull market built upon the bedrock of The Fourth Industrial Revolution, strong earnings, an administration that is peace minded and has cut taxes and red tape resulting in powerful economic growth and we have several trade plans that give stellar profits in such an environment. This bull market should last for quite some time.
If you have been following prior posts you would have had your Breakout Trades stacked to the ceiling, ready and waiting for the gap up we had on the 10.26 open. You would have made a pretty good day's pay.
Here is another trade plan I use frequently. I call it a Joker. As with all prior posted trade plans, there's no brilliance here - just common sense. It's a combination of a pivot trade and a Buy the Dip trade. At or near the low of a Buy the Dip area I buy 1 or more MNQ contracts with a profit taker of 101 points. The extra point gives a solid $200.00 profit. I usually get several every week. As usual, I don't use a stop loss. Make sure you manage your margin with this and every prior posted trade plan.
"Behold, I send you forth as sheep in the midst of wolves: be ye therefore wise as serpents, and harmless as doves." Mt. 10:16

AMP Futures - How to create alerts for News Flow filtersIn this idea we will demonstrate how to enable alerts for your News Flow Filters using Tradingview.

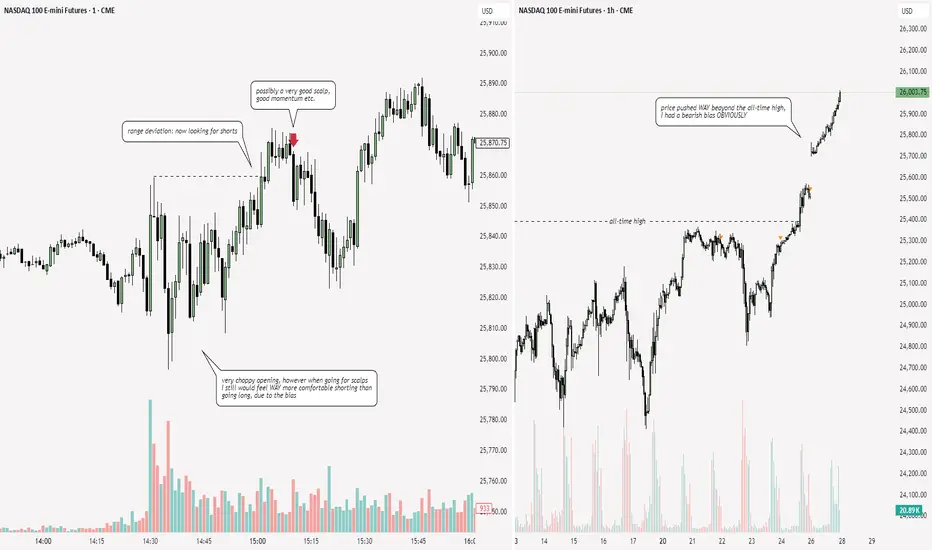
NQ: 276th trading session - recapI'm still contemplating whether I should focus on immediate price reversals when going for scalps that are primarily based off of structure...
Is Nasdaq Set for a Pullback? | Fibonacci Resistance Zone ahead!In this video I map out the idea of the Nasdaq being over extended and on route to approaching a key Fibonacci resistance level 27000 ,
This may set up a potential correction in the week ahead."
This is a counter-trend setup within a larger uptrend, so risk management is key. I'm not calling a top to the entire rally, but rather a healthy pullback to bring in new buyers."
I demonstrate how i see the price action moving forward over the course of the month ahead with valuable insights.
Tools used in this video Standard Fib , Fib Expansion, Fib extension + Anchored vwap and Volume profile and TPO chart

AMD Model 2025The AMD model in trading stands for Accumulation, Manipulation, and Distribution. It describes how institutional traders, often called smart money, move the market to collect liquidity and position themselves before the real trend begins.
In the accumulation phase, the market moves sideways and builds liquidity above and below the range. This phase is used by smart money to quietly enter positions while retail traders get impatient, waiting for a breakout. Liquidity builds up at both ends of the range, creating potential stop zones for future manipulation.
Next comes the manipulation phase, which is when the market makes a false move. Price breaks out of the range, sweeping liquidity and triggering breakout traders who believe a new trend has started. In reality, this move is designed to trap traders and collect their stop losses. Once that liquidity is taken, the market usually reverses in the opposite direction — this is where smart money starts positioning for the true move.
Finally, the distribution phase is the real directional move after manipulation. Here, the market shows a clear break of structure, and momentum shifts strongly in one direction. This is when smart money distributes their positions for profit, while late traders are often caught on the wrong side.
The AMD model repeats across all timeframes — from daily to one-minute charts — and helps traders understand the logic behind market moves. To trade using AMD, you identify the range (accumulation), wait for the liquidity sweep (manipulation), and then enter after confirmation of the new trend (distribution). This model is simple but powerful, as it shows how liquidity, structure, and market psychology combine to create the rhythm of price movement.

Target areas - NQ price for Market open.10/27/25 - These are the target areas - NQ price for Market open depending if price moves up or down. Will look for trades into these areas.

NQ = week 44T.A explained -
BS & FS levels are expected support when dashed lines, tested when dotted and resistance when solid lines.
The inverse is true for the Inv. BS Inv. FS levels, they are resistance as dashed lines, tested as dotted and support as solid lines.
Monthly timeframe is color pink
weekly grey
daily is red
4hr is orange
1hr is yellow
15min is blue
5min is green if they are shown.
strength favors the higher timeframe.
2x dotted levels are origin levels where trends have or will originate. When trends break, price will target the origin of the trend. its math, when the trend breaks, the vertex breaks too so the higher timeframe level/trend that breaks, the more volatility there could be as strength in the orders flow in to fuel the move.

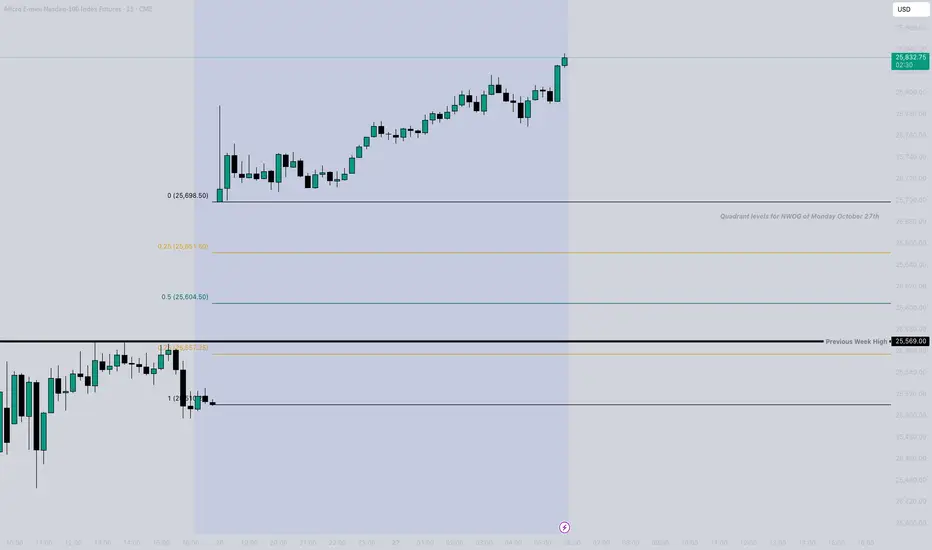
Monday October 27th New Week Opening Gap! Price created a huge gap this week that I will be shifting my attention to going into this weeks trading. I want to keep an eye for how price will likely use this NWOG with lots of medium and high impact news coming into this week as well. No news today so I won't be expecting anything extreme for a casual Monday trade but more focusing on what clues price can leave us that will give us a clear direction for the remainder of the week.
PRICE FLOW MNQZ2025This week, the price flow, for this week we are going to look for a rebalance and we will have sales. First, we expect the price to reach the level of $25,788, then we will look for sales down to 25,290. Be attentive to the economic calendar, which can cause significant distortions in the price path performance.
