Big bearmarket on NQ1! I assume the market is going down ca. 5%The Nasdaq (NQ) is a highly liquidity-driven market, dominated by technology stocks that react strongly to interest rates, monetary policy, and institutional positioning. Price movements are often not driven by news itself, but by where liquidity is resting.
Markets tend to move toward obvious highs and lows because that is where stop orders and resting liquidity accumulate. When the Nasdaq trades above prior highs, it often triggers buy-side liquidity, such as stop losses from short sellers and breakout buyers. Once this liquidity is absorbed by larger players, buying pressure can quickly weaken, creating conditions for a reversal lower.
Another key factor is institutional distribution. During extended rallies, smart money often sells into strength while retail traders continue to buy. This distribution typically occurs near range highs, equal highs, or premium price zones, where liquidity is highest. After distribution is complete, price no longer has the support needed to continue higher.
From a liquidity perspective, a decline in NQ is likely when buy-side liquidity above highs has been taken, price fails to hold above key resistance, market structure shifts from higher highs to lower highs, and sell-side liquidity below recent lows becomes the next target.
In such scenarios, the market seeks sell-side liquidity below previous lows, value areas, or unfilled inefficiencies. This downward move is not random but a natural rebalancing process, allowing institutions to enter or re-accumulate at lower, more favorable prices.
In summary, the Nasdaq falls not because of fear or headlines, but because liquidity has already been collected on the upside, and price must move lower to find new liquidity and restore balance.
Micro E-mini Nasdaq-100 Index Futures
No trades
Market insights


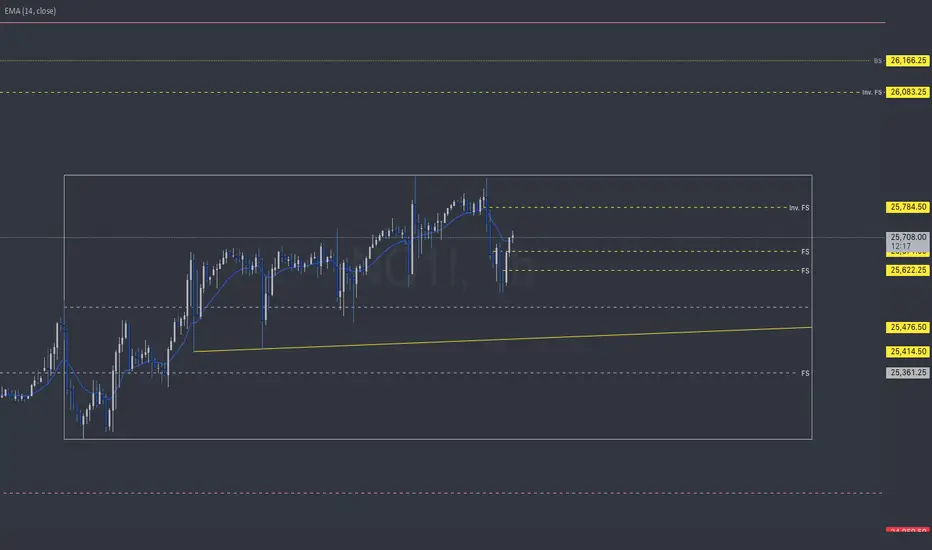
NQ | WK 51T.A explained -
BackSide (BS)
FrontSide (FS)
Inverse BS (Inv.BS)
Inverse FS (Inv.FS)
BS & FS levels are expected support when dashed lines, tested when dotted and resistance when solid lines.
The inverse is true for the Inv. BS Inv. FS levels, they are resistance as dashed lines, tested as dotted and support as solid lines.
Monthly timeframe is color pink
weekly grey
daily is red
4hr is orange
1hr is yellow
15min is blue
5min is green if they are shown.
strength favors the higher timeframe.
2x dotted levels are origin levels where trends have or will originate. When trends break, price will target the origin of the trend. its math, when the trend breaks, the vertex breaks too so the higher timeframe level/trend that breaks, the more volatility there could be as strength in the orders flow in to fuel the move.

NQ Power Range Report with FIB Ext - 12/15/2025 SessionCME_MINI:NQH2026
- PR High: 25245.25
- PR Low: 25132.50
- NZ Spread: 252.25
No key scheduled economic events
Index futures contract rollover week
Session Open Stats (As of 12:25 AM)
- Session Open ATR: 434.10
- Volume: 17K
- Open Int: 60K
- Trend Grade: Long
- From BA ATH: -4.2% (Rounded)
Key Levels (Rounded - Think of these as ranges)
- Long: 26521
- Mid: 25264
- Short: 24008
Keep in mind this is not speculation or a prediction. Only a report of the Power Range with Fib extensions for target hunting. Do your DD! You determine your risk tolerance. You are fully capable of making your own decisions.
BA: Back Adjusted
BuZ/BeZ: Bull Zone / Bear Zone
NZ: Neutral Zone

My Weekly NQ Analysis
We can see NQ push to the upside is getting heavy and create a MMXM Market Maker Sell Model. Friday had a 500 point sell off. This could be a liquidity grab from 25,200 zone. If so price may show some signs of reversing back to all time highs. But if it continues to fall we could see price go to these targets before the bulls gain control again.
24,600
24,363
23,903 at which if price reaches here and continues downwards it may drop drastically to the equal lows of
23,284 zone. At which you could refer to my previous post with lower levels.
I've marked out a 4hr Sibi that price created Friday Dec 12th (25,400). Price will reveal its intent when entering this zone. As well as Thur/Friday daily gap @25,654 @ which price could reach to these area's before continuing its bear run.
But if Price finds support and maintain structure above CE consequent encroachment or upper quadrants of these two inefficiencies then price will likely target all time highs ATH.
Trade Safe

NQ Weekly planlooks like NQ going to test support down around 24.600 usd. given the fact of rate cuts and all positive fundmental news, i would count for a reversal to the upside. But brutal correction first.

#202550 - priceactiontds - weekly update - nasdaq e-miniGood Evening and I hope you are well.
comment: Neutral. Huge vol increase late on Friday where the market found it’s bottom. Is this bullish or bearish? More often that not, before markets make new highs, we see a deeper pullback where bulls step aside to the violently buy it but this deep was maybe a bit too deep. So if we keep the gap to 25370 open, it’s bearish af but if it closes, we could see another meltup for 26000. Also, 50% retracement from October ath to November low and November low to December high, do the middle of those two and you are pretty much on point for 25000. We will hit 25000 this year again, for sure but again, I don’t know if we could not melt another time for 26000 before or after.
current market cycle: trading range
key levels for next week: 24800 - 26000
bull case: Bulls have been buying everything since the November low, will they buy this deeper dip as well in hopes for 26000? It’s the first daily bar below the daily 20ema for 3 weeks and chances are bigger for bulls than for the bears but the selling was so strong that I think most bulls will wait and we will see some sideways movement first.
Invalidation is below 24800
bear case: Bears got the first bear bar closing on it’s low and it might have trapped many bulls. If some sort of profit-fear takes over, we could go lower because bears still have the r:r on their side because we could very well go down to 24300ish again. For now I don’t think many bears will push their luck and take profit’s but let’s see what happens on Monday.
Invalidation is above 25400, at least for another round of 25700ish if not 26000
short term: Neutral.
medium-long term - Update from 2024-12-06: 24150 was my latest more realistic bear target for this year and we got 23904. Year end close around 25000 most likely.

NQ | Week 50 | 1hr chartT.A explained -
BackSide (BS)
FrontSide (FS)
Inverse BS (Inv.BS)
Inverse FS (Inv.FS)
BS & FS levels are expected support when dashed lines, tested when dotted and resistance when solid lines.
The inverse is true for the Inv. BS Inv. FS levels, they are resistance as dashed lines, tested as dotted and support as solid lines.
Monthly timeframe is color pink
weekly grey
daily is red
4hr is orange
1hr is yellow
15min is blue
5min is green if they are shown.
strength favors the higher timeframe.
2x dotted levels are origin levels where trends have or will originate. When trends break, price will target the origin of the trend. its math, when the trend breaks, the vertex breaks too so the higher timeframe level/trend that breaks, the more volatility there could be as strength in the orders flow in to fuel the move.
NQ Weekly Outlook | December 8–12, 20251H Market Structure Overview
The first half of the week was choppy and range-bound due to FOMC, leading to overlapping candles and unclear structure. After FOMC passed, price action on Thursday and Friday became much cleaner. On the 1H timeframe, NQ transitioned into bearish structure, printing lower highs followed by a strong downside impulse. Sellers remained in control into the end of the week, breaking prior intraday support and shifting short-term momentum to the downside.
Bias
Bearish on 1H heading into the next week — favoring downside continuation while price remains below prior structure highs. Bias can change if price reclaims broken structure and begins forming higher lows, but current momentum favors sellers.
What We Want to See Next
Bullish scenario:
Price holds current lows and reclaims short-term structure with a clear higher low on the 1H. Acceptance back into prior consolidation could allow a move toward previous range highs, but this would require strong follow-through.
Bearish scenario:
Price continues to respect prior support as resistance after any pullbacks. As long as lower highs continue to form, further downside remains favored, especially with cleaner post-FOMC price action now in effect.


NQ dailyWhat i currently see on the NQ daily chart, drawn out. Added TrenVantage LITE to plot out the trends but highlighted the important ones for us here. The regain is technically on if they lose then it seems new lows are likely.


NQ Power Range Report with FIB Ext - 12/12/2025 SessionCME_MINI:NQZ2025
- PR High: 25733.25
- PR Low: 25648.75
- NZ Spread: 189.5
No key scheduled economic events
Session gap -0.42%, open above 25833
Session Open Stats (As of 12:45 AM)
- Session Open ATR: 404.03
- Volume: 27K
- Open Int: 295K
- Trend Grade: Long
- From BA ATH: -2.6% (Rounded)
Key Levels (Rounded - Think of these as ranges)
- Long: 26521
- Mid: 25264
- Short: 24008
Keep in mind this is not speculation or a prediction. Only a report of the Power Range with Fib extensions for target hunting. Do your DD! You determine your risk tolerance. You are fully capable of making your own decisions.
BA: Back Adjusted
BuZ/BeZ: Bull Zone / Bear Zone
NZ: Neutral Zone

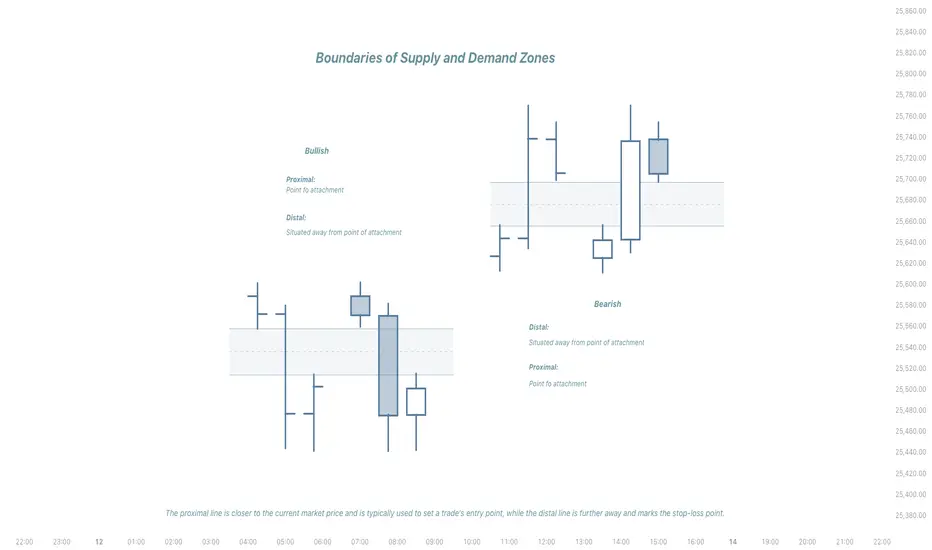
BISI/SIBI Structure with chart examples/Proximal and DistalProximal and Distal
The terms proximal and distal are used to describe the location of other structures relative to this specific point.
The proximal line is closer to the current market price and is typically used to set a trade's entry point, while the distal line is further away and marks the stop-loss point.
Proximal and distal refer to lines that define the boundaries of supply and demand zones.
Proximal- situated nearer to the center of the body or the point of attachment.
Distal- situated away from the center of the body or from the point of attachment.
NQ Power Range Report with FIB Ext - 12/11/2025 SessionCME_MINI:NQZ2025
- PR High: 25796.00
- PR Low: 25715.75
- NZ Spread: 179.25
Key scheduled economic events:
08:30 | Initial Jobless Claims
12:00 | 30-Year Bond Auction
Session Open Stats (As of 12:35 AM).
- Session Open ATR: 415.83
- Volume: 55K
- Open Int: 311K
- Trend Grade: Long
- From BA ATH: -3.4% (Rounded)
Key Levels (Rounded - Think of these as ranges)
- Long: 26521
- Mid: 25264
- Short: 24008
Keep in mind this is not speculation or a prediction. Only a report of the Power Range with Fib extensions for target hunting. Do your DD! You determine your risk tolerance. You are fully capable of making your own decisions.
BA: Back Adjusted
BuZ/BeZ: Bull Zone / Bear Zone
NZ: Neutral Zone
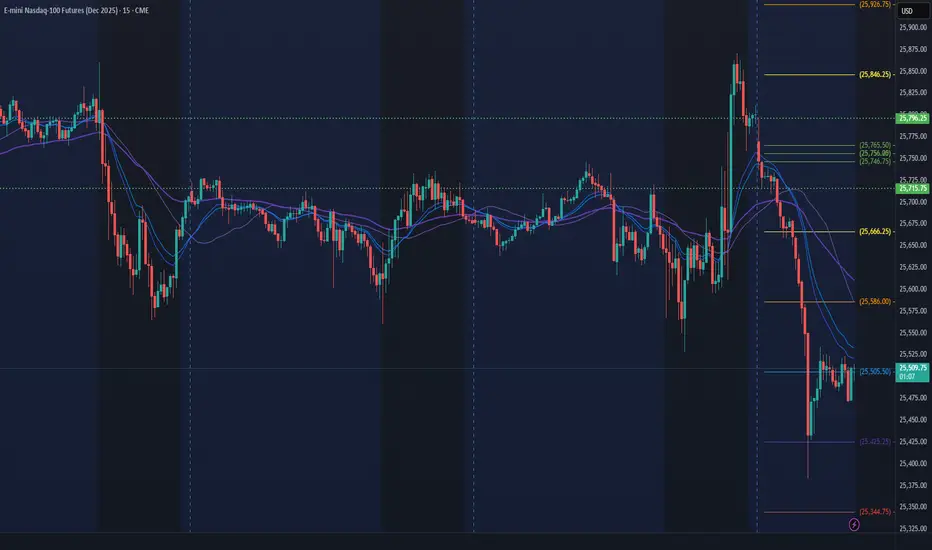
Benner Cycle 2026 Crash - Has It Started on NQ & SPX?On this chart I’m lining up the Benner Cycle’s 2026 “crash window” with NQ’s fixed volume profile from April’s low to October’s high.
The top orange line is VAH, the second orange line is VAL, and the green line is POC. As long as price holds above POC, we’re just rotating in value. A clean break and daily close below POC opens the door to HVN 1, then VAL & HVN 2 as the next major support shelves. If HVN 1 and HVN 2 both fail, that lines up almost perfectly with Benner’s 2026 panic leg and raises the odds that this isn’t just a pullback, but the start of a larger cycle top in NQ (and likely SPX as well).
My short bias holds while we’re below VAH.
Invalidation: Strong daily close back above VAH.
First downside objective: POC, then HVN 1 and HVN 2 if value breaks and the selling accelerates.
Not financial advice – just my roadmap if the Benner 2026 window is starting to play out.

NQ 100 point calloutTradingview atleast for me doesnt allow me to show the small time frames 1-5m where I have all my markings but the reversal was pretty easy and clear to spot. Your IHS into your bull flag with your rounded bottom.

NQNice retracement from todays FOMC. Going to look for longs once we take out some liquidity to continue to the upside

Calling Santa´s rallyyeap lets ask the Lord and Santa to take us to paradise,
olympus, or any heaven u wish ASAP.
nothing else
Merry Chrismas to Everybody even hades thinkers ;)

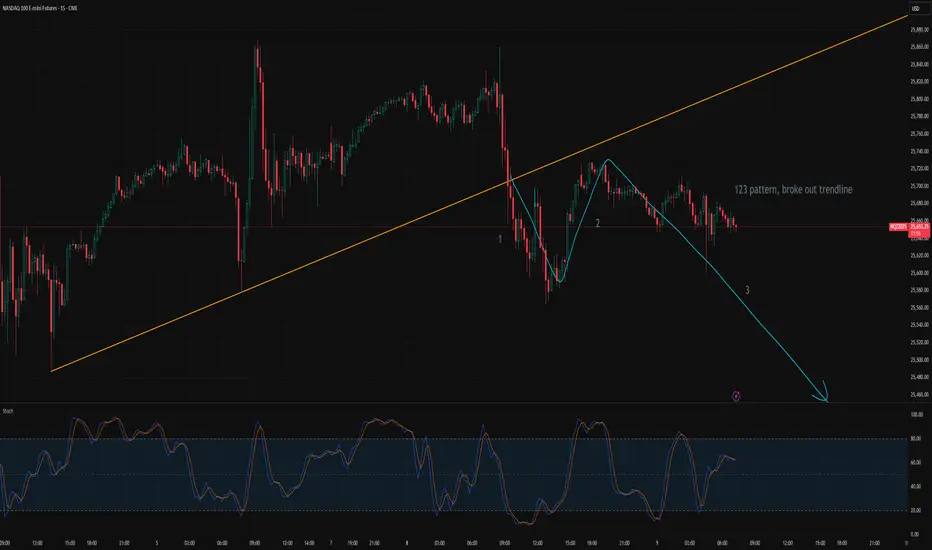
Trendline Break and Weak Retest Hint at Deeper PullbackI believe the market is currently forming a classic 1-2-3 pattern along the trendline. The price has already broken below the rising trendline, and the subsequent pullback failed to reclaim the previous high, which strengthens the bearish signal. If this structure continues to play out, the next step will likely be a clean break of the neckline, confirming a potential trend reversal. After the neckline is breached, the market may experience a short period of consolidation or a multi-day pullback before choosing its next direction.
ICT liquidity sweep entry on fvgPrice swept highs and had a market structure shift and may go to internal liquidity

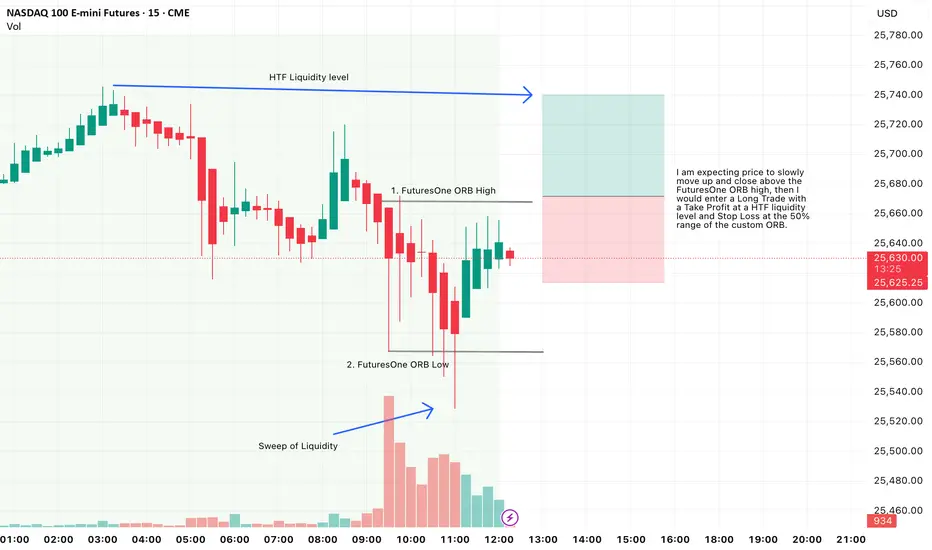
NQ1 Long, Using FuturesOne ORB System for HTF Bias & EntryFor this setup, I am expecting price to slowly move up and close above the FuturesOne ORB high, then I would enter a Long Trade with a Take Profit at a HTF liquidity level and Stop Loss at the 50% range of the custom ORB.