NASDAQ ANALYSIS ON 30 MIN CHART Long & Short analysis on nasdaq based purely on high-probability zones. i trade from zones only—because when price enters a valid zone, a move is expected. these zones are not session or time dependent. execution, risk management, and psychology decide how much you extract from that move. analysis alone never guarantees profits. discipline does.
trade smart. manage risk. stay consistent.
happy trading.
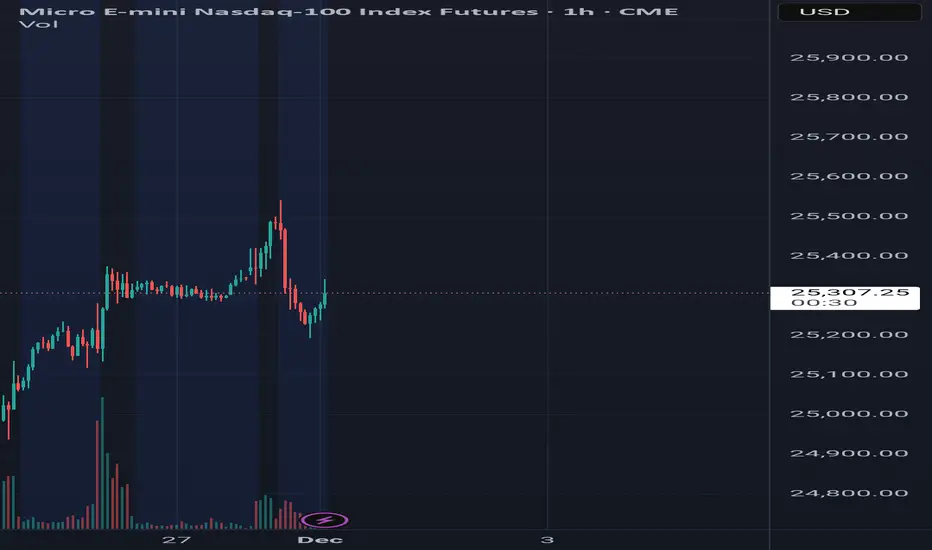
Micro E-mini Nasdaq-100 Index Futures
No trades
Market insights
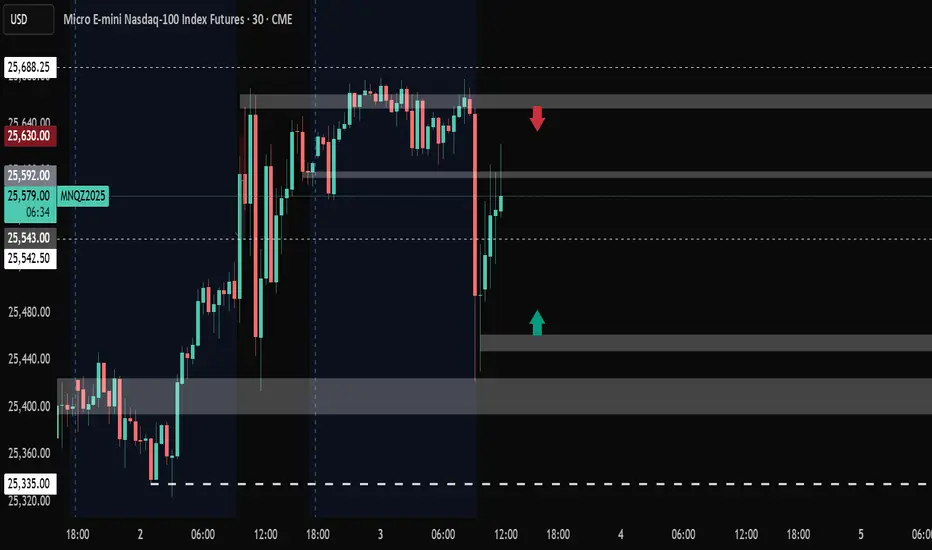
Flipping bias based on price actionFlipping Bias mid macro as price action is clearly respecting bullish scenario's.

NQ | Wednesday December 03, 2025The previous day’s high was raided during the Asian session, after which price retraced into the 4H bullish volume imbalance and rejected from that area.
Key Levels I’m Watching:
Buyside Liquidity:
> Midnight high at 25,678.25
> November 13, 2025 old high at 25,721.75
> November 12, 2025 old high at 25,829.50
Sellside Liquidity:
> Pre-market low at 25,614.75 — below this sits the 4H volume imbalance
> Swing low at 25,576.00
This is a live market read and levels are subject to change as price action develops.

NQ Power Range Report with FIB Ext - 12/3/2025 SessionCME_MINI:NQZ2025
- PR High: 25633.50
- PR Low: 25610.00
- NZ Spread: 52.5
Key scheduled economic events:
08:15 | ADP Nonfarm Employment Change
09:45 | S&P Global Services PMI
10:00 | ISM Non-Manufacturing PMI
- ISM Non-Manufacturing Prices
Session Open Stats (As of 12:15 AM)
- Session Open ATR: 469.32
- Volume: 24K
- Open Int: 302K
- Trend Grade: Long
- From BA ATH: -2.7% (Rounded)
Key Levels (Rounded - Think of these as ranges)
- Long: 26636
- Mid: 25410
- Short: 23426
Keep in mind this is not speculation or a prediction. Only a report of the Power Range with Fib extensions for target hunting. Do your DD! You determine your risk tolerance. You are fully capable of making your own decisions.
BA: Back Adjusted
BuZ/BeZ: Bull Zone / Bear Zone
NZ: Neutral Zone
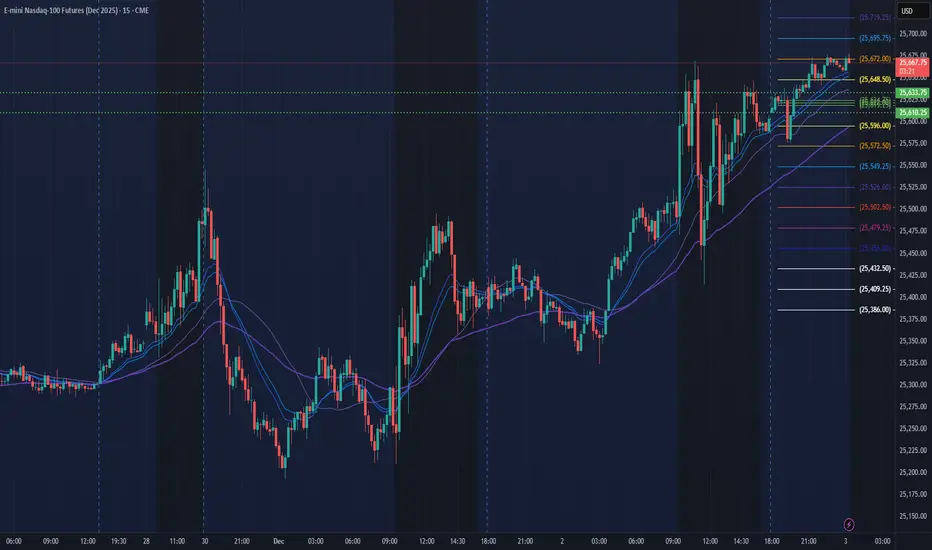
Location 15m NY Session 1 Dec 2025There are 2 setups based on a 15 minute structure on 1st December 2025.
Location 1 :
- Trend buy
- Structure breakout buy
Location 2 :
- Trend buy
- Structure breakout buy

Scalping NQ in the asian sessionMy setup shows up in multiple different places and sessions. I take advantage of this run on lows, next is fair value, OB, or Breaker levels is my last line of defense. I prefer the low.

Location 30m NY Session 1 Dec 2025There are 3 setups based on a 30 minute structure on 1st December 2025.
Location 1 :
- Structure breakout buy
Location 2 :
- Structure breakout buy
Location 3 :
- Structure breakout buy

NQ Short (12-02-25)Easy one from here, Long above 25340-360 and Short below. Let the Overnight lift and stall and look at Reg Session Open Drive for a drop test. Tweets, Tricks and low volume periods are only challenge on this one.
NQ: 286th trading session - recapI am SO back. Last week: Monday was aigh, had to time on tuesday, wednesday I had school and thursday and friday was no action due to thanksgiving.
I am mentally in a really good spot again and I focus my time on scalping again.

NQ UpdateLooks like it's still melting up, though it's a slow melt up.
Probably not gonna trade today.

NQ1 - DAY TRDERS OUTLOOK GUIDE FOR 202-12-02Good Morning,
I hope all is well. I always trade with the overall market trend. Here is my guide for the day.
Likely Scenarios for Today
Scenario A – Most Probable (≈60%): Bullish Grind with Pullbacks
Price dips into 25,350–25,300, finds buyers at the EMAs.
Momentum rebuilds.
Slow grind upward toward 25,600 retest.
You will see:
MACD curling upward
DI+ widening over DI-
ADX flat or slightly rising
Best play: Buy the pullback into hourly support.
Scenario B – Rejection and Deeper Pullback (≈30%)
If price loses 25,300, the market likely accelerates downward into:
25,150 (trend-support reset)
Possibly 25,000 liquidation sweep
The indicators would show:
MACD bear cross
DI- crossing above DI+
Oscillators breaking below midline
This would be the only bearish scenario worth taking seriously.
Scenario C – Immediate Breakout (≈10%)
Price surges through 25,600 early in the session and runs momentum into:
25,720
25,850 as the extension
But volume suggests this is less likely unless macro news triggers it.
Today’s Bias Summary
Trend: Bullish
Momentum: Cooling
ADX: Weak trend
Structure: Rising into overhead supply
Key battleground: 25,350 support vs 25,600 resistance
Bias:
Bullish continuation IF 25,300 holds.
Bearish flush IF 25,300 fails.
Hope you Enjoy!

NQ Power Range Report with FIB Ext - 12/2/2025 SessionCME_MINI:NQZ2025
- PR High: 25425.00
- PR Low: 25378.50
- NZ Spread: 104.0
Key scheduled economic events:
10:00 | JOLTs Job Openings
Session Open Stats (As of 12:15 AM)
- Session Open ATR: 479.80
- Volume: 28K
- Open Int: 299K
- Trend Grade: Long
- From BA ATH: -3.7% (Rounded)
Key Levels (Rounded - Think of these as ranges)
- Long: 26636
- Mid: 25410
- Short: 23426
Keep in mind this is not speculation or a prediction. Only a report of the Power Range with Fib extensions for target hunting. Do your DD! You determine your risk tolerance. You are fully capable of making your own decisions.
BA: Back Adjusted
BuZ/BeZ: Bull Zone / Bear Zone
NZ: Neutral Zone

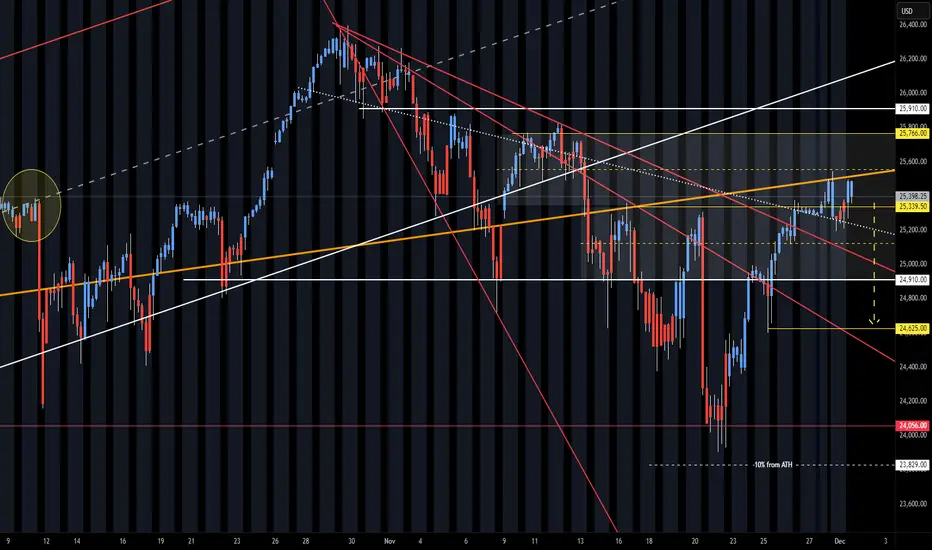
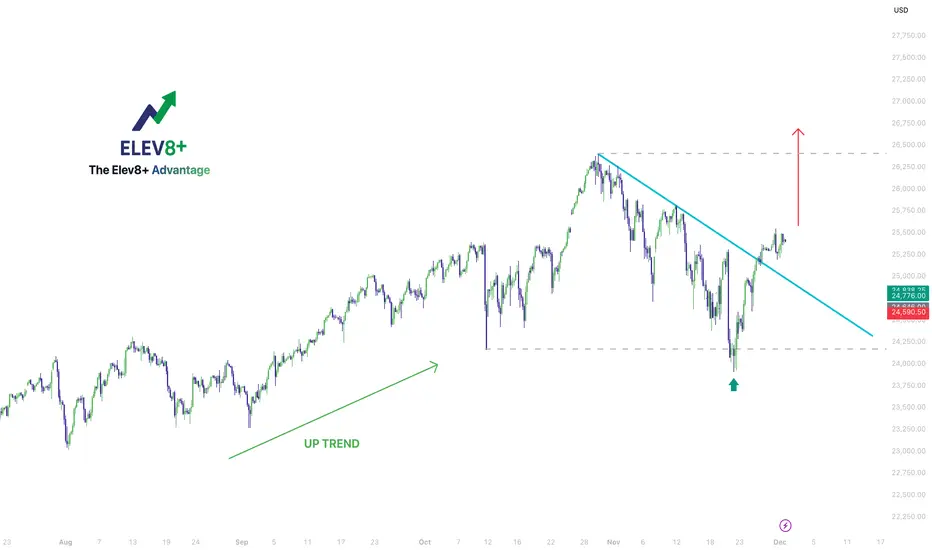
Trendline Break Signals a Possible Shift Back Toward ATH on NQThe broader market structure continues to maintain its upward trajectory, despite the recent corrective leg. Price responded decisively from a key demand area and has now broken above the multi-touch descending trendline that defined the pullback phase. This type of structural break is often interpreted as an early sign that bearish momentum is fading.
Several technical elements stand out:
• The long-term uptrend remains intact, supported by higher swing lows
• A sharp rejection from the recent low suggests renewed participation from buyers
• The descending trendline has been cleanly reclaimed, indicating a potential shift in market character
• A wide, untested range overhead remains a notable area of interest should momentum continue to build
This analysis highlights the evolving structure and the levels currently shaping market behavior. This is not a trade signal, but rather an observation of the technical conditions I’m monitoring.
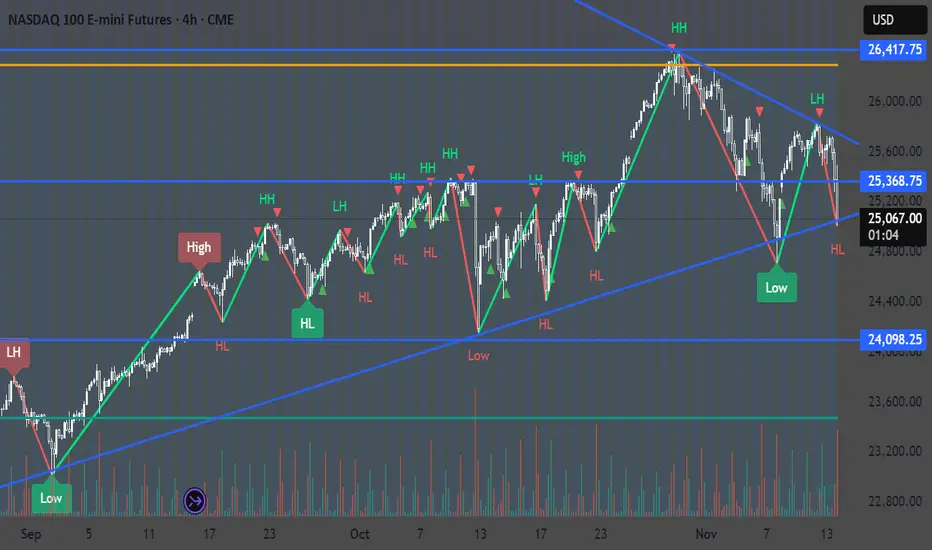
NASDAQ 100: Bullish! Look For Valid Buys With The Trend!Welcome back to the Weekly Forex Forecast for the week of Dec. 1-5th.
In this video, we will analyze the following FX market: NASDAQ (NQ1!) NAS100
The NASDAQ closed last week strong. It would indicated the potential for follow through going into this week, at least early.
Bear in mind that the previous 3 weeks were very bearish, coming down from ATHs, and forming a bearish MSS.
Look out for confirmations for valid trades. The overall trend is bullish, so I am personally looking for valid buys. A bearish MSS would invalidate those ideas.
Enjoy!
May profits be upon you.
Leave any questions or comments in the comment section.
I appreciate any feedback from my viewers!
Like and/or subscribe if you want more accurate analysis.
Thank you so much!
Disclaimer:
I do not provide personal investment advice and I am not a qualified licensed investment advisor.
All information found here, including any ideas, opinions, views, predictions, forecasts, commentaries, suggestions, expressed or implied herein, are for informational, entertainment or educational purposes only and should not be construed as personal investment advice. While the information provided is believed to be accurate, it may include errors or inaccuracies.
I will not and cannot be held liable for any actions you take as a result of anything you read here.
Conduct your own due diligence, or consult a licensed financial advisor or broker before making any and all investment decisions. Any investments, trades, speculations, or decisions made on the basis of any information found on this channel, expressed or implied herein, are committed at your own risk, financial or otherwise.

This is Monday we'll look at shorter contractsTake a look at the patterns on smaller contracts of gold silver and there was an oil market that we didn't get to see because I didn't know how to push the buttons and there's another market as well that we talked about all of them less risky but rest good return but not you know they you don't if you start trading these markets you have to trade the smaller contracts and then you get a feel.

NQ Range (12-01-25)NAZ lower in O/N and inside wide Churn Zone, look Long above 25339 and Short below 25,125. May see opposite direction trades at these levels and some sideways churn until breakout. Look at 1,000 point range of 25,910 - 24,910 as a wider CZ range.

NQ1 - Holding... Santa Rally Incoming?NQ1 Indices1
Still looking dangerous in the short term having printed a quick slump through resistance.
But its holding here and perhaps it can continue up from here.
If it was going to collapse then we might see plenty of leading slumps in stocks.
And we are seeing slump action in crypto and crypto stocks, but most stocks that I cover are looking positive and pushing up as we enter December.
Could a Santa Rally be on 🤨🎅.


Target areas - NQ price for Market open.12/1/25 - These are the target areas - NQ price for Market open depending if price moves up or down. Will look for trades into these areas.

How International Finance Has Transformed1. From Gold Standard to Fiat and Floating Exchange Rates
One of the most significant transformations occurred in the 20th century when countries moved away from the gold standard, where currencies were directly linked to gold reserves. This system promoted stability but limited monetary flexibility. The shift began after the Great Depression and was finalized when the Bretton Woods system collapsed in 1971, allowing currencies to float freely.
This change reshaped international finance in several ways:
Exchange rate volatility increased, creating new risks and opportunities for global trade.
Central banks gained more power, using interest rates and monetary tools to manage inflation, growth, and currency values.
Currency markets expanded, eventually becoming the world’s largest financial market.
The transition to floating exchange rates allowed greater economic independence but also made global finance more complex and sensitive to geopolitical events, speculation, and macroeconomic trends.
2. Globalization and the Surge of Cross-Border Capital Flows
After World War II and especially since the 1980s, globalization accelerated dramatically. Countries reduced trade barriers, opened financial markets, and encouraged foreign investment. As a result:
Foreign direct investment (FDI) surged as multinational corporations expanded production worldwide.
Portfolio investments grew rapidly, with investors buying stocks, bonds, and derivatives across borders.
Developing economies gained access to global capital, enabling faster growth but also exposing them to external shocks.
Globalization made capital mobile and interconnected but also increased financial contagion risk, as seen in the Asian Financial Crisis (1997), Global Financial Crisis (2008), and the market turmoil during the COVID-19 pandemic.
3. The Rise of International Financial Institutions
International finance today is heavily shaped by global institutions such as:
International Monetary Fund (IMF) – monitors global stability, provides financial assistance, and stabilizes exchange rates.
World Bank – funds development and infrastructure projects.
Bank for International Settlements (BIS) – coordinates central bank policies.
World Trade Organization (WTO) – facilitates trade rules and dispute resolutions.
These institutions did not exist or had limited roles in earlier eras. Their expansion reflects the growing interdependence of nations and the need for coordinated financial governance.
4. Technological Revolution: Digital Payments, Trading, and Banking
Perhaps the most revolutionary transformation has come from technology.
a. Digital Banking and Payments
The rise of online banking, mobile wallets, payment gateways, and instant settlement systems (like UPI, SWIFT gpi, SEPA, and FedNow) has changed how money moves globally. Cross-border transactions that took days now occur within minutes.
Key changes include:
E-payments replacing cash
Fintech companies disrupting traditional banking
Blockchain and cryptocurrency innovations introducing decentralized finance (DeFi)
b. Algorithmic and High-Frequency Trading (HFT)
Financial markets today rely heavily on:
Algorithmic trading
Machine learning-based decision systems
Microsecond-level execution speeds
This has transformed global foreign exchange, commodity futures, and stock markets, increasing liquidity but also raising concerns about flash crashes and systemic risk.
c. Cryptocurrencies and Digital Assets
Bitcoin, Ethereum, stablecoins, and central bank digital currencies (CBDCs) have altered the landscape by introducing:
Decentralized value transfer
Smart contracts
New investment vehicles
Alternatives to traditional banking systems
Countries like China have advanced digital currency initiatives (e-CNY), while many central banks are exploring or piloting CBDCs.
5. The Emergence of Global Financial Hubs
Cities such as New York, London, Singapore, Hong Kong, Dubai, and Tokyo have evolved into major financial centers. Their growth is driven by:
Attractive regulatory environments
Large capital pools
Expertise in asset management, banking, and trading
Connectivity to international markets
These hubs influence currency flows, investment trends, and global economic policies.
6. Transformation of Trade Finance and Global Supply Chains
Modern international finance supports complex global supply chains that operate through:
Letters of credit
Trade credit insurance
Supply chain finance
Blockchain-based trade settlement
Supply chains now stretch across continents, linking producers, distributors, and consumers worldwide. As a result, disruptions like the pandemic, geopolitical tensions, or shipping bottlenecks significantly impact international finance.
7. Regulatory Evolution and Risk Management
After major global crises, regulations have become stricter and more sophisticated.
Major reforms include:
Basel I, II, and III – strengthening banking capital requirements.
Dodd-Frank Act (2010) – increasing transparency and oversight of derivatives.
IFRS standards – aligning international accounting practices.
Anti-money laundering (AML) and KYC rules – reducing illegal finance.
These regulations aim to prevent systemic failures while promoting stable and transparent financial markets.
8. Geopolitics and International Finance
International finance today is heavily shaped by geopolitical dynamics:
Key developments:
US-China trade war reshaped supply chains and investment flows.
Sanctions on countries (Russia, Iran, etc.) influence global energy and commodity markets.
Rise of bilateral currency trade (like yuan settlements) reduces reliance on the dollar.
Regional trade blocs (EU, ASEAN, USMCA) shape economic cooperation.
Finance has become an instrument of geopolitical influence, with currencies, sanctions, and capital controls used strategically.
9. The Dominance of the US Dollar and Challenges Ahead
The US dollar remains the world's primary reserve and trade currency, giving the U.S. significant financial influence. However:
China’s yuan
Euro
Cryptocurrencies
CBDCs
are emerging as competitors. The future may see a more multipolar currency system.
10. The Future of International Finance
International finance continues to evolve. Key trends include:
Wider adoption of CBDCs and blockchain-based settlements
Green finance and ESG investments
AI-driven financial analysis and risk management
More regional and local currency trade
Reorganization of supply chains for resilience
The next decade will likely bring a more digital, decentralized, and multipolar global financial architecture.

December 1st action Hello,
The market is at 25320 is right now.
The market will either go down to 25200-25000 first or it will go up to 25400-25500 before returning to 25200 on the 1st of December.
This is how the whales are planning to manipulate it today.
possible bounce NQ from trendlineNQ is testing a 4h symmetrical traingle line sfp frome here might deliver a bounce or otherwise we go lower.