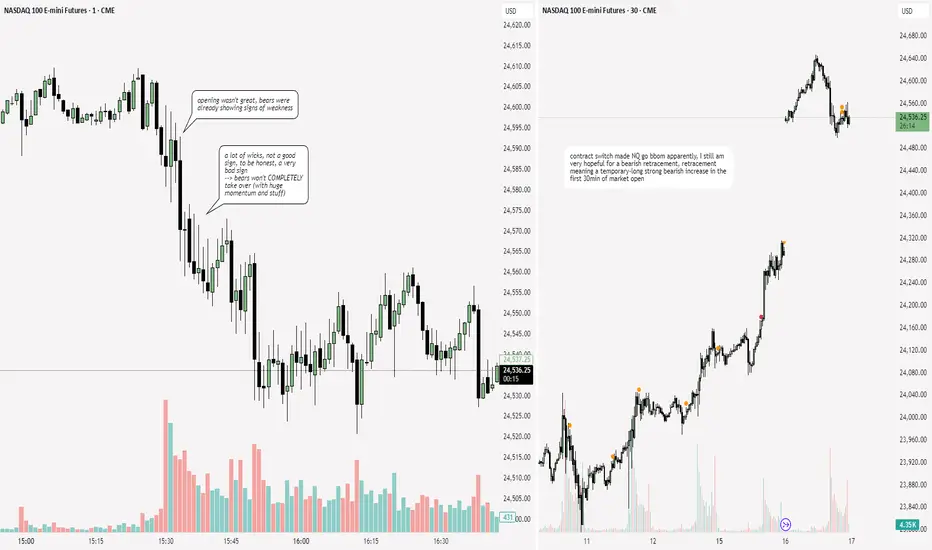
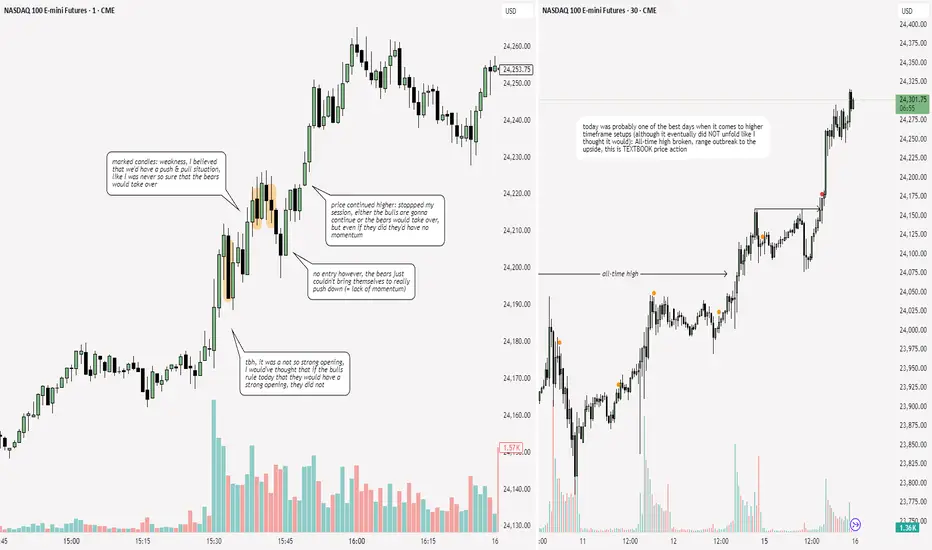
NQ: 253rd trading session - recapVery boring session, higher timeframe bias was great again but idk, session on its own was just pretty bad: No momentum, no setups in sight, no great price action etc
Trade ideas
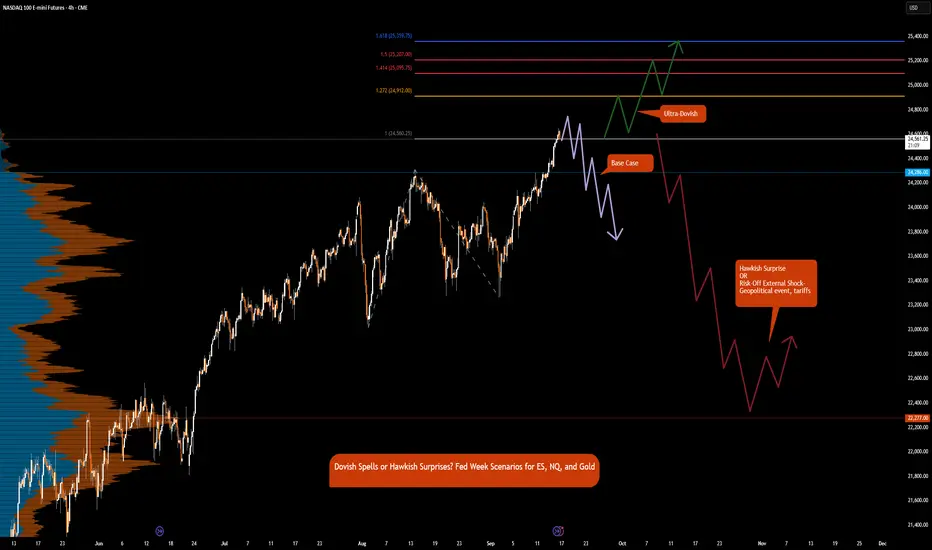
Dovish Spells or Hawkish Surprises? FOMC Prep for ES, NQ, GCLet’s start with the biggest event this week. Unless, of course, some unexpected headline swoops in and steals the spotlight — because markets love a good plot twist.
Emotions are running high, and volatility is flying around like confetti at a surprise party nobody asked for. But don’t worry, Chair Powell might just play the role of the calm voice in the chaos.
Markets are pricing in a 25 bps rate cut by the Fed this week. Interestingly, the future path of rate cut expectations has been in the doldrums. Is it a bird or a plane? No, it’s Superman. Likewise here, is it 1 cut or 2 cuts? No, it’s 3 cuts priced at this moment until the end of 2025.
Excuse the humor, but what fun is it if you cannot entertain yourself while analyzing the complexities of markets day in and day out. Execution is boring; risk management is much like dementors sucking out life force when risk is not respected. And analyzing and preparation is where the creativity and fun is.
And as Kurt Angle would say, it is “ True ”.
Index futures including ES futures and NQ futures have all climbed steadily higher since September 2 low. Markets are turning higher in anticipation of a new bull run.
Gold futures are rallying, currently trading above $3700. Since the Jackson Hole dovish pivot, gold has not looked back and has rocketed higher above major resistance.
Our focus is on the Fed meeting. All eyes will be on the forward guidance; risks to inflation, risks for the labor market and FED’s SEP (Summary of Economic Projections). This also includes GDP forecasts and the most anticipated Dot Plot.
Which of the two mandates will the Fed prioritize, labor market weakness or sticky inflation? The interesting thing to note is that despite sticky inflation, markets are anticipating 3 cuts of 25 bps for each of the meetings this year.
Thus far, as we have previously mentioned, the Fed will likely be moving away from their 2% inflation target to an average inflation target in the range of 2% to 3%.
This also implies that real rates i.e., nominal less inflation are going to fall sharply lower.
Given this, we anticipate gold to continue higher as the US Dollar's purchasing power erodes away, with mounting debt, higher inflation and falling real yields.
The real question we should be asking is:
What if the meeting outcome is hawkish with the Fed delivering just 1 cut in the September meeting and staying on hold for the remainder of the year?
What other risks are there that could pull stocks and indexes lower? And bonds higher?
Tariffs at this point seem like an old talk unless something reinvigorates and puts them on the front and center of market worries.
Based on these thoughts, here are our scenarios:
Base Case:
25 bps cuts and dovish guidance but iterates meeting by meeting approach.
ES & NQ:
Data dependent Fed, that is likely behind the curve and markets may translate this as Fed too slow to react to emerging risks, risks of recession goes higher. In this case, although stocks may push higher with rates coming down initially, in our view, much of this is priced in and this may be ‘sell the fact moment’.
Portfolio adjustment: Sell index futures, Buy Gold and Bonds.
Ultra-Dovish:
Fed’s dot plot confirms 2 additional rate cuts of 25 bps for Oct and Dec meeting and further 4 cuts till end of 2026 to bring terminal rate lower to 250-275.
USD weakens further, real rates sink, reinforcing gold bid.
Portfolio adjustment: Buy everything. Buy the dip.
Hawkish Surprise
Only 25 bps in September, then pause
ES & NQ:
• Sharp pullback as equities reprice for tighter liquidity.
• ES could retrace recent gains, downside risk toward 4,900–5,000 zone.
• NQ likely hit harder due to tech sensitivity to discount rate.
GC:
• Short-term correction as USD firms and yields spike.
• However, downside may be limited if market shifts focus back to debt & long-term inflation risks.
Risk-Off External Shock- Geopolitical event, tariffs
ES & NQ:
• Drop as risk sentiment sours; defensives outperform growth.
• Bonds rally, yields fall, curve steepens if Fed cut expectations accelerate.
GC:
• Strong safe-haven bid, spikes higher regardless of Fed stance.
Comment with your thoughts and let us know how you see the markets shaping up this week
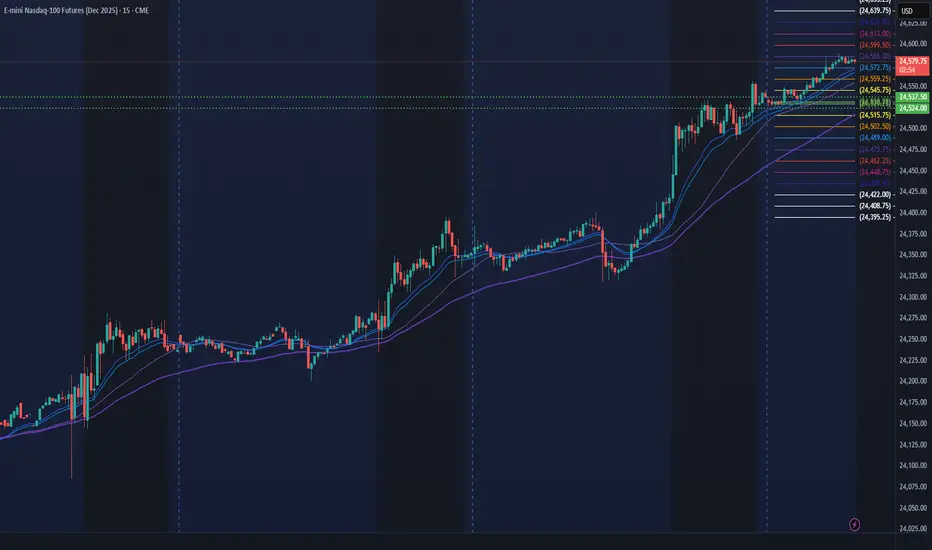
Buy the DipGreen Shaded Area is an accumulation / distribution area.
Orange line is a vpoc created Sunday, 9/14/2025

Bullish for the day?Nasdaq bouncing off the VWAP in 15 minutes and positive news just now for core retail sales. Bullish for the day?

My NQ Levels going into FOMC WeekHere are the levels I am looking at as we go into this week. From Tuesday retails news to the big day on Friday with the anticipate decrease in interest rate
Short NQ at ATH Nice play so far , currently running above 2R.
Saw a clean BOS and it reacted perfectly to that 5-minute FVG.
It’s a bit of a risky setup with price around all-time highs, but let’s see how it plays out.

NQ Power Range Report with FIB Ext - 9/16/2025 SessionCME_MINI:NQU2025
- PR High: 24537.50
- PR Low: 24524.00
- NZ Spread: 30.0
Key scheduled economic events:
08:30 | Retail Sales (Core|MoM)
Session Open Stats (As of 12:25 AM 9/16)
- Session Open ATR: 282.21
- Volume: 15K
- Open Int: 282K
- Trend Grade: Long
- From BA ATH: -0.0% (Rounded)
Key Levels (Rounded - Think of these as ranges)
- Long: 25217
- Mid: 22503
- Short: 21790
Keep in mind this is not speculation or a prediction. Only a report of the Power Range with Fib extensions for target hunting. Do your DD! You determine your risk tolerance. You are fully capable of making your own decisions.
BA: Back Adjusted
BuZ/BeZ: Bull Zone / Bear Zone
NZ: Neutral Zone
NASDAQ 100 HEAD AND SHOULDERS FORMATION CANCELED Hey traders FOMC week and we are back to looking at the Nasdaq. Picking tops and bottoms in these markets is always challenging to say the least.
Well what do we have here?
Market has now broken above the head of this pattern which means no more Head & Shoulders. A close above the right shoulder or the head cancels the formation.
So at this point I don't think anyone knows how the market will react after this weeks FED meeting.
So therefore I think it's a wait and see approach before creating a new trading plan at least imo.
So No Scenarios yet until after FOMC. Watch out for Volatility!😬
Good Luck & Always use Risk Management!
(Just in we are wrong in our analysis most experts recommend never to risk more than 2% of your account equity on any given trade.)
Hope This Helps Your Trading 😃
Clifford
RISK DISCLOSURE
TRADING IN THE FUTURES AND FOREX MARKET INVOLVES SIGNIFICANT RISK. ALWAYS CONSULT A FINANCIAL ADVISOR AS HIGH RISK ASSET CLASSES MAY NOT BE SUITABLE FOR ALL INVESTORS. THIS IS NOT A RECOMMENDATION TO BUY OR SELL ANY ASSETS. ALL IDEAS ARE MADE FOR EDUCATIONAL PURPOSES. PAST PERFORMANCE DOES NOT GUARANTEE FUTURE RESULTS.
CFTC RULE 4.41 – HYPOTHETICAL OR SIMULATED PERFORMANCE RESULTS HAVE CERTAIN LIMITATIONS. UNLIKE AN ACTUAL PERFORMANCE RECORD, SIMULATED RESULTS DO NOT REPRESENT ACTUAL TRADING.

Bullish Nasdaq-but thread lightly Sep 15-19
CME_MINI:NQU2025 Quick summary / bias
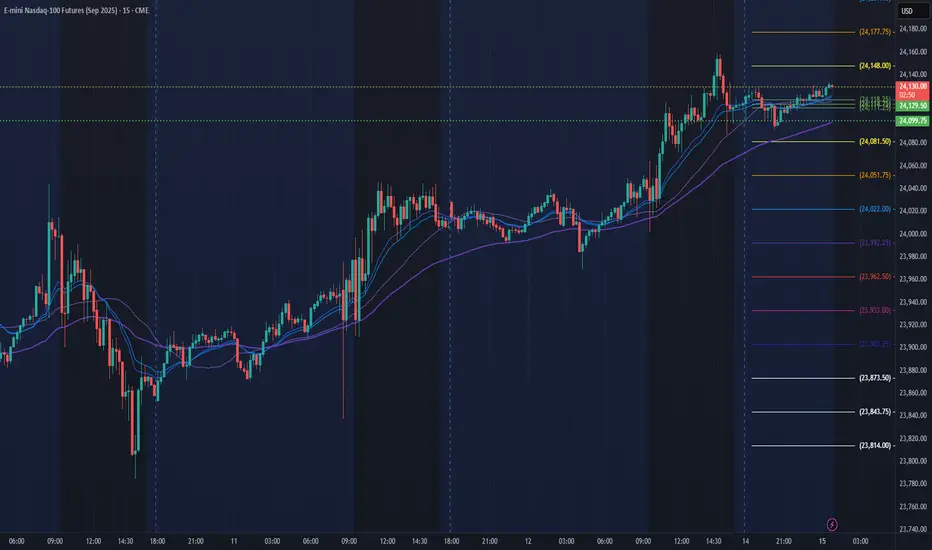
Price put in a clear bullish structure through Thursday → Friday (higher highs, higher lows) but just hit a liquidity sweep up to 24159 and pulled back into a visible Imbalance / order-block area that sits right above the 4H open / purple line at 24001.50.
So my primary bias is bullish as long as price holds the 24000–24040 area.
If price breaks and closes below the origin lows around 23969 → 23909 the bias flips bearish.
----------------------------------------------
What I see (structure + important levels)
Higher-timeframe context: an impulsive move up from the 23960–23970 region into the 24159 high — that’s a clear displacement and creation of a bullish imbalance (the shaded box on the chart).
Liquidity events: a pronounced wick above 24159 (buy-side liquidity run) followed by a quick sell—classic stop-hunt then retrace into the Price Imbalance.
Key horizontal levels to use:
Resistance / short-term target: 24159.00 (recent high / liquidity high).
Primary support / confluence (buy zone): 24001.50 (purple line / 4H open) and the grey FVG just above it (~24000–24080 area).
Invalidation / bearish trigger: a decisive break below 23969.00 (and especially below the referenced originating imbalance around 23909–23871 on the left).
Current quote on the chart: 24,115.25 (shows we’ve pulled off the 24159 high and are sitting into the gap/OB).
----------------------------------------------
Trade ideas (clear entries, stops, targets)
A — Primary (preferred) — Long (mean-reversion into Imbalance / structural buy)
Why: Market made an impulsive rally; sweep above 24159 sucked liquidity and then pulled back into the bullish imbalance + 4H open — a high-probability area for continuation if buyers defend it.
Entry (limit or 1-min confirmation): ~24020 (inside the Imbalance / just above 24001.50).
If you trade micro time frames: wait for a 5-min displacement down into the FVG and then a 1-min bullish rejection (tight lower wick + bullish engulf / strong rejection) to enter.
Stop: 23950 (just below the liquidity sweep low / below 23969).
Targets:
T1: 24159.00 (recent high).
T2: 24240 ( extension if T1 runs — measured continuation ).
Risk math (example):
Entry = 24,020; Stop = 23,950 → risk = 70 points.
T1 = 24,159 → reward = 139 points → RR ≈ 1.99 : 1.
T2 = 24,240 → reward = 220 → RR ≈ 3.14 : 1.
Management: scale out (25% at T1, move stop to breakeven, trail rest by structure).
---------------------------------------------------
B — Aggressive Long (breakout continuation)
Trigger: Clean break and close above 24159 and a retest that holds the level.
Entry: Long on retest above 24159.
Stop: below the retest low (e.g., 24120).
Target: next measured move / psychological round levels (e.g., 24280–24320).
----------------------------------------------------
Execution rules / signals (so you’d know exactly what to do)
Prefer entries at confluence: Imbalance + 4H open + prior liquidity level (24000–24040).
Micro confirmation: On the 5-min, look for the displacement into the FVG; on the 1-min look for a clean rejection (long wick and quick bullish candle) before hitting “buy”. This matches your stated process (displacement on 5m, reversal on 1m).
Position sizing: risk per trade = set so your stop distance × size = e.g., 0.5%–1% of account. Don’t risk full target size on one slice—scale in.
If price closes below 23969 on the 1H (or a strong 5-min close below), stand down on longs and look for short entries only after a retest.
----------------------------------------------------
Invalidation & what to watch
Invalidation of bullish view: clean close and follow-through below 23969 (especially if price closes and stays below 23909). That flips the edge to the bears.
Confirmation of continuation: price holds the Imbalance/4H open (24001.50) and reclaims/prints above 24159 with a clean retest (shows buyers absorbed liquidity).
----------------------------------------------------
Remember that confirmation not only validates the idea but it increases the success probability of the idea.

NQ: 252nd trading session - recapDefinitely a very exciting session, price action has been doing me well tbh.
But school starts again, meaning I won't trade every wednesday, I despise this fact
some chart detailscharting is key to discipline. anyone can chart, who can follow their own mind with persistence focus. i love charting and i love trading but they are two different things in one.

NQ FUTURES IDEA 9/15We are looking to re test the top of 24,159 NQ but first we might drop to 24,000 NQ. I think we trade around this 24,064 range and then start pushing back up to re test 24,159 NQ.

NQ Power Range Report with FIB Ext - 9/15/2025 SessionCME_MINI:NQU2025
- PR High: 24129.50
- PR Low: 24099.75
- NZ Spread: 66.75
No key scheduled economic events
Contract rollover week
- Advertising potential to continue ATH march
Session Open Stats (As of 12:45 AM 9/15)
- Session Open ATR: 270.13
- Volume: 13K
- Open Int: 273K
- Trend Grade: Long
- From BA ATH: -0.1% (Rounded)
Key Levels (Rounded - Think of these as ranges)
- Long: 25217
- Mid: 22503
- Short: 21790
Keep in mind this is not speculation or a prediction. Only a report of the Power Range with Fib extensions for target hunting. Do your DD! You determine your risk tolerance. You are fully capable of making your own decisions.
BA: Back Adjusted
BuZ/BeZ: Bull Zone / Bear Zone
NZ: Neutral Zone
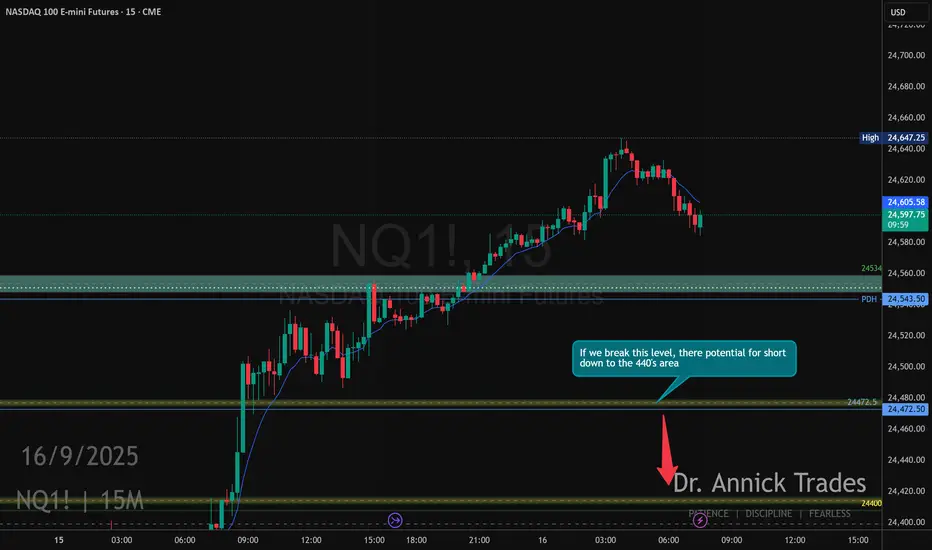
Both Side NQ for the week of 15-20/09/2025NQ will retrace a bit lower just to continue higher. If we reach the 24500 I can see having a bearish close the last two day of the week.
Always remember, Caution, Patience and Risk!
GL!
If you like the content give me a follow on X!
Check Bio. Cheers!

Weekly Market Update & Analysis - 14-September-2025Weekly Market Update & Analysis
Week Ending : September 14, 2025
Analysis Framework : Institutional Intelligence Dual Renko System
Executive Summary
The past week delivered exceptional validation of our institutional intelligence framework across equity indices while confirming the deteriorating conditions in commodity and currency markets. Our three primary equity opportunities (NQ, ES, YM) demonstrated the power of trading with institutional backing, while defensive positioning in overextended and institutionally-abandoned assets proved essential for capital preservation.
Portfolio performance reflects the strength of systematic institutional intelligence application , with equity allocations advancing while defensive positioning prevented significant losses in deteriorating sectors.
Primary Opportunities - Institutional Validation Continues
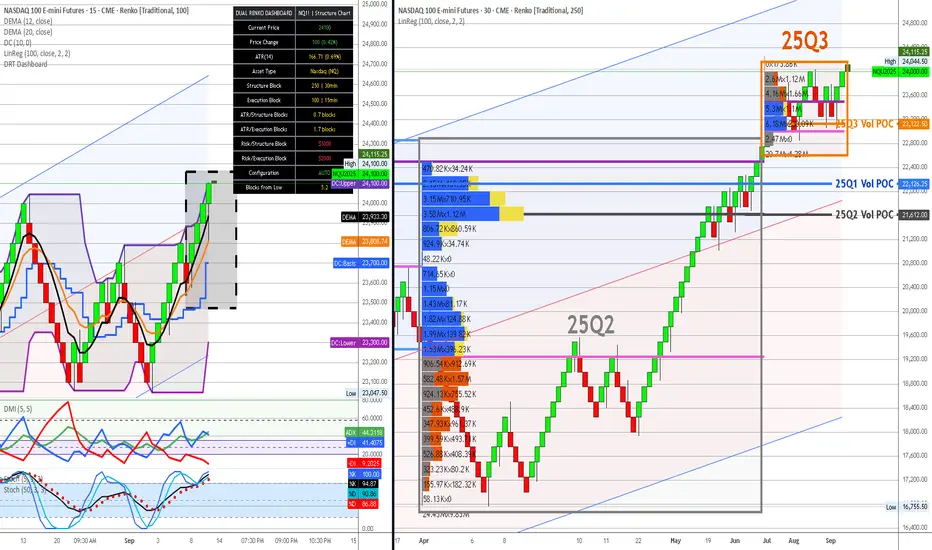
1. NASDAQ 100 (NQ) - EXCEPTIONAL PERFORMANCE VALIDATION
Previous Week Assessment : 25-30% allocation with 26.8:1 institutional backing at 23,963
Current Status : 24,100 (+0.57% weekly advance)
Institutional Intelligence Confirmed :
Structure Chart Validation : Trading above Q3 institutional accumulation with volume support
Dashboard Metrics : ATR 166.71 (0.69%) confirms low volatility, optimal block sizing maintained
Risk Management : $5,000 per 100-point execution block = excellent position sizing precision
Technical Status : All momentum indicators supporting institutional positioning
Weekly Performance Analysis :
Price Action : Steady advance above institutional zones validates smart money accumulation
Volume Confirmation : Sustained institutional engagement throughout advance
Risk Control : Minimal drawdown with institutional support holding
Momentum Quality : Clean upward progression without excessive volatility
Coming Week Outlook :
Bullish Scenario (75%) : Continuation toward 24,500-25,000 resistance levels
Consolidation (20%) : Range trading 23,800-24,300 for momentum reset
Correction (5%) : Pullback to 23,500 institutional support for accumulation
Strategy : Maintain full 25-30% allocation, trail stops using 100-point swing lows
2. S&P 500 (ES) - SOLID INSTITUTIONAL FOUNDATION
ES Combined View:
Previous Week Assessment : 20-25% allocation with 5.21:1 institutional backing at 6,575
Current Status : 6,600 (+0.38% weekly advance)
Institutional Intelligence Confirmed :
Structure Chart : Maintaining position above Q3 POC institutional accumulation
Dashboard Metrics : ATR 37.37 (0.56%) supporting current 25-point execution blocks
Volume Profile : Sustained engagement above institutional zones
Risk Framework : $1,250 per 25-point block enabling precise risk management
Weekly Performance Analysis :
Steady Advance : Consistent progress above institutional support levels
Volume Quality : Professional participation supporting price advance
Technical Health : Momentum indicators maintaining bullish alignment
Volatility Control : Low ATR environment supporting systematic approach
Coming Week Outlook :
Bullish Scenario (70%) : Advance toward 6,700-6,750 resistance zone
Consolidation (25%) : Range development 6,550-6,650 for base building
Correction (5%) : Test of 6,500 institutional support
Strategy : Maintain 20-25% core allocation with systematic profit-taking above 6,700
3. DOW JONES (YM) - OPTIMAL RISK/REWARD POSITIONING
YM Combined View:
Previous Week Assessment : 25-30% allocation with perfect YTD POC alignment at 46,050
Current Status : 46,050 (unchanged, consolidating at optimal institutional level)
Institutional Intelligence Excellence :
YTD POC Validation : Trading precisely at institutional consensus level (45,150 area)
Dashboard Metrics : ATR 238.47 (0.52%) confirming 150-point execution blocks optimal
Risk Profile : $750 per 150-point block = superior risk management
Support Quality : Cross-timeframe institutional validation providing exceptional downside protection
Weekly Performance Analysis :
Consolidation Strength : Holding institutional consensus demonstrates smart money confidence
Volume Distribution : Balanced institutional participation during consolidation
Risk Management : Minimal downside exposure with institutional support
Setup Quality : Optimal positioning for next institutional advance
Coming Week Outlook :
Bullish Scenario (80%) : Breakout toward 46,800-47,200 levels with institutional support
Consolidation (15%) : Continued range at institutional consensus for accumulation
Correction (5%) : Brief test toward 45,500 for final institutional positioning
Strategy : Maintain maximum 25-30% allocation, add on any weakness toward 45,700
Secondary Holdings - Defensive Management Required
4. WTI CRUDE OIL (CL) - TECHNICAL IMPROVEMENT NOTED
CL Combined View:
Previous Week Assessment : 8-12% defensive allocation due to technical conflicts at 62.94
Current Status : 62.25 (-1.10% weekly decline)
Mixed Signal Assessment :
Institutional Support : Structure chart shows continued Q2/Q3 accumulation backing
Technical Challenges : Dashboard ATR 0.33 (0.53%) appropriate, but momentum concerns persist
Price Action : Testing lower end of institutional accumulation zone
Risk Management : $250 per 0.25 execution block maintaining precision
Weekly Performance Analysis :
Institutional Respect : Decline contained within smart money accumulation zones
Volume Behavior : Some institutional support visible near Q2 POC levels
Technical Status : DEMA maintaining bullish bias despite price weakness
Defensive Positioning : Lower allocation preventing significant capital impact
Coming Week Outlook :
Bullish Scenario (50%) : Recovery above 63.50 with institutional volume confirmation
Neutral Scenario (35%) : Range trading 62.00-64.00 within institutional zone
Bearish Scenario (15%) : Break below 61.50 requiring defensive exit protocols
Strategy : Maintain 8-12% defensive allocation, monitor for technical confirmation signals
High-Risk Positions - Defensive Protocols Validated
5. NATURAL GAS (NG) - INSTITUTIONAL ABANDONMENT ACCELERATING
NG Combined View:
Previous Week Assessment : 3-5% minimal allocation due to institutional disengagement at 2.950
Current Status : 2.960 (+0.34% minor recovery)
Deteriorating Fundamentals :
Institutional Intelligence : 65% volume decline from Q1 peaks continues
Dashboard Warning : ATR 0.04 (1.41%) suggesting continued volatility risk
Technical Status : Bearish momentum persisting despite minor recovery
Liquidity Concerns : /MNG volume insufficient for meaningful position sizing
Weekly Performance Analysis :
Minimal Recovery : Slight advance insufficient to reverse institutional disengagement
Volume Quality : Limited institutional participation in recovery attempt
Risk Limitation : 3-5% allocation preventing significant portfolio impact
Framework Validation : Defensive positioning justified by continued weakness
Coming Week Outlook :
Neutral Scenario (45%) : Range trading 2.90-3.10 with limited institutional interest
Bearish Scenario (40%) : Resumption of decline toward 2.70-2.80 levels
Bullish Scenario (15%) : Recovery above 3.20 requiring fresh institutional engagement
Strategy : Maintain minimal 3-5% allocation, avoid increases until institutional return
6. EURO FUTURES (6E) - EXTENSION CORRECTION ACCELERATING
6E Combined View:
Previous Week Assessment : 2-3% minimal allocation due to 12.9% dangerous extension at 1.1792
Current Status : 1.1800 (+0.07% minimal advance)
Dangerous Extension Persists :
YTD POC Distance : Still 12.1% above institutional consensus at 1.0525
Dashboard Metrics : ATR 0.0 (0.23%) showing compressed volatility before correction
Technical Deterioration : Extension beyond all institutional positioning zones
Risk Assessment : $1,250 per 0.002 block = high risk per unit exposure
Weekly Performance Analysis :
Consolidation Warning : Minimal movement often precedes major corrections
Institutional Void : Trading well beyond any smart money positioning
Defensive Success : 2-3% allocation limiting portfolio exposure
Correction Preparation : Framework positioning for mean reversion opportunity
Coming Week Outlook :
Bearish Scenario (65%) : Correction toward 1.1200-1.0800 institutional zones
Neutral Scenario (25%) : Continued consolidation at dangerous extension levels
Bullish Scenario (10%) : Further extension creating extreme correction risk
Strategy : Maintain minimal 2-3% defensive allocation, prepare for correction opportunity
7. GOLD FUTURES (GC) - VOID TERRITORY CORRECTION UNDERWAY
GC Combined View:
Previous Week Assessment : 0% allocation due to catastrophic void territory at 2,682
Current Status : 2,687 (+0.19% minor advance)
Catastrophic Risk Confirmed :
Institutional Void : Still 12.2%+ beyond all smart money positioning
Dashboard Alert : ATR 15.93 (0.59%) insufficient for current extension risk
Technical Status : Trading in complete institutional abandonment zone
Correction Vulnerability : $500 per 5-point block = extreme risk if positioned
Weekly Performance Analysis :
Void Persistence : Continued trading beyond institutional intelligence zones
Correction Preparation : Framework positioning for eventual return to smart money levels
Capital Preservation : 0% allocation preventing catastrophic losses during correction
Professional Discipline : Maintaining avoidance despite minor advances
Coming Week Outlook :
Bearish Scenario (70%) : Major correction toward 2,380-2,450 institutional zones
Neutral Scenario (20%) : Continued consolidation at void territory levels
Bullish Scenario (10%) : Further extension creating ultimate correction setup
Strategy : Maintain 0% allocation, prepare for institutional zone re-entry opportunity
Portfolio Management & Risk Assessment
Current Allocation Status
Equity Indices : 70-80% (NQ 25-30%, ES 20-25%, YM 25-30%)
Defensive Commodities : 10-15% (CL 8-12%, NG 3-5%)
High-Risk Positions : 2-3% (6E minimal allocation)
Avoided Assets : 0% (GC complete avoidance)
Cash/Opportunity : 10-15% (correction and opportunity preparation)
Risk Management Performance
Institutional Validation : Equity positions performing as expected with smart money backing
Defensive Success : Limited commodity exposure preventing significant losses
Framework Discipline : Systematic adherence to institutional intelligence preventing major errors
Professional Standards : Dashboard integration enabling precise risk control
ATR Monitoring & Block Size Validation
All Markets : ATR levels within acceptable ranges for current block sizing
Volatility Environment : Low volatility across indices supporting systematic approach
Risk Per Block : All position sizing maintaining 2% account risk parameters
Configuration Status : No block size adjustments required across tracked markets
Coming Week Strategic Framework
Primary Focus Areas
Equity Strength Continuation : Monitor institutional level respect and momentum sustainability
Commodity Stabilization : Watch for technical improvements and institutional re-engagement
Extension Corrections : Prepare for mean reversion opportunities in overextended assets
Risk Management : Maintain systematic discipline with institutional intelligence framework
Market Scenarios for Coming Week
Scenario A: Equity Momentum Continuation (70% probability)
Characteristics : Institutional accumulation continues supporting index advances
Winners : NQ, ES, YM maintain leadership with systematic advances
Strategy : Maintain high equity allocation, systematic profit-taking at resistance
Risk Management : Trail stops using institutional support levels
Scenario B: Market Consolidation (25% probability)
Characteristics : Range development around current institutional zones
Opportunity : Accumulate additional positions near institutional support
Management : Patience for breakout confirmation from consolidation
Defensive Positioning : Maintain current commodity allocations
Scenario C: Correction & Opportunity (5% probability)
Trigger : Break below institutional support requiring defensive protocols
Response : Systematic position reduction with cash accumulation
Opportunity : Preparation for institutional zone re-entry
Framework : Maintain institutional intelligence discipline during volatility
Trading Insights
Institutional Intelligence Validation
Framework Success : Systematic application preventing major allocation errors
Smart Money Alignment : Trading with institutional positioning generating consistent results
Risk Prevention : Defensive protocols successful in avoiding overextended assets
Professional Standards : Dashboard integration providing institutional-grade oversight
Technical Analysis Integration
Dual Chart Methodology : Structure/execution integration providing complete market intelligence
Enhanced Indicators : DMI, DEMA, stochastics optimization delivering precise signals
Block Size Efficiency : Renko configuration filtering noise while preserving institutional intelligence
Visual Framework : Professional chart standards enabling rapid decision-making
Risk Management Excellence
Systematic Position Sizing : 2% account risk framework maintaining capital preservation
Institutional Distance Monitoring : Extension risk assessment preventing dangerous allocations
Correlation Management : Cross-asset allocation preventing concentration risk
Professional Discipline : Adherence to framework over emotional decision-making
Key Success Factors for Coming Week
Maintain Framework Discipline
Institutional Intelligence Priority : Continue systematic application of smart money positioning
Technical Confirmation : Require execution chart validation for all allocation changes
Risk Management : Maintain systematic position sizing and stop placement protocols
Professional Standards : Use dashboard metrics for all risk assessment decisions
Monitor Key Developments
Equity Momentum : Watch for institutional level breaks requiring strategy adjustment
Commodity Recovery : Monitor for technical improvements enabling allocation increases
Extension Corrections : Prepare for mean reversion opportunities in overextended assets
Volume Profile Evolution : Track institutional engagement changes across all markets
Implementation Priorities
Daily Monitoring : Use combined charts for efficient institutional intelligence assessment
Weekly Reviews : Systematic evaluation of framework performance and market evolution
Monthly Calibration : Deep structure chart analysis and technical indicator validation
Quarterly Overhaul : Complete institutional intelligence framework reassessment
Market Outlook Summary : The institutional intelligence framework continues delivering exceptional results through systematic application of smart money positioning analysis. Equity markets demonstrate the power of trading with institutional backing, while defensive positioning in overextended and abandoned assets validates professional risk management protocols.
Strategic Positioning : Maintain high equity allocation (70-80%) with systematic profit-taking protocols, defensive commodity management, and complete avoidance of void territory assets. The framework's ability to identify optimal risk-adjusted opportunities while preventing catastrophic losses represents institutional-grade market intelligence application.
Professional Discipline : Continue systematic adherence to institutional intelligence over short-term market noise, maintain enhanced visual framework standards, and apply professional risk management protocols across all timeframes and market conditions.
Next Review : Weekly combined chart analysis scheduled for September 21, 2025, with continued focus on institutional intelligence validation and systematic framework application.
Risk Disclaimer : All trading involves substantial risk of loss. Past performance does not guarantee future results. The institutional intelligence framework provides analytical tools for risk assessment but cannot eliminate market risk. Position sizing and risk management protocols must be adjusted based on individual account size, risk tolerance, and market conditions.
Professional Standards : This analysis represents systematic application of institutional intelligence methodology developed through extensive market research and validation. Continued framework discipline and professional risk management remain essential for sustainable trading success.
Results of Day One of our Radical Departure from YouTube WisdomFollowing our Breakout Plan from Chart 1 we banked $4,546.68.
Account Value: $54,546.68
At day's end we are 2L NQ and 8L MNQ.
Intraday Margin Required:
1.NQ: 2 x $1000.00 = $2000.00
2.MNQ: 8 x $100.00 = $800.00
Initial Margin Required: $68,376.00
Problem: At day's end we cannot cover Initial Margin.
Solution: At 4:30 PM New York time sell 6 MNQs. When the market opens 9/7/25 at 6:00 PM New York time buy them back at a lower Px if possible.
Math:
You are 2.8L NQ
68,376/2.8 = 24,420 for each NQ contract
24,420/10 = 2,442 for each MNQ contract
68,376 - 54,546.68 = 13,829.32
13,829.32/2,442 = 5.6631122
Radical Departure from YouTube WisdomShall we buck conventional YouTube Wisdom which says one must use a stop loss and one must have at least a 1.1R target?
Let's start with an hypothetical $50,000.00 account and document its success or failure with the following Trade Plan:
1.Buy the Breakout
2.Buy the Dip
3.Buy the Pivot
We will use this chart as our starting point. As we progress, we will flesh out our Trading Plan. We will lay down Foundational Principles which will be the bedrock upon which we build. Skyscrapers exist on lower Manhattan because of the bedrock beneath. Francis Schaeffer called this True Truth - things that are true for all people at all times.
Buy the Breakout Plan
1.Buy 1 contract of NQ at every multiple of 10 with a target of 19 points.
2.Buy 4 contracts of MNQ at every multiple of 5 with a target of 19 points.
Away we go!

NQ Long IdeaI am not a Indices guy this is my Idea for NQ/ES We have retraced to discounted levels and OTE levels with Premium Array

Role of G7 and G20 in World Markets1. Historical Background
1.1 Origins of the G7
The G7 originated in the 1970s oil crisis and currency instability. The breakdown of the Bretton Woods system (1971) and the 1973 oil shock forced leaders of the US, UK, France, West Germany, Italy, and Japan to coordinate policies.
The first meeting took place in 1975 at Rambouillet, France. Canada joined in 1976, making it the G7.
The forum was designed as an informal space for dialogue among advanced economies, free from the rigid bureaucracy of the IMF or UN.
1.2 Expansion into G20
By the late 1990s, globalization had empowered emerging markets like China, India, Brazil, and South Africa.
The Asian Financial Crisis of 1997–98 exposed the limitations of the G7, which could not represent the interests of developing nations.
The G20 was created in 1999, initially as a forum for finance ministers and central bank governors.
Following the 2008 Global Financial Crisis, the G20 was elevated to a leaders’ summit level, becoming the “premier forum for international economic cooperation.”
2. Membership & Structure
2.1 G7
Members: United States, Canada, United Kingdom, France, Germany, Italy, Japan, and the EU (as an observer).
Characteristics: Advanced, high-income democracies with strong global financial markets.
Focus: Monetary policy coordination, financial stability, trade, development aid, sanctions, and geopolitical security.
2.2 G20
Members: 19 countries + European Union. Includes major emerging economies like China, India, Brazil, Russia, South Africa, Mexico, Indonesia, Turkey, Argentina, Saudi Arabia, and others.
Coverage: Represents 85% of global GDP, 75% of international trade, and two-thirds of the world’s population.
Focus: Broader economic and financial stability, trade, infrastructure investment, climate change, digital economy, inclusive development.
3. Role in Financial Markets
3.1 Market Stability
The G7 historically acted as a currency stabilizer. For example, the Plaza Accord (1985) coordinated interventions to weaken the US dollar, reshaping forex markets.
The Louvre Accord (1987) similarly stabilized exchange rates. These decisions had immediate effects on bond yields, commodity prices, and stock market sentiment.
The G20, after 2008, coordinated stimulus packages worth trillions of dollars. This joint effort restored investor confidence, stabilized equity markets, and prevented a deeper depression.
3.2 Regulatory Standards
Both groups influence the Basel Committee on Banking Supervision, which sets global banking capital requirements.
The G20’s Financial Stability Board (FSB) was established in 2009 to monitor risks, enforce transparency, and reduce systemic threats. This has reshaped financial markets, particularly derivatives and shadow banking oversight.
3.3 Debt Management & Sovereign Risk
G7 finance ministers often negotiate debt relief for low-income countries, working alongside the IMF and World Bank.
The G20 launched the Debt Service Suspension Initiative (DSSI) in 2020, allowing the poorest nations to defer debt payments during the pandemic—affecting global bond market pricing of sovereign risk.
4. Role in Global Trade
4.1 G7’s Trade Leadership
G7 economies historically dominated WTO negotiations and set the tone for trade liberalization.
The G7 often pushes for open markets, free trade agreements, and intellectual property rights protection.
However, it has also been accused of protectionism—for instance, through agricultural subsidies or technology restrictions.
4.2 G20 and Trade Balancing
The G20 plays a bigger role in mediating between advanced and emerging economies.
After 2008, the G20 pledged to avoid protectionism and keep markets open. This was crucial in preventing a collapse of world trade.
More recently, the G20 has dealt with US-China trade tensions, global supply chain resilience, and reforms of the WTO dispute system.
5. Role in Investment & Infrastructure
5.1 Investment Flows
G7 countries, as capital exporters, dominate foreign direct investment (FDI) and global finance. Their regulatory policies shape global flows.
The G20 promotes inclusive investment frameworks, encouraging capital flows into Africa, Asia, and Latin America.
5.2 Infrastructure Financing
The G20 launched the Global Infrastructure Hub (2014) to connect investors with large-scale infrastructure projects.
The Partnership for Global Infrastructure and Investment (PGII), promoted by G7 in 2022, was designed as a counter to China’s Belt and Road Initiative (BRI).
6. Role in Crisis Management
6.1 2008 Financial Crisis
G7 alone lacked credibility, as emerging markets were now critical players.
The G20’s emergency summits (2008–2009) led to coordinated fiscal stimulus, global liquidity injections, and bank recapitalizations. This stabilized world stock markets.
6.2 Eurozone Debt Crisis (2010–2012)
G7 central banks coordinated to provide liquidity and backstop the euro.
G20 forums pressured European leaders to balance austerity with growth measures.
6.3 COVID-19 Pandemic (2020–2021)
G20 pledged $5 trillion in economic stimulus, central banks slashed interest rates, and liquidity lines were extended across borders.
G7 coordinated on vaccine financing (COVAX) and kept supply chains for medical goods functioning.
7. Role in Currency & Monetary Policy
G7 historically managed exchange rate diplomacy (e.g., Plaza Accord).
The G20 now addresses global imbalances, such as China’s currency valuation, US trade deficits, and emerging market vulnerabilities.
Both groups’ central banks’ policies (Fed, ECB, BOJ, PBOC, etc.) directly influence capital markets worldwide.
8. Role in Technology & Digital Economy
G7 promotes data governance, cybersecurity standards, AI regulations, and digital taxation frameworks.
G20 addresses digital inclusion, fintech growth, cross-border payment systems, and crypto regulation.
These policies affect stock valuations in the tech sector, investor confidence, and cross-border capital mobility.
9. Future Outlook
The G7 will likely remain a strategic and political coordination forum for Western democracies, focusing on sanctions, technology standards, and security-linked economics.
The G20 will remain the central platform for global economic governance, especially in addressing:
Climate financing
Sustainable debt frameworks
Digital currencies (CBDCs)
AI-driven market disruptions
Geopolitical risks in trade and energy
Their role will be critical as the world transitions into a multipolar economic order where no single power dominates.
10. Conclusion
The G7 and G20 act as twin pillars of global economic governance. While the G7 provides leadership from advanced democracies, the G20 reflects the diversity of the modern global economy. Their combined influence extends across financial markets, trade, investment, crisis management, energy security, and digital governance.
Though criticized for exclusivity, lack of enforcement, or internal divisions, both remain indispensable. In times of global crisis—whether financial collapse, pandemics, or geopolitical shocks—they have demonstrated the capacity to restore market confidence and stabilize the world economy.
Ultimately, the G7 and G20 do not replace institutions like the IMF, World Bank, or WTO, but they provide the political will and high-level coordination necessary to steer the world through uncertainty. In a world of interconnected markets, their role will only deepen in shaping the future of global capitalism.
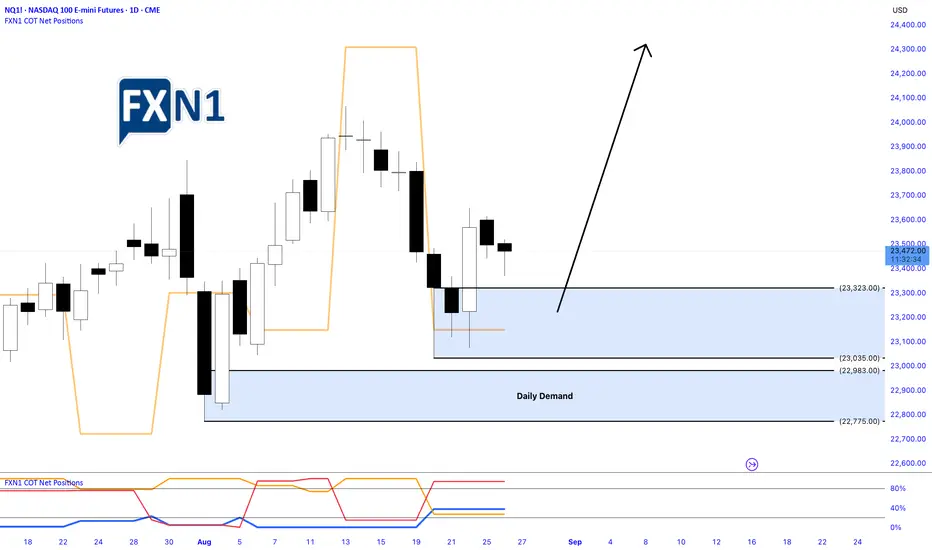
Nasdaq Pulls Back After Friday’s Rally: Identifying Demand ZoneYesterday, the Nasdaq underwent a pullback following a robust bullish surge on Friday. During this correction, a fresh Daily Demand Zone emerged on the chart, signaling potential support levels. Traders are now eyeing this area as an opportunity to position for a possible new high, should the market retrace further today. The current outlook favors a long setup, with anticipation of a continued upward move contingent on the price respecting the identified demand zone.
✅ Please share your thoughts about NQ1! in the comments section below and HIT LIKE if you appreciate my analysis. Don't forget to FOLLOW ME; you will help us a lot with this small contribution.
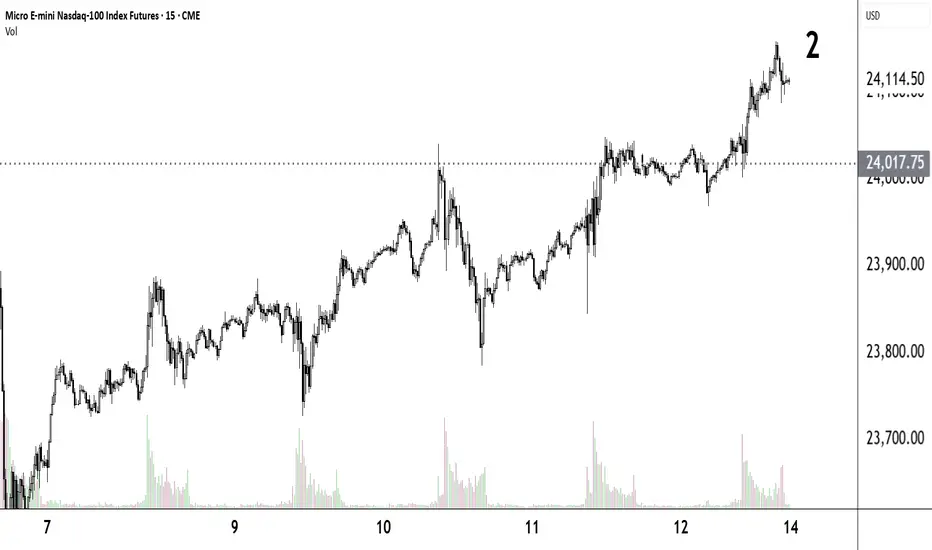
Buy the DipHere is the most recent Buy the Dip area. It is a beautiful accumulation/distribution area. The 24,017.75 blue line through the middle is the prior day's close, frequently a good pivot point. It is also POC for 9/9 to the present.
Protect the King.

Dow Futures Trade /LongI plan to get better with my videos and explainations. I am a futures stock and forex trader. I have mastered charting assets of any class using price action. This is a current long idea and active trade. We are breaking all time highs on the nasdaq and I want to be apart of that journey.

Wyckoff VSA - Why Buying Happens On Down Moves/Selling Up MovesThe Markets move on supply and demand, no supply and no demand and cause and effect, effort vs result.
This short video shows why and how.
