Trade Management – First Partial at 50% of the TrendIn this video, we’re already inside the 10 AM trade from the previous setup. At this point, we’re up 290 ticks, and we’re managing the position carefully. To mitigate risk, we decided to take our first partial near the 50% retracement of the trend, just in case the price reversed and went against us.
This step allowed us to lock in some profit while still leaving room for the trade to continue in our favor.
Trade Overview:
Profit: +290 ticks
Partial: First partial taken at 50% retracement of the trend
Risk Management: Protecting against potential reversal while staying in the trade.
Trade ideas

10 AM Trade – Entry After Buy-Side Liquidity ManipulationAfter the 10 AM candle formed, price quickly expanded higher, as we had anticipated, taking out the buy-side liquidity before tapping into a new week opening gap low. Once this manipulation played out, I observed the price action on smaller timeframes, particularly the 1-minute chart, where we saw a bullish break for value gaps. I used this as an inverse setup to enter on the third or fourth candle.
The trade eventually played out, moving lower as expected, setting the stage for further price action that I’ll explain in more detail in the upcoming videos.
Trade Overview:
Entry: After the 10 AM candle, based on a break of a bullish FVGs on the 1-minute
Bias: Anticipating buy-side liquidity manipulation and a move toward lower prices
Execution: Entered on the third or fourth candle, holding for a continuation lower.

Pre-9:45 PMI Trade – Executing the Sell and Managing In this trade, we executed a sell before the Flash PMI at 9:45 AM, following our setup and market analysis. We were in the trade and managed it until we were stopped out, at which point we stayed out of the market until after the PMI release.
Once the 10 AM candle opened, we observed price action closely, waiting for manipulation. Our focus was on potential higher wick manipulation before the actual distribution of the 10 AM candle. This setup provided us with the opportunity to get into the market once the manipulation played out.
Trade Overview:
Entry: Pre-9:45 PMI sell
Exit: Stopped out, then waited for the 10 AM candle manipulation
Bias: Watching for higher wick manipulation and potential distribution after PMI release.

MNQ Trade Setup -- Waiting for Flash PMI ImpactI’m holding off on a re-entry as we approach the Flash PMI at 9:45 AM. My bias is that there’s a potential for price manipulation to push higher above buy-side liquidity, taking out the highs before continuing lower. I’m waiting for the PMI release to confirm this idea and get better clarity on the market direction.
Bias: Expecting a possible manipulation higher to take out buy-side liquidity, followed by a continuation lower.
Waiting for Flash PMI to unfold before making any further decisions.

22/5/25 NQ INTRADAY PLANWould be nice to see another day where AM session boosts up and them PM session completely reverses. Looking at OTE of the range paired with M15 Breaker and SD levels.

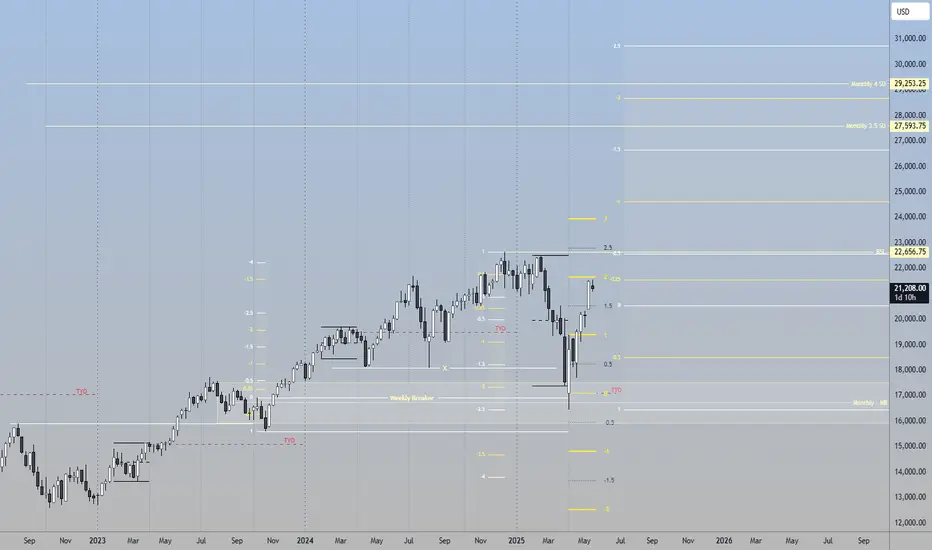
NASDAQ LONG TERM VIEWWeekly time frame, After faking everyone out with 'recession' and trade wars. Equities have made a strong recovery almost recovering all the losses from the start of the year. There may be a small retracement back to $20,500 level where i will accumulate longs before the massive expansion. Strap in!
NQ Power Range Report with FIB Ext - 5/22/2025 SessionCME_MINI:NQM2025
- PR High: 21177.00
- PR Low: 21113.75
- NZ Spread: 141.25
Key scheduled economic events:
08:30 | Initial Jobless Claims
09:45| S&P Global Manufacturing PMI
- S&P Global Services PMI
10:00 | Existing Home Sales
Value decline follow-through following morning bull run
- Auction holding at Monday's lows
Session Open Stats (As of 12:45 AM 5/22)
- Session Open ATR: 460.09
- Volume: 31K
- Open Int: 276K
- Trend Grade: Neutral
- From BA ATH: -6.6% (Rounded)
Key Levels (Rounded - Think of these as ranges)
- Long: 22096
- Mid: 20383
- Short: 19246
Keep in mind this is not speculation or a prediction. Only a report of the Power Range with Fib extensions for target hunting. Do your DD! You determine your risk tolerance. You are fully capable of making your own decisions.
BA: Back Adjusted
BuZ/BeZ: Bull Zone / Bear Zone
NZ: Neutral Zone

Supply and Demand Zones 5/21/25 $NQLink to chart: www.tradingview.com
Bearish: If we break Asia Highs and tap into the 15MIN Supply above (even push up to 21300), then a rejection to break lower into 30MIN demand to take PDL of NY session 5/21 and final target of 5/13 NY low at 20972.75.
Bullish: If we break and hold above the 15MIN supply above (and break and retest holding over 21300 12AM London Open from 5/21), then target longs to reclaim target area of ~21415. This target is based on how past price action from 5/15 and 5/19 responded when we reached into the current level we are in, and bounced back TO roughly 21415 before hitting stronger resistance/rejection.
Keeping note that on the 4HR frame we failed to break the 4HR supply above and we just created a new lower low/high now.


MNQ BUYprice broke above vwap and now retraced breaking the other candles high, looking for continuation upwards target first unfilled gap

Nas100 Longwe entered in a demand zone, sweeping a 4 hour low, the 15 min then shifted structure and retraced back to golden pocket, enter on 61.8 fib level, targets are shown. i recommend breakeven at target 1

2025.05.22 nasdaq analysis🔸 Daily Chart Perspective
On the daily timeframe, we can see that the recent low was made within the demand zone, but the market began to fall just before the U.S. session closed. The Asian session appears to be in wait-and-see mode for now.
If the trend continues downward, the red box to the left suggests the possibility of a one-way bearish move. In such a case, a drop toward the 20583 area is open.
The daily 20EMA is also near that zone, and since a one-way drop occurred in the red box area before, the possibility is quite realistic.
🔸 1-Hour Chart View
On the 1H chart, the Nasdaq seems to be forming an expanding wedge.
It's hard to say that a trend reversal to the downside is confirmed yet, because price is still inside the expanding pattern.
However, since the market seems to have formed a short-term top, it gives us a sense of direction for short-term trading.
If the price enters the black box area to the left, that could be seen as a complete trend reversal.
🔸 Today’s Trading Plan
At this point, due to yesterday's sharp drop, there’s no clear buy zone visible.
Only short positions are planned for today.
Short Setup #1
Entry: On break below 21112
TP 1: 21075
Short Setup #2
Entry: On break below 21070
TP 1: 20996
Short Setup #3
Entry: On break below 20970 + trendline break
TP Max: 20830 ~ 20770
🔹 Conclusion
It looks like the trend is leaning toward the downside, but it's best to enter positions only after price breaks out of key support zones.

NQ: 195th trading session - recapNo trades today. Just recalibrating myself and really locking back in.

Indexes Daily "Slow" Trend anticipationExpecting a Daily slowliness a.k.a. HRLR (ICT Concepts) due to the Bonds decorrelation which is bearish. Once Bonds has reached Sell Side Liquidity Target, acceleration will be seen on Indexes higher. Meanwhile "give and take" is expected on a Daily and 4h basis.

Nasdaq’s Next Move Revealed This Week – Don’t Miss the Breakout Following a strong surge at the start of the trading week, the Nasdaq reached a new high since March 26th. At this juncture, I anticipate a potential pullback before any sustained upward movement. My analysis suggests monitoring for a retracement to the New Week Opening Gap (NWOG), where price action will likely provide critical insights. I see two probable scenarios:
1. A move to the NWOG, followed by a strong bounce, potentially targeting a new all-time high, as some market commentators have suggested.
2. A weak reaction at the NWOG, leading to a breakdown below this level, with 16,000 as the next key support target.
This week's price action will be pivotal in determining the Nasdaq's near-term direction. I recommend close observation of these levels and disciplined risk management when positioning for either outcome.

Back up we go!H6 BISI paired with M30 RANGE and standard deviation projections. A new breaker formed after chopping downward past 24 hours or so. Expect another push up for buyside.
