NQ Range (12-18-25)The O/N has retraced 200 of the 400 points needed to get the NDX out of the Danger Zone range. NQ is at KL 25,103 & Diablo. U Turn attempt in the Overnight is underway. After the Washington Street & Meme Coin public address, they may need to try all Long side tricks to stabilize these markets. My 12/16 Short call was a half day early and needed to let the O/N pump/dump play out before the NAZ dropped 600 points. Watch Diablo today and 25,060 level for Long above and Short below. Utilizing KL's for trade entry may help. Many times the opposite direction trades at a KL will provide scalps and provide signals for direction turns (back to opposite direction KL). I would not be surprised to see the VIX pick up and some wild Long side O/N plays should the Reg Session continue to sell off the O/N long side Rig Pumps. Since 12/10 we have seen 3 Long Traps paly into the BTD/FOMO crowd, I would think that these traps are looking for a much lower drop test.
NDX YTD Chart
IDS27 View
Market insights

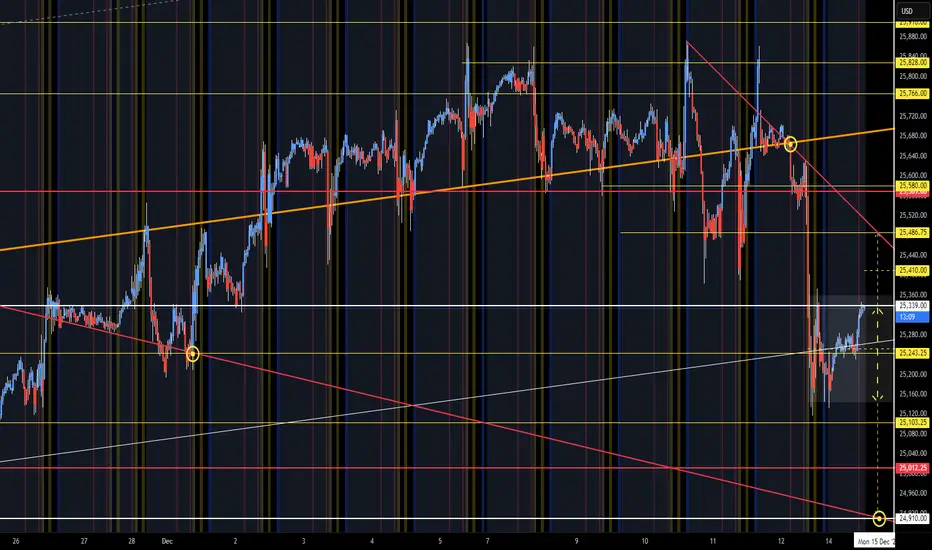
NQ Range (12-15-25)After the drop back into the Churn Zone, we have a NAZ Triangle of Range. Upper circle is the break under 10/22 TL, Mid circle is near mid CZ and Diablo pop on 12/1 and lower circle is CZ bottom and U Turn Target. Open Range (Reg Session) is shaded zone (yellow arrow), white arrow is break out to retest Diablo and lower yellow will be to KL 24,910. Watch the counter moves (Spikes) prior to actual larger moves, Overnight Pump/Dump at Open Drive and of course the Tweets during the Dead Zone. IDS27 Friday Open to current Chart:
NQ Range (12-17-25)Not what it seems, have to follow the crumbs of Tricks. On 12/26 NQZ hit KL 24,910 and is now at 25,245 (White Arrow). This is the actual PRICE of NQ, which is under Channel and 200 plus points lower. NDX will gap open higher (and above danger zone), that was the goal today. Knowing the Tricks may help with your next trade, which should be Short (at some point).
NDX Chart
IDS27 Chart

NQ Range (12-19-25)NAZ Overnight X Games may just pull it off. We are going into probably the final Friday-Monday Long Play of the year. This with the added volatility of contract changes and expirations. The current and previous Overnight session have been keeping the NAZ above the Danger Zone. Looking for the F-M play to try to push higher and if not, look for a drop back into lower CZ below (25,339 -24,910). Yellow arrow is Open Drive Range. The 12/17, 600 point drop was follow up with the typical 85% retracement the following day and primarily from the Extreme Rig of the O/N. Usually a 2% plus drop in the NAZ will take days to retrace the 85%, this one was juiced immediately for some reason. Will be leaving early today, will update what I can.

NASDAQ: Dip Buy Time! Wait For Valid Buy Setups!Welcome back to the Weekly Forex Forecast for the week of Dec. 15 - 19th.
In this video, we will analyze the following FX market: NASDAQ (NQ1!) NAS100
The NASDAQ is is still bullish, despite the leeriness toward AI and tech stocks. Profits were taken Friday, causing a bearish close on the day. But there are supporting structures for higher prices nearby, and I will personally be watching for price to contact those areas and look for valid market shifts to signal buys are in order!
Enjoy!
May profits be upon you.
Leave any questions or comments in the comment section.
I appreciate any feedback from my viewers!
Like and/or subscribe if you want more accurate analysis.
Thank you so much!
Disclaimer:
I do not provide personal investment advice and I am not a qualified licensed investment advisor.
All information found here, including any ideas, opinions, views, predictions, forecasts, commentaries, suggestions, expressed or implied herein, are for informational, entertainment or educational purposes only and should not be construed as personal investment advice. While the information provided is believed to be accurate, it may include errors or inaccuracies.
I will not and cannot be held liable for any actions you take as a result of anything you read here.
Conduct your own due diligence, or consult a licensed financial advisor or broker before making any and all investment decisions. Any investments, trades, speculations, or decisions made on the basis of any information found on this channel, expressed or implied herein, are committed at your own risk, financial or otherwise.

25076 is a super level. Watch for further drops if it breaksSee all the arrows where this level got respected. Some sessions it was the perfect bounce on CME_MINI:NQ1! CME_MINI:MNQ1! and other sessions, it was the level that caused an instant flush down or rocket up. I suspect price to hover around this level and either accumulate before a complete reversal or trap some bulls before a drop down to mid 24000s. I'd set the next max bounce level around 24649 if we give up this level.
Set your TradingView alerts and see what happens around this level. You can put alerts on your horizontal line if you really want to. See image below.
One last thing: if you see the 4 hour chart a little more zoomed in you'll notice an inverse cup and handle:
This should give another 200 point flush at the very minimum. If you are really eager to catch a bounce, watch this demand zone at 24816.

NQ Possible Longs IncomingUsing Volume Profile from intraday volume for 12/16/2025. Price keeps reacting to the area in rectangle for some time. It tried breaking below and pushed back up into the resistance area. Looking for price to break through the resistance and turn support out of the POC.

Market today: 12/21/2025New year new opportunities, let us take a look at what is happening before it happens...

NASDAQ Trade Journaling . 16 DECEMBER - TUESDAYNASDAQ Trade Journaling
16 DECEMBER - TUESDAY
HTF: BULLISH
Price takes Support from 4H-BISI
Once Support taken, it creates a Bullish Break of Structure and creates a Bullish Fair Value Gap
1:1.8 R/R Bullish Trade Entry

NQ Update 24,816 - Funded Future's TraderMy target for EOD tomorrow. Obviously through future's you have the ability to follow these through options a bit better.
100% On all future callouts and option callouts. I stream live on YT everyday.
Ask about the indicator it's free.

NQ Resistance at 25,800: Volume Cluster from Friday’s Sell-OffFriday’s strong sell-off on NQ created a high-volume cluster near 25,800.
This shows sellers built short positions in that area before pushing price lower.
If price pulls back to 25,800, sellers are likely to defend it again.

$11,300 in 14 minutes!Trading isn’t hard.
Interpreting everything at once is.
This NQ trade wasn’t about predicting anything.
It was about confluence being clear enough to act without hesitation.
Trend, momentum, structure, and higher-timeframe context were aligned.
No mixed signals. No mental gymnastics. No second-guessing.
When multiple inputs agree, the trade becomes obvious.
Execution gets simple.
Management gets boring.
And exits stop feeling like guesses.
This is what happens when you’re not juggling indicators in your head, but reading one coherent market state instead.
Same market.
Same volatility.
Just organized context.
Clarity, bar by bar.

NASDAQ: Bring On The Santa Rally! Short Term Buys!Welcome back to the Weekly Forex Forecast for the week of Dec. 22-26th.
In this video, we will analyze the following FX market: NASDAQ (NQ1!) NAS100
The NASDAQ is reaching towards the relative equal highs, and maybe with the help of a
Santa Rally, it gets their!
I like the fact that the market closed the last two days of last week with bullish candles. I expect to see some follow through into early next week.
Enjoy!
May profits be upon you.
Leave any questions or comments in the comment section.
I appreciate any feedback from my viewers!
Like and/or subscribe if you want more accurate analysis.
Thank you so much!
Disclaimer:
I do not provide personal investment advice and I am not a qualified licensed investment advisor.
All information found here, including any ideas, opinions, views, predictions, forecasts, commentaries, suggestions, expressed or implied herein, are for informational, entertainment or educational purposes only and should not be construed as personal investment advice. While the information provided is believed to be accurate, it may include errors or inaccuracies.
I will not and cannot be held liable for any actions you take as a result of anything you read here.
Conduct your own due diligence, or consult a licensed financial advisor or broker before making any and all investment decisions. Any investments, trades, speculations, or decisions made on the basis of any information found on this channel, expressed or implied herein, are committed at your own risk, financial or otherwise.

NQ for Christmas WeekNot entirely sure what will happen this week but volume will be odd over the holidays.
Would not expect this 200 point move, however after the most recent bounce off that weekly level it would make sense for this trend to continue.
Yellow levels are weekly. Orange level is most relevant 4hr level
BreakPoint LITE plotted the buy signal
TrenVantage LITE plotted the trends
Levels derived from TrenVantage TRADER pro indicator.

NQ UpdateI didn't post a plot premarket because I figured it'd be misleading. MFI is way oversold but RSI isn't there yet. Should hit oversold tomorrow.

MNQ – Spazdaq bleeds greenMarket: Micro E-mini Nasdaq-100 Futures (MNQ)
Bias: Bearish
Timeframes: Intraday (15m/30m) with Daily context
Thesis
Price Made a Double Top when it reached within 25% of the November Highs.
After a Bounce around 23,908 Price attempted to re-enter the higher-timeframe uptrend but failed at key dynamic resistance, followed by impulsive downside confirmation. The rejection confirms lower-high continuation risk.
What I’m Seeing
Failed re-entry into the long-term trend channel on the daily
Double-top structure confirmed with rejection from upper fib zone
Intraday breakdown after a weak bounce (no sustained VWAP reclaim)
Bearish price action: shallow pullbacks, compressed structure, seller control.
Measured fib extensions lining up with logical downside targets
Key Levels
Bearish Invalidation if we Reclaim:
0D SMA with a daily close.
21D EMA with a daily close.
50D EMA with a daily close.
The Trade:
Short.
Downside Targets:
Target 1: ~24,888
Target 2: ~24,643
Extended: ~24,300 - 24,360 (Gap Fill)
Double Top Confirmed Targets:
Re - Enter Short upon action below 23,908.75
Execution:
Entry
Scaled. Hoping for bullish pullback into the NFP reports tomorrow morning.
SL:
~25,320.
Final Notes
This is a context-driven idea, not a signal. I’m watching price behavior around resistance, not predicting direction. Let price confirm.
If this breaks down cleanly, downside opens fast.
#MNQ #NASDAQ #Futures #PriceAction #DoubleTop #TrendFailure #IntradayTrading

NQ bouncing off .5 Fib from November low to Dec highExpecting a bounce here if NFP come in line or soft. 4hr RSI oversold. Some of the big tech names have some room to go up. Seasonality points toward a rally.
If NFPs/CPI this week come in hot I expect further downside. If they print in-line/soft my price targets are as follows.
TP1 - ~25378 NQZ
TP2 - ~25682 NQZ
TP3 - ~25870 NQZ
TP4 - ~26273 (Price target if we get a strong year end Santa Rally) NQZ
Looking for these moves to be made into the beginning of January.

NQ 24,958 TargetShorting NQ from the 35,317.5 or so will obviously need to adapt and adjust as time goes on reference my previous post for levels

NQ dailyWhat i currently see on the NQ daily chart, drawn out. Added TrenVantage LITE to plot out the trends but highlighted the important ones for us here. The regain is technically on if they lose then it seems new lows are likely.

267 handle move bullish - NQ
Lower 1D Shadow quadrant exactly respected, which is a strong bullish sign according to ICT
1D Breaker MT (midpoint or mean-threshold) exactly respected with the candle bodies, which is also a strong bullish sign according to ICT
The event horizon - which is the midpoint of 2 new-day- or new-week-opening-gaps align exactly with the 1D volume imbalance CE (consequent encroachment or midpoint)
Strong bullish market-structure and the movement aligns with seasonal tendencies as well

NQ Bear FlagLooking at the chart here still room down going off my levels from last week would need to break out of this flag to have any room up

NQ; Continuation to lower demand? 📈 Hey Traders!
Here’s a fresh outlook from my trading desk. If you’ve been following me for a while, you already know my approach:
🧩 I trade Supply & Demand zones using Heikin Ashi chart on the 4H timeframe.
🧠 I keep it mechanical and clean — no messy charts, no guessing games.
❌ No trendlines, no fixed sessions, no patterns, no indicator overload.
❌ No overanalyzing the market; use only two time frames.
❌ No scalping, and no need to be glued to the screen.
✅ I trade exclusively with limit orders, so it’s more of a set-and-forget style.
✅ This means more freedom, less screen time, and a focus on quality setups.
✅ Just a simplified, structured plan and a calm mindset.
💬 Let’s Talk:
💡Do you trade supply & demand too ?
💡What’s your go-to timeframe ?
💡Ever tried Heikin Ashi ?
📩 Got questions about my strategy or setup? Drop them below — ask me anything, I’m here to share.
Let’s grow together and keep it simple. 👊

BQ UpdateMFI touched oversold but RSI has not. There is a chance that it hits oversold SUnday night then reversed before US market open.
I'll wait for Monday.
