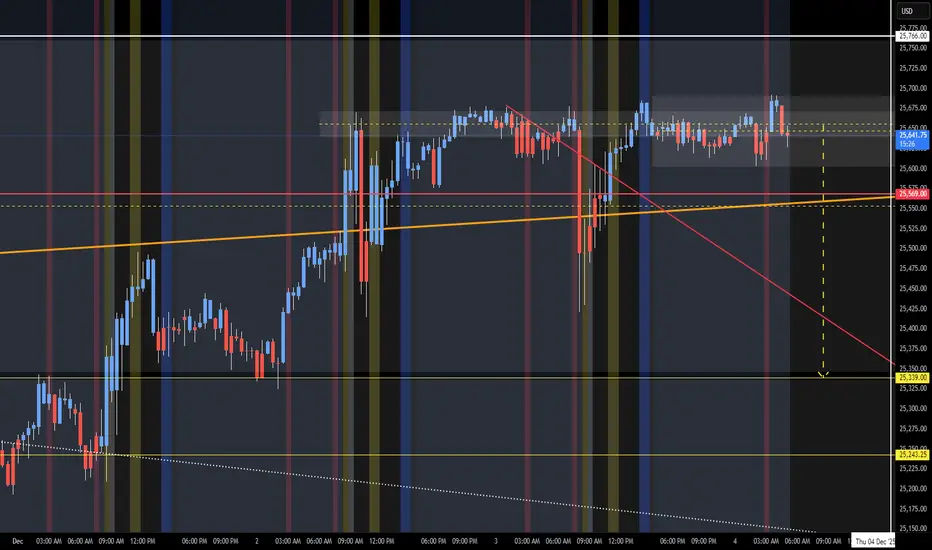
NQ Short (12-04-25)Nothing new, still liking the Short. Seems like market is waiting on Stimulus, QE or something because price action is aimless. Only appears to lift in O/N, Dead Zone or any lower volume trading period. Open Drive selloff of no return, or not.
Trade ideas
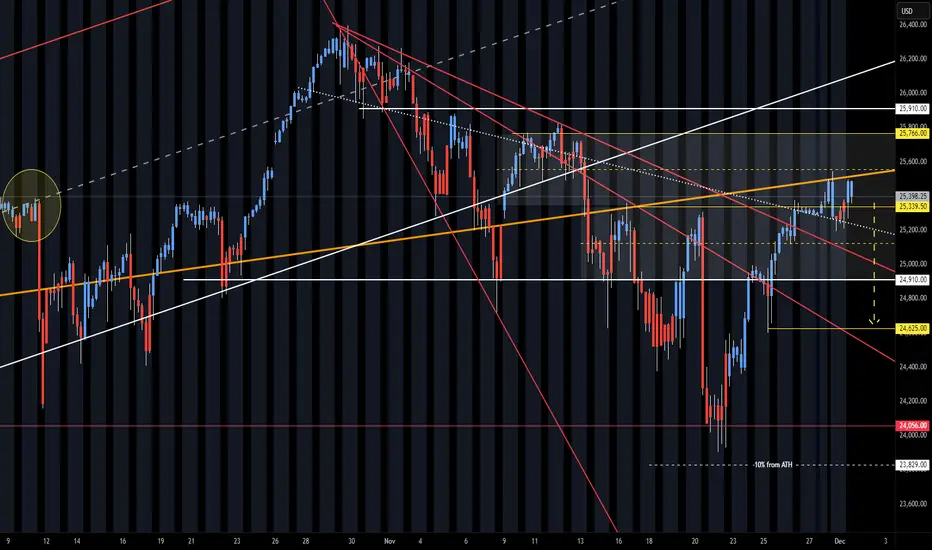
NQ Short (12-03-25)White arrow is range for breakout, lower break may drop to KL 24,625. This may be today or next few. KL 25,620 is major key level today.

NQ Short (12-02-25)Easy one from here, Long above 25340-360 and Short below. Let the Overnight lift and stall and look at Reg Session Open Drive for a drop test. Tweets, Tricks and low volume periods are only challenge on this one.
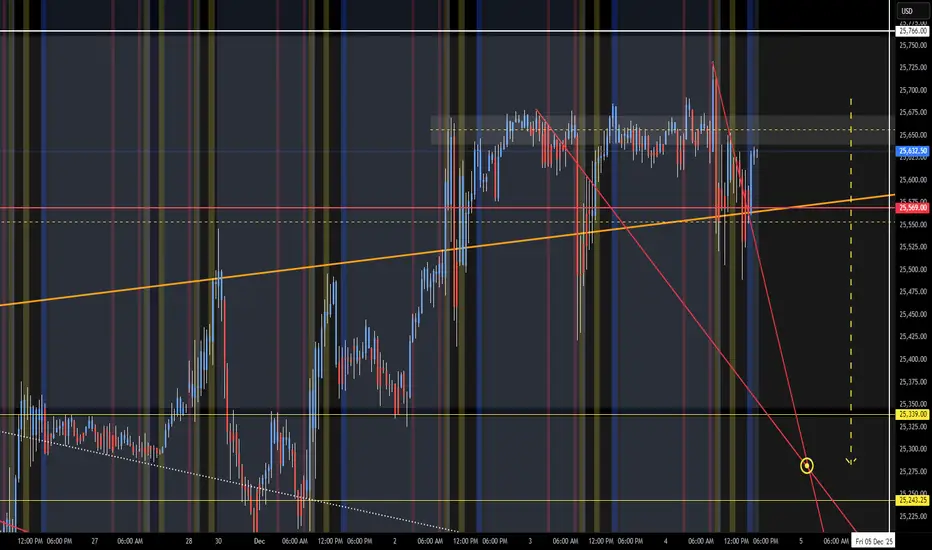
NQ Targets (12-05-25)Yellow arrow is lower target and 25,766 is upper Turn Zone. Past three days have been struggling to stay in range above orange TL below. O/N will have to pump it up and Reg Session will have to sell it off (big). Other option is snail life higher into Friday - Monday Long Play, just watch the head fakes long and failure of Dead Zone dip buying lift.
MAJOR MARKET SIGNALPlease watch the entire video to understand my overall logic.
Through the years I've gone through many different strategies, learning, refining and sharpening my edge in the markets. Today I truly find myself most in the identity of a "Discretionary Trader" with a mechanical approach.
In this chart break down I am displaying a Monthly Hanging Man Signal Bar.
This is provided to me by the market not a 3rd person subjective strategy. We are going to want to monitor how price behaves at the high and low of prior monthly candle. Breaks of these levels will act as pivot points.
Do you think this could be the start of a massive correction?

NQ Range (12-01-25)NAZ lower in O/N and inside wide Churn Zone, look Long above 25339 and Short below 25,125. May see opposite direction trades at these levels and some sideways churn until breakout. Look at 1,000 point range of 25,910 - 24,910 as a wider CZ range.

NQ UpdateLooks like it's still melting up, though it's a slow melt up.
Probably not gonna trade today.

NQ UpdateOdd that MFI went up on no movement
At this point, I'm mostly cash. My favorite long play was GM calls, and that looks topped out.
Not sure about NQ, but I think ES will double top, so no put options for now. I did think about buying GM puts but decided not to.
Scalping the 1 minute using HTF OHLC strategy: Prop Firm StratSimple Scalping, Trading Take Profit Testing account. Using my Best Trade Set up Strategy on the 15-minute candles.

NASDAQ 100: Bullish! Look For Valid Buys With The Trend!Welcome back to the Weekly Forex Forecast for the week of Dec. 1-5th.
In this video, we will analyze the following FX market: NASDAQ (NQ1!) NAS100
The NASDAQ closed last week strong. It would indicated the potential for follow through going into this week, at least early.
Bear in mind that the previous 3 weeks were very bearish, coming down from ATHs, and forming a bearish MSS.
Look out for confirmations for valid trades. The overall trend is bullish, so I am personally looking for valid buys. A bearish MSS would invalidate those ideas.
Enjoy!
May profits be upon you.
Leave any questions or comments in the comment section.
I appreciate any feedback from my viewers!
Like and/or subscribe if you want more accurate analysis.
Thank you so much!
Disclaimer:
I do not provide personal investment advice and I am not a qualified licensed investment advisor.
All information found here, including any ideas, opinions, views, predictions, forecasts, commentaries, suggestions, expressed or implied herein, are for informational, entertainment or educational purposes only and should not be construed as personal investment advice. While the information provided is believed to be accurate, it may include errors or inaccuracies.
I will not and cannot be held liable for any actions you take as a result of anything you read here.
Conduct your own due diligence, or consult a licensed financial advisor or broker before making any and all investment decisions. Any investments, trades, speculations, or decisions made on the basis of any information found on this channel, expressed or implied herein, are committed at your own risk, financial or otherwise.

This is Monday we'll look at shorter contractsTake a look at the patterns on smaller contracts of gold silver and there was an oil market that we didn't get to see because I didn't know how to push the buttons and there's another market as well that we talked about all of them less risky but rest good return but not you know they you don't if you start trading these markets you have to trade the smaller contracts and then you get a feel.

NASDAQ - The Good The Bad The UglyGood Afternoon Everyone,
I hope all is well. I have for you a 3 set analysis on what we can expect from the markets this week. Nasdaq TA completed on Weekly, Daily & 1Hour Time Frames.
WEEKLY TREND (Dominant Macro Structure)
Status: Long-term bullish
Signals:
Price inside a multi-month bull channel
Slight channel edge break, but no reversal
Momentum slowing → consolidation expected
Weekly support zones are strong
Weekly takeaway:
The long-term trend is bullish, but entering a cooling/consolidation phase.
Weekly = macro anchor. It strongly biases the market upward over time.
DAILY TREND (Intermediate Structure)
Status: Mixed / Transitioning
Signals:
Price broke down from daily bull channel
Attempted to re-enter → rejected
Sitting between the 50 EMA and 200 EMA
Daily support zones are key
Daily candles show indecision
Daily takeaway:
Trend is no longer strongly bullish. A corrective process or deeper retest is likely before continuation.
Daily = controls medium-term direction and determines where the weekly trend re-engages.
1-HOUR TREND (Short-Term Structure)
Status: Short-term bullish
Signals:
Price broke out of short-term bearish channel
Formed a new, tight bullish channel
Recently rejected at underside of long-term weekly channel
Short-term support forming
Price above 50 EMA & 200 EMA intraday
1H takeaway:
Short-term momentum is bullish, but rejected at major higher-timeframe resistance. Needs support to hold.
1-hour = entry timeframe and shows how the daily trend is forming in real time.
COMBINED MULTI-SCENARIO OUTLOOK
Below are the 3 most realistic combined scenarios using all three timeframes together.
They are ranked from most likely → least likely.
SCENARIO 1 — Controlled Pullback → Higher Low → Trend Resumes Upward
Probability: ★★★★☆ (60–65%) → Most Likely
How This Unfolds (Multi-Timeframe Logic)
Weekly:
Staying bullish but consolidating
Weekly support will eventually absorb selling
Daily:
Mixed trend resolves with a higher low above major support
50 EMA or support #1 holds
1-Hour:
Pullback into short-term support
Bounce signals bullish continuation
Price Path:
1-hour pulls back to support
Daily prints a higher low
Weekly resumes its upward grind
Price re-attempts to re-enter/top the long-term bull channel
This scenario is ideal for:
Swing longs
Daily HL entries
1-hour EMA bounce setups
Continuation plays into the top of the long-term channel
Why most likely?
Because every timeframe except the 1H is cooling, not reversing.
SCENARIO 2 — Deeper Correction Into Major Support → Then Strong Bounce
Probability: ★★★☆☆ (30–35%)
This is your deeper pullback scenario but still bullish long-term.
How It Unfolds (Multi-Timeframe Logic)
Weekly:
Sideways consolidation expands lower
Price moves toward deeper weekly support zone
Daily:
Daily loses the 50 EMA
Price moves toward the 200 EMA
This forms a deeper corrective wave
1-Hour:
Short-term bull channel breaks
Price trends downward intraday
1H shows lower lows until 200 EMA daily zone is reached
Price Path:
1H breakdown → pullback
Daily breaks support #1, moves to support #2
Strong bounce at daily 200 EMA
Weekly trend reasserts → new multi-week rally
This scenario is ideal for:
Buying the daily 200 EMA
Position trades
Mean-reversion long setups
Why it happens?
Because daily trend has weakened AND weekly momentum is slowing — deeper retests are common.
SCENARIO 3 — Breakdown of Daily & Weekly Supports (Full Trend Reversal)
Probability: ★☆☆☆☆ (5–10%) → Least Likely
This would require multiple failures across all timeframes.
How It Unfolds (Multi-Timeframe Logic)
Weekly:
Both long-term support zones break
Weekly closes below the bull channel
Daily:
Price loses both support levels
200 EMA fails
Lower highs and lower lows form
1-Hour:
Sustained intraday lower lows
Bearish channel resumes
No re-entry attempts succeed
Price Path:
1H → breakdown
Daily → breakdown
Weekly → full structural reversal
Why unlikely?
No topping pattern on weekly
Macro trend remains bullish
Daily structure is corrective, not reversal-based
Buyers have not shown exhaustion at any major swing level
I hope you found this useful! Enjoy your week!

Possibly Bearish Nasdaq has push above a major zone this weekend and currently at the neckline of that 4HR H&S so if price fall back below that major zone I can see sellers come into play and push it lower.

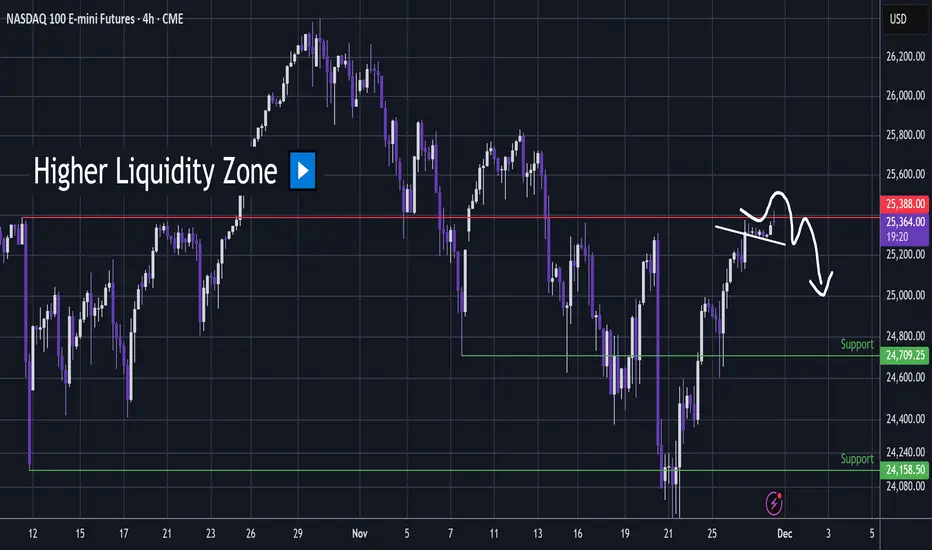
NQ1 - Bot Favourite Topping Pattern ?NQ1 Indices1
Notice the little descending line before the pop underway.
This is quite a bot favourite topping pattern with the textbook bullish pattern leading to a slightly higher high liquidity sweep - which here is into the higher liquidity zone above resistance.
So it is somewhat setting up for a pull back.
But until we see some upper wicks, I remain neutral 🧐.
NQ1 - Holding... Santa Rally Incoming?NQ1 Indices1
Still looking dangerous in the short term having printed a quick slump through resistance.
But its holding here and perhaps it can continue up from here.
If it was going to collapse then we might see plenty of leading slumps in stocks.
And we are seeing slump action in crypto and crypto stocks, but most stocks that I cover are looking positive and pushing up as we enter December.
Could a Santa Rally be on 🤨🎅.

FVG Reversal Play – NASDAQ 100 Futures [NQ1!]CME_MINI:NQ1! FVG Reversal Play – NASDAQ 100 Futures
Signal: 🟢 BUY
Entry: 25,106.00TP1: 25,327.75TP2: 25,376.00TP3: 25,500.00SL: 24,924.50
Insights:
Price retraced into a Fair Value Gap (FVG) and sits near the 0.618–0.705 Fibonacci cluster, aligning with high-volume nodes on VRVP.
RSI is recovering from oversold territory, MACD histogram shows bullish divergence, and price is near the 200 MA support zone.
Strong confluence across all indicators suggests a potential bullish reversal from a liquidity sweep zone.
🌟 Trade Like Hunter (for professional edge)
✅ High-Probability Setup:
VRVP shows volume concentration at entry zone
MA acts as dynamic support
RSI and MACD signal bullish momentum shift
📊 Risk-Reward Ratio:
R:R ≈ 2.5:1 (TP2), up to 3.5:1 (TP3)
🔑 Liquidity Zone Confirmation:
Entry aligns with imbalance zone and previous demand sweep
🧠 Market Psychology:
Signs of accumulation post-selloff; potential breakout momentum building
⚡ Probability Score:
80% High Probability
📈 Scalability:
Setup aligns with 1H and Daily timeframes for broader confirmation
🔒 Risk Disclaimer:Always use proper risk management. Past performance does not guarantee future results. Trade responsibly.
@LunaGoldHunter
NQ1 - DAY TRDERS OUTLOOK GUIDE FOR 202-12-02Good Morning,
I hope all is well. I always trade with the overall market trend. Here is my guide for the day.
Likely Scenarios for Today
Scenario A – Most Probable (≈60%): Bullish Grind with Pullbacks
Price dips into 25,350–25,300, finds buyers at the EMAs.
Momentum rebuilds.
Slow grind upward toward 25,600 retest.
You will see:
MACD curling upward
DI+ widening over DI-
ADX flat or slightly rising
Best play: Buy the pullback into hourly support.
Scenario B – Rejection and Deeper Pullback (≈30%)
If price loses 25,300, the market likely accelerates downward into:
25,150 (trend-support reset)
Possibly 25,000 liquidation sweep
The indicators would show:
MACD bear cross
DI- crossing above DI+
Oscillators breaking below midline
This would be the only bearish scenario worth taking seriously.
Scenario C – Immediate Breakout (≈10%)
Price surges through 25,600 early in the session and runs momentum into:
25,720
25,850 as the extension
But volume suggests this is less likely unless macro news triggers it.
Today’s Bias Summary
Trend: Bullish
Momentum: Cooling
ADX: Weak trend
Structure: Rising into overhead supply
Key battleground: 25,350 support vs 25,600 resistance
Bias:
Bullish continuation IF 25,300 holds.
Bearish flush IF 25,300 fails.
Hope you Enjoy!

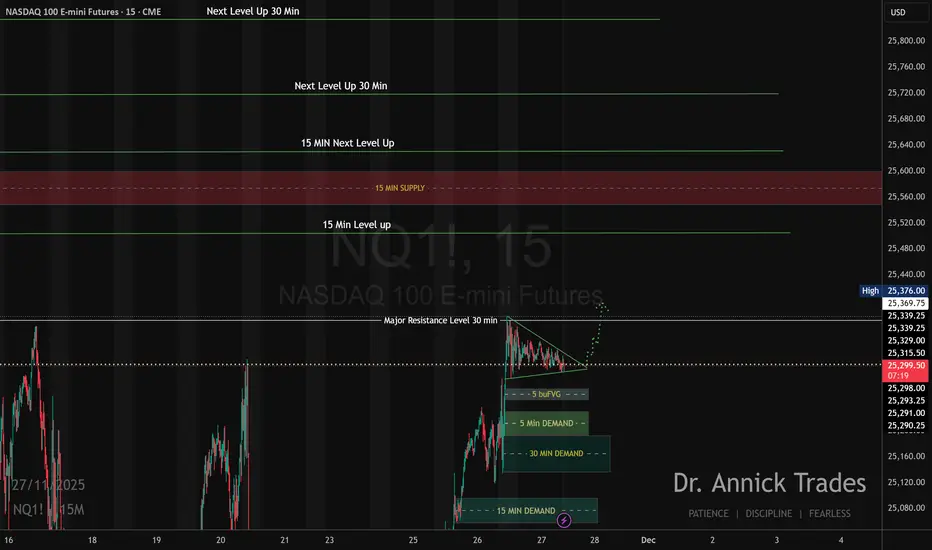
NASDAQ ANALYSIS ON 30 MIN CHART Long & Short analysis on nasdaq based purely on high-probability zones. i trade from zones only—because when price enters a valid zone, a move is expected. these zones are not session or time dependent. execution, risk management, and psychology decide how much you extract from that move. analysis alone never guarantees profits. discipline does.
trade smart. manage risk. stay consistent.
happy trading.
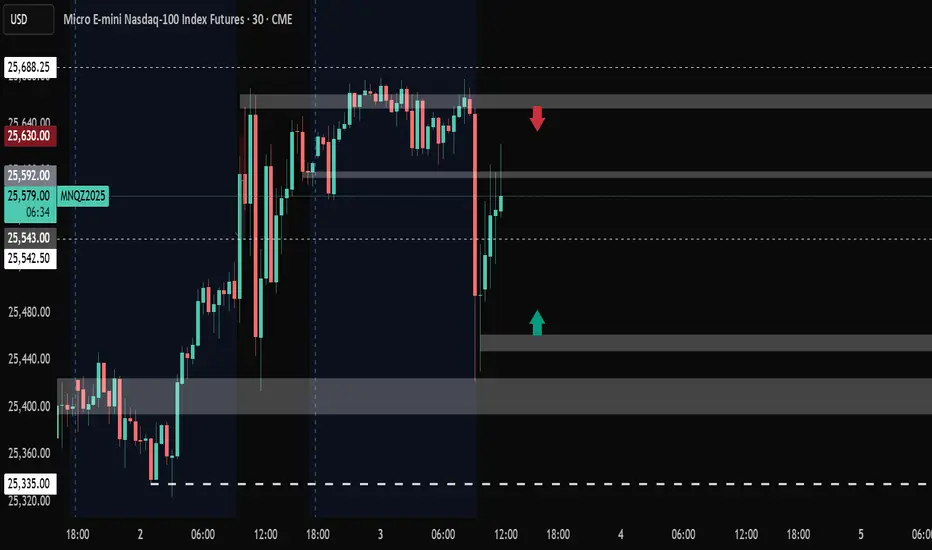
Location 30m NY Session 1 Dec 2025There are 3 setups based on a 30 minute structure on 1st December 2025.
Location 1 :
- Structure breakout buy
Location 2 :
- Structure breakout buy
Location 3 :
- Structure breakout buy

NQ UpdateNQ MFI hit oversold on the afternoon drop, chart doesn't show it because it only shows where it closed on the 3 hr.
Wasn't quite sure about gap direction tomorrow, so I didn't enter into a trade on this one yet. Gap direction will depend on inflation numbers, but I expect tech to rally for at least a couple of days just like small caps (RTY) did.

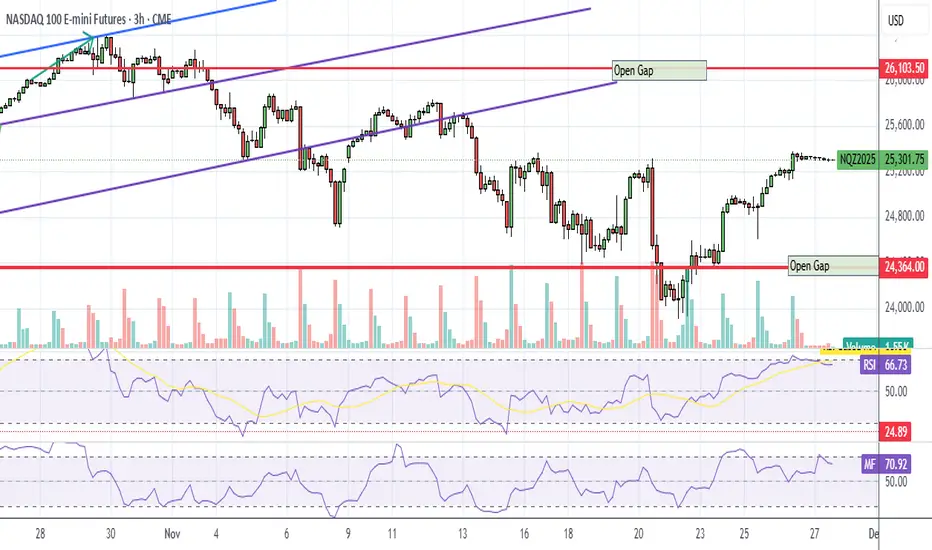
NQ Targets (11-24-25)The downtrend is on and will play inside the Diablo's (red diagonal lines) until breakout. 24,600 to 24,056 is Churn Zone and 24,708 and 24,226 are KL's to watch for opposite direction trades 1st and follow through 2nd. NAZ did come close to -10% level in the overnight, popped back up on a Friday (typical). The original Short call was aiming at all the O/N gaps up from prior Rig lift (from O/N), these have been cleaned out. The NDX chart will show these that started on 10/24 through 10/29. Note, from here the math gets interesting and can be illustrated on the NDX chart. We may see heavier selling in the O/N as 11/20 was an outside day reversal close. Notice on the NDX chart that the recent 58% lift can erased will only a 37% drop and the YTD 24% high is erased will only a 19% drop. Heavy volume lower after light volume (off session) lift. Keep in mind that the O/N has a new limit down of -7% (old was -5%). Keep in mind the drawdown math effect = pain. Unless we see a retest that can get above NDX Danger Zone and get back above the Upper TZ or long term trendline (orange, 25,095). NDX 25,095 - 23,233 is Churn Zone until breakout. NQ - NDX differential is about 200 points.
NDX Chart

Thanksgiving NQ LevelsNasdaq-100 E-mini futures are trading near 25,318 this morning, showing a modest rise driven by growing optimism about a potential Federal Reserve rate cut in December. This momentum follows renewed strength in major tech names—especially AI-linked stocks—which has helped lift the broader Nasdaq Composite over the past several sessions. With expectations of lower rates, dovish Fed signals, and improving confidence in growth and tech sectors, the near-term outlook points toward continued upside or steady consolidation at current levels. However, gains may be capped if enthusiasm around AI fades or if upcoming economic data weakens the argument for rate easing.
Happy Thanksgiving to you all
Gobble, gobble!!
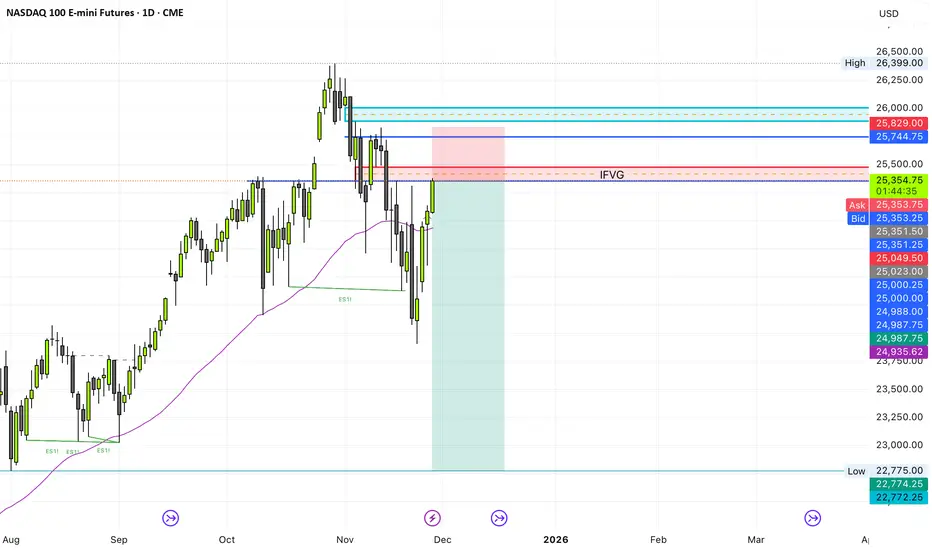
Potential short setup on NQ
I am still learning but looking to me like a potential short setup from that daily inverted fair value gap targeting the next sell side liquidity zone.
Please let me know in the comments if my bias is wrong and why.