Precise Plan & ContextBeautiful chart. How to interpret it? How to trade it? How to manage risk?
One must have a precise plan, contextually interpret the charts and manage risk.
Precise Plan
1.Buy the Breakouts
2.Buy the Dips
3.Buy the Pivots
Buy the Breakouts
1.Wait for a bounce
2.Set a buy to open (bto) stop market order above the bounce
3.Enter a sell to close (stc) limit order
Buy the Dips
1.Wait for a bounce
2.Set a bto limit order less than the close of the bounce
3.When it fills set a stc limit order
Buy the Pivots
1.Find a strong Support
2.Set a bto limit order
3.When it fxs set a stc limit order
More Details
My Breakouts
1.I always stack them to the ceiling.
2.Most of the time I place a bto stop mkt order every 5 points.
3.For each entry I set a 19-point target.
NOTE: You must tailor this to your risk tolerance and to your account size.
NOTE: I do not place a stop loss. I manage risk by always keeping a close eye on Intraday Margin and Initial Margin. These are all-important. This cannot be over emphasized.
NOTE: Another way I manage risk is by not overlapping my trades. For example, if my margin requirements need some breathing room, I will not enter another trade until the prior trade has fxed its target.
My Buy the Dips
1.I usually wait for a bounce.
2.I buy them in descending 5-point intervals
3.19-point target for each trade
NOTE: Often, even a good bounce fails and the px goes lower. Always plan for this. Always.
NOTE: I always have accumulation/distribution areas clearly visible on my charts. This is where buyers and sellers have met in the past. Maybe they will meet here again.
NOTE: My goal is to have 5 a day. Here is the math with my broker: 5 trades x 5 days x 36.18 P x 50 weeks = $45,225.00. I am way ahead of that goal.
NOTE: Past performance is not indicative of future performance.
My Pivots
1.Look for a strong pivot.
2.I always aim to get a 101-point target.
Context is extremely important.
1.Learn how to interpret a chart. I assume most of you have learned the basics. If you haven't Jerremy Alexander Newsome has many great videos on YouTube. He also has much info on his website, reallifetrading.com. Investopedia is another great resource.
2.News is vital. News moves markets. Look at Liberation Day, 4/2/25. Look at June 13th, the day Israel bombed Iran. The jobs report comes out every first Friday of the month. Earnings reports matter. FOMC day, PCE, inflation data etc. etc. etc... I always look at MarketWatch's U.S. economic calendar. It's free and an invaluable resource. Find a reliable economic news source. I always have Fox Business on. They have great hosts and great guests. You will get a great economics education. Maria Bartiromo comes on at 06:00:00 NY time and she sets the day for any important events you should know.
3.We are in an historical bull market marking the early days of The Fourth Industrial Revolution - that of AI & Robotics.
I'm probably forgetting somethings right now. I will add them as I think of them. Here is one now - most of the time I am looking at a 5-minute chart. Here's another - I use Session Volume Profile charts daily. Each session (trading day) will have a point of control (poc). Buyers and sellers meet here. Sometimes a poc will not be touched by the next session's candles. It then becomes a virgin point of control (vpoc) and its significance becomes greater.
Until now, I have included many entries, many results and much math. I wanted you to get a feel for these things. They are the essence of trading. Perhaps going forward I won't post these, at least not so often.
I fear that I have been ham-handed in my posts - like a machine gun laying down rapid, unaimed firepower. I think this post best describes my trading plan and my thoughts on how important context is to trading. Context is far more comprehensive than just a chart, not to minimize the importance of charts. A chart, I suppose, could be pictured as a ship and context is the sea upon which that ship sails.
I hope this helps you have a Precise Trading Plan suitable to your singular needs, and that you see how vital and comprehensive Context is.
Trade ideas
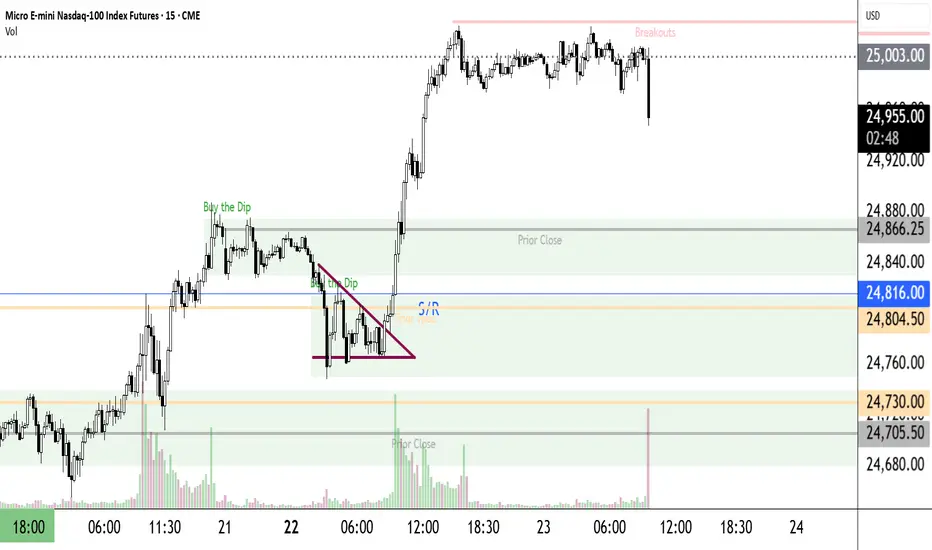
SELLBearish Order Block (Supply Zone):
Price rejected strongly from the supply zone marked between ~$24,770–$24,820.
Large wicks and volume spike indicate heavy selling pressure from this zone.
Break and Retest:
Price previously broke below a support level (~$24,780), then retested that zone before selling off again.
This confirms the zone has flipped from support → resistance.
Volume Confirmation:
High sell volume bars on rejection confirm institutional selling.
Follow-through candle closed below the support-retest level.
Market Structure:
Lower highs and lower lows forming, indicating short-term bearish trend continuation.

NQ: 259th trading session - recapSkipped school totally today and was able to pull off a BUNCH of work concerning my strategy and further future inquiries
NQ - Nasdaq Is Coming For Your Stop!OK, there's not much to say.
That guy looks bad. I mean, really bad §8-)
Let's see if we can use the bad mood for a nice short down to the bottom.
Ohhhh Myyyy.....

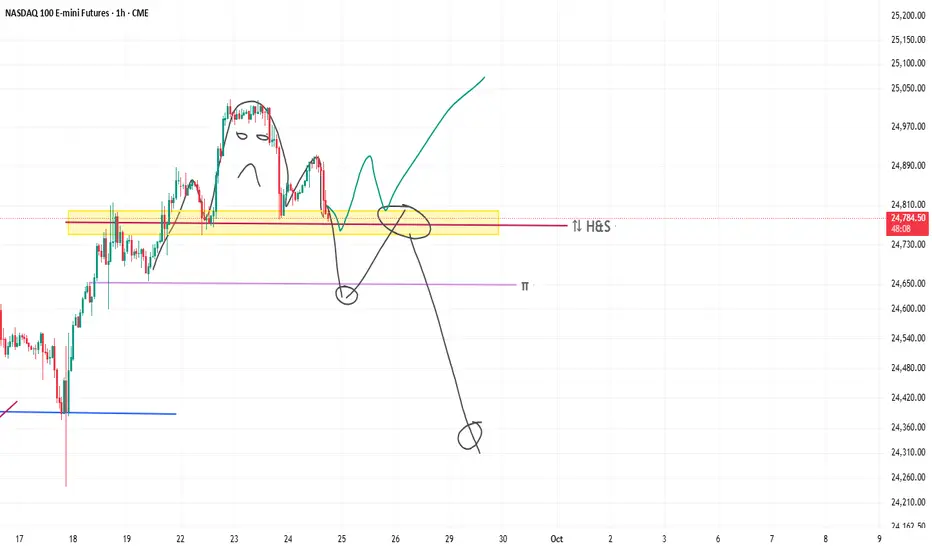
NQ. Decision point Yep, thats a classic H&S.
Soon enough one of two things will happen.
Either bulls defend this yellow area, especially if they are in with size at the top. or bears will take over.
So far iam not biased to short, but waiting for confirmation.
Also watch out, because sometimes whales just push the price down to convince everyone that they are selling, then push the price upwards.
Day Trading a 50k AccountThree Trade Plans
1.Breakouts
2.Dips
3.Pivots
Context
1.historical bull market - the early days of The Fourth Industrial Revolution, that of AI and Robotics. Many millionaires and billionaires will be newly minted.
2.a great deal of news happened yesterday that the markets are still digesting.
3.new home sales come out @ 10:00
4.much possible market moving news comes out tomorrow (see MarketWatch U.S. Economic Calendar)
5.PCE is out 9/26 08:30. It is possible the markets will hang out waiting for that news. Watch that one carefully.
Action
1.Breakout orders are in place, stacked to the ceiling
2.Dips will be placed if we get a good bounce
3.Pivots: I have three in place, 24807, 24777, 24597.I won't place the 24807 order until our Pivot from 9/23 hits its target.
NQ Power Range Report with FIB Ext - 9/24/2025 SessionCME_MINI:NQZ2025
- PR High: 24863.00
- PR Low: 24836.00
- NZ Spread: 60.5
Key scheduled economic events:
10:00 | New Home Sales
Session Open Stats (As of 12:15 AM 9/24)
- Session Open ATR: 267.57
- Volume: 18K
- Open Int: 274K
- Trend Grade: Long
- From BA ATH: -0.7% (Rounded)
Key Levels (Rounded - Think of these as ranges)
- Long: 25204
- Mid: 23571
- Short: 21939
Keep in mind this is not speculation or a prediction. Only a report of the Power Range with Fib extensions for target hunting. Do your DD! You determine your risk tolerance. You are fully capable of making your own decisions.
BA: Back Adjusted
BuZ/BeZ: Bull Zone / Bear Zone
NZ: Neutral Zone
Bias NQMy bias on NQ for the rest of the week is bearish. We just inverted a 4H FVG, and there’s a high probability that price will target the lows.
Ideally, I’d like to see price reach at least the SSL I marked up.

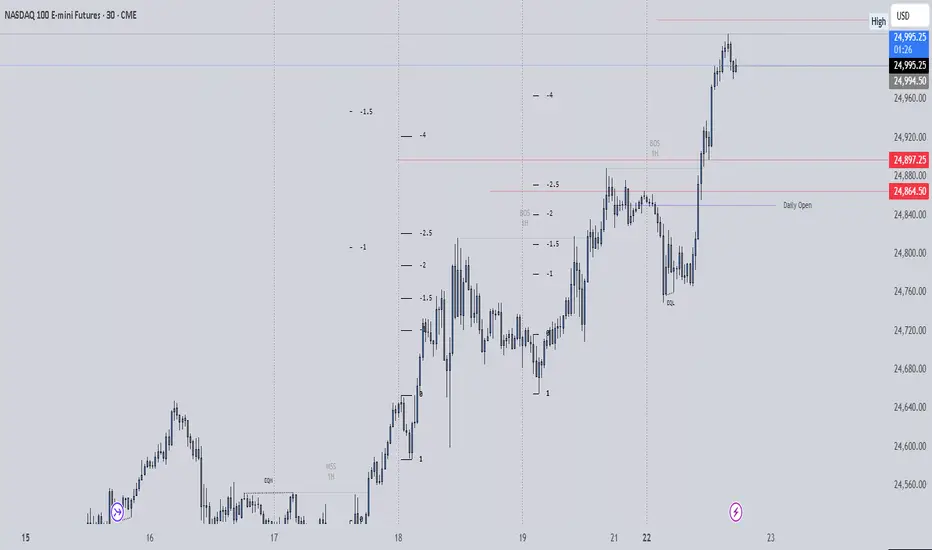
NQ FUTURES IDEA 09/24We are looking to re test the top of 25,027 NQ but first we will drop to 24,751 NQ. I think we trade around this 24,751 range and then start pushing back up to re test 25,027 NQ. If we fall below 24,751 NQ we will fall to next level 24,535 NQ.

It‘s about Time… SHORT till NovemberTime to switch lanes
- upper trendline rejection
- sell pressure is building (build your shorts)

Long NQTwo Opp in here.
The first one is short opp. That is a very very risky trade to take, since we are in a strong uptrend.
Looking to take the long instead, then as a confluence, we wait until Jerome speech in 30 min, which i expect if its positive, hopefully, the price drops to our long entry, then continue upwards.
If its a hard correction (but the news is positive, and the price corrected harder.
Iam building my case for a bullish news, not a bearish ones (since inflation dropped to about 2.15%, which means maybe quantitative easing soon), positive for the market.
Lets see how it goes.

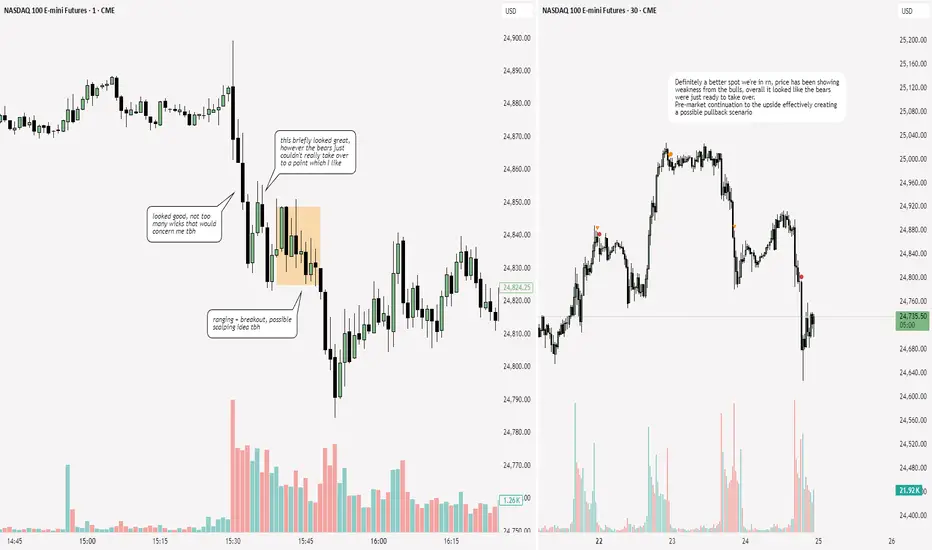
NQ: 258th trading session - recapI categorize now how I can scalp better, I cann them "events" - basically if something happens that makes price deviate from its original past since the opening, this can be a pullback, reversal, range or whatever. In the time being it's just an event, idk what will happen or where price will go next, but it is a good way for me to contextualize my system a bit more

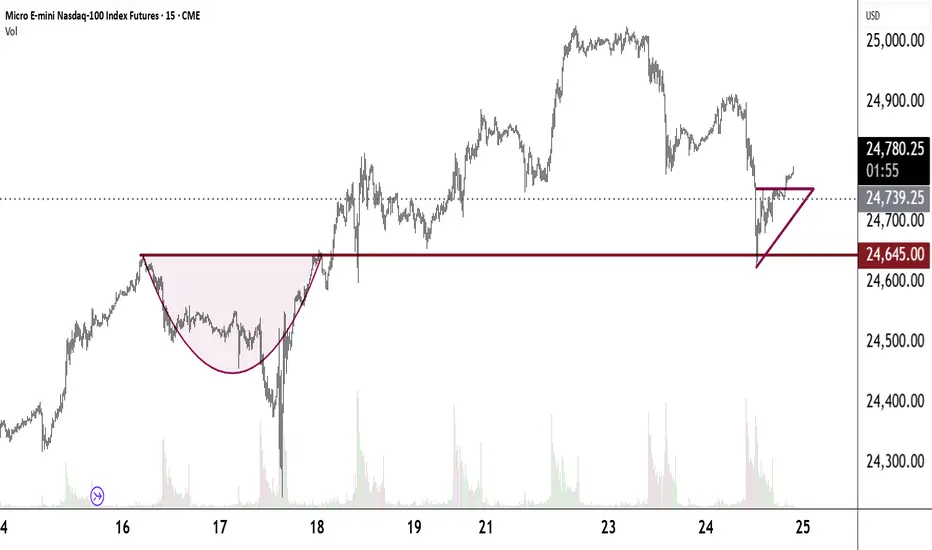
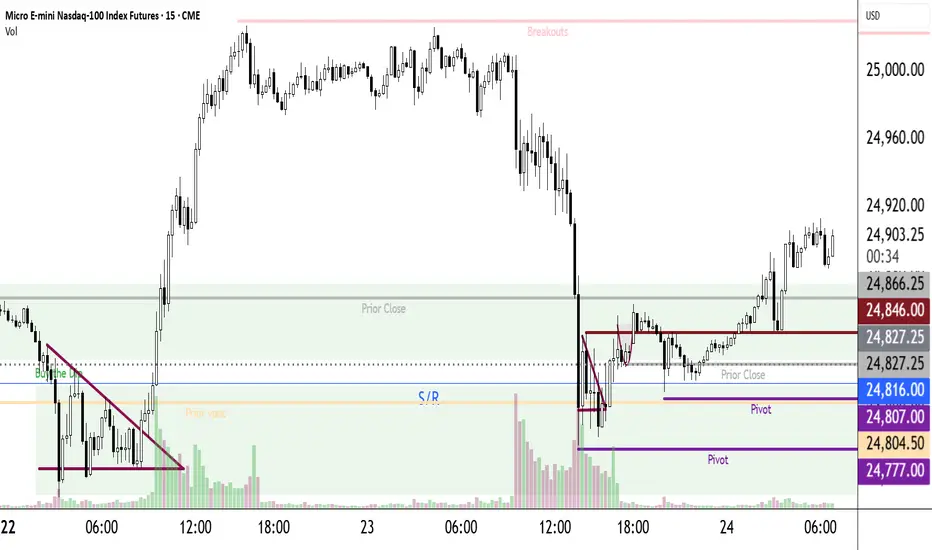
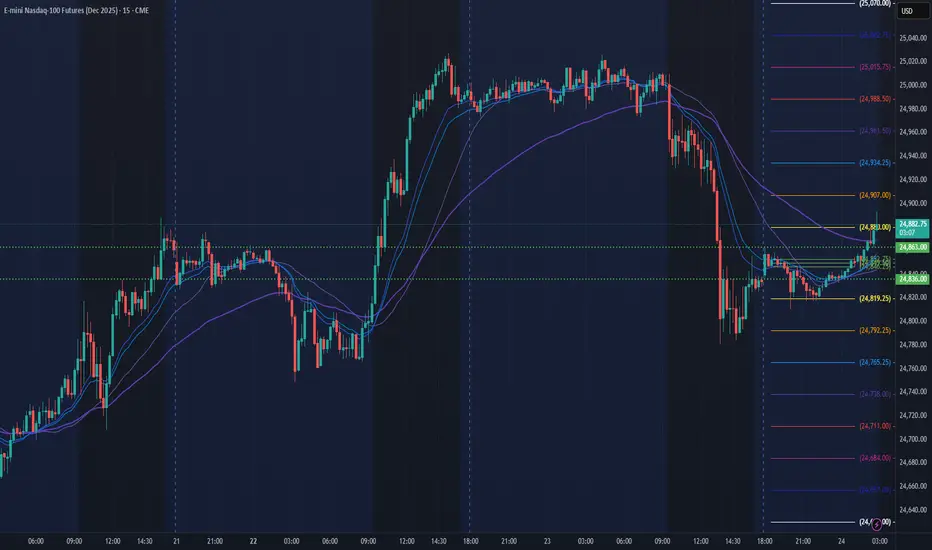
Day Trading a 50k AccountMany strong Buy the Dip areas
1.accumulation/distribution areas
2.prior day closes
3.strong Support at 24816
4.several daily session poc.s
5.px coil
6.cup
Day Trading a 50k account1.Breakouts
2.Dips
3.PIvots
Breakouts
1.+1 every 5 points
2 target: 19 points
Dips
1.+1 every 5 points
2.target: 19 points
Pivots
1.+1
2.target: 101 points
Pay attention to market moving news.

Day Trading a 50k AccountThree Trade Plans
1.Buy the Breakouts
2. Buy the Dips
3. Buy the Pivots
Breakouts
1. +1 every 5 points
2. target: 19 points per each entry
Dips
1. +1 every 5 points
2. target: 19 points each entry
Pivots
1. +1
2. target: 101 points
Possible Market Moving News
1. 09:00:00 Michelle Bowman speech
2. 09:45:00 S&P flash PMI
3. 10:00:00 Raphael Bostic speech
4. 12:35:00 Jerome Powell speech
Ongoing updates throughout the day
AROI to date: $8,708.06 Take/50k account x 100 x 365/11 calendar days = 577.89852%

MNQ Long Setup – Golden Zone EntryLooking for a long opportunity on MNQ.
Entry: 25,011.25
Target (TP): 25,094.00
Stop-Loss (SL): 24,973.00
Price is holding above the Golden Zone and respecting structure. Expecting continuation toward target as long as the zone holds.
#MNQ #Nasdaq #Futures #Trading #Scalp

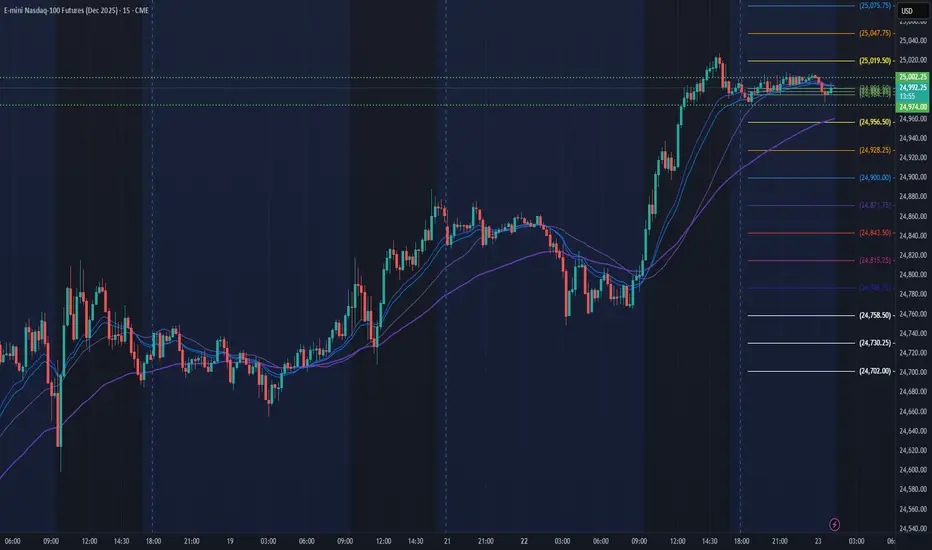
NQ Power Range Report with FIB Ext - 9/23/2025 SessionCME_MINI:NQZ2025
- PR High: 25002.25
- PR Low: 24974.00
- NZ Spread: 63.25
Key scheduled economic events:
09:45 | S&P Global Manufacturing PMI
- S&P Global Services PMI
12:35 | Fed Chair Powell Speaks
ATH climb continues, nearing 25204 key area
Session Open Stats (As of 12:35 AM 9/23)
- Session Open ATR: 268.99
- Volume: 18K
- Open Int: 277K
- Trend Grade: Long
- From BA ATH: -0.0% (Rounded)
Key Levels (Rounded - Think of these as ranges)
- Long: 25204
- Mid: 23571
- Short: 21939
Keep in mind this is not speculation or a prediction. Only a report of the Power Range with Fib extensions for target hunting. Do your DD! You determine your risk tolerance. You are fully capable of making your own decisions.
BA: Back Adjusted
BuZ/BeZ: Bull Zone / Bear Zone
NZ: Neutral Zone
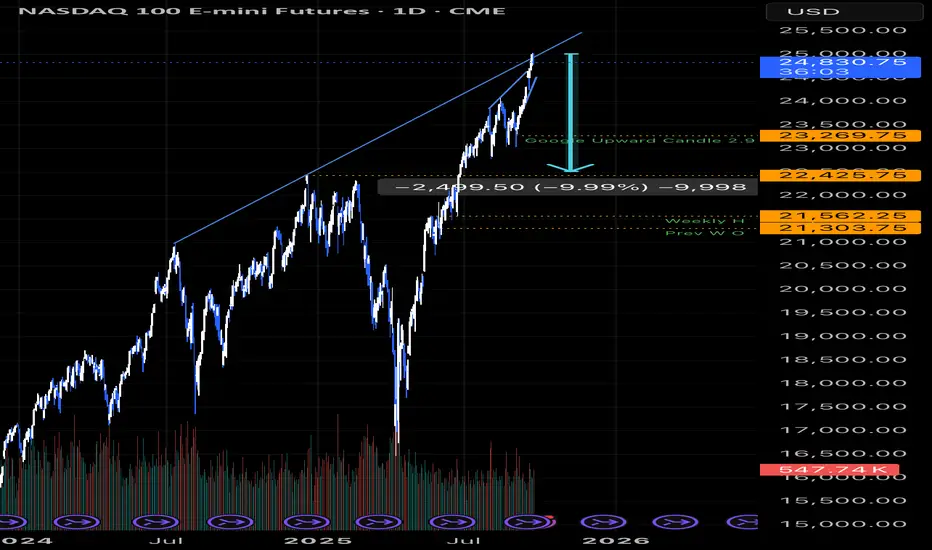
NQ Probably nearly Topping :)Markets been blasting of lately and its unthankful thing to call the highs but I believe we are in high proximity to the tops
Just looking at the current parabolic move makes me think it is very likely to be close to the intermediate high, im not trying to short this but we are quite close to the end of the move
May be even this week lets see

NQ - Sub Dividing Elliott Wave CountIs this possible? Multiple 1st and 2nd wave sub divisions, a small 3rd wave, and then again multiple 4th and 5th wave sub divisions.

Deviation projections and analysis update 30 minWe saw bullish momentum carry over from the Globex open last night, continuing the strength from last week. In the early hours of the overnight session, there was a manufactured move lower—likely an attempt to run stops or shake out late longs from last week. That move was quickly reversed, and bullish momentum resumed.
At this point, we're in price discovery mode. While I had hoped the upper deviation might produce a more meaningful reaction or healthy pullback, that hasn’t materialized so far. As the saying goes: "Just when you think it can’t go any higher—or lower—it usually does."
Nq LongChart speaks for itself. Previous resistance flipped into support, trendline is intact, and I expect it to hold in the coming days leading up to the Fed meeting.
NB! market could reverse early and push higher before touching the highlighted zone. Best approach is to actively monitor price action today for bullish signals. If you want to play it safe, wait for confirmation in the yellow zone. If you’re more aggressive, the red box is where you start paying close attention.
In the coming days: My base case (what i hope for): once rate cut announced → market sells off. Ideally, we get a decent dump that creates a better entry to reposition with size. I’ll reassess and update once we see how it plays out.

NQ: 257th trading session - recapIGNORE THIS POST - THIS IS JUST FOR THE RECORD
I might actually skip school on wednesday cuz if I miss this reversal/ pullback I'll be HELLA mad
