NQZ2024 trade ideas

NQ1/NDX - LONG TO FINAL BOSSGood Morning,
Long till final boss. We saw NDX take a pull-back in last weeks session. Since there has been some great momentum and now we are seeing a break out of consolidation into what is looking like a pretty nice run.
EMA 9 crossed EMA 50 - Breakout from consolidation and en route to break about previous highs.
Keep on eye on the 9 & 50 EMA as the trade progresses upwards. Break below these moving averages would suggest more consolidation until the new trend is determined.
Trade Safe Enjoy!

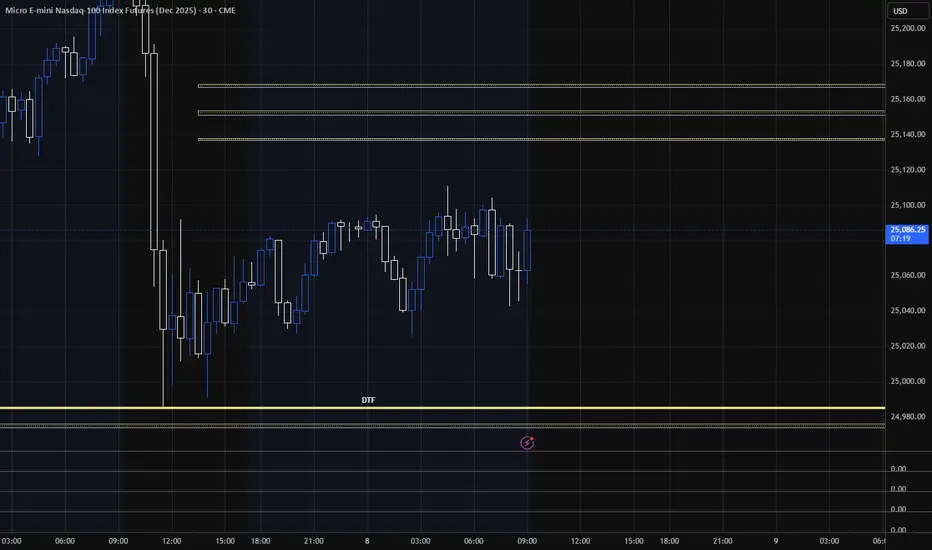
Target areas - NQ price for Market open.9/29/25 These are the target areas - NQ price for Market open depending if price moves up or down. Will look for trades into these areas.

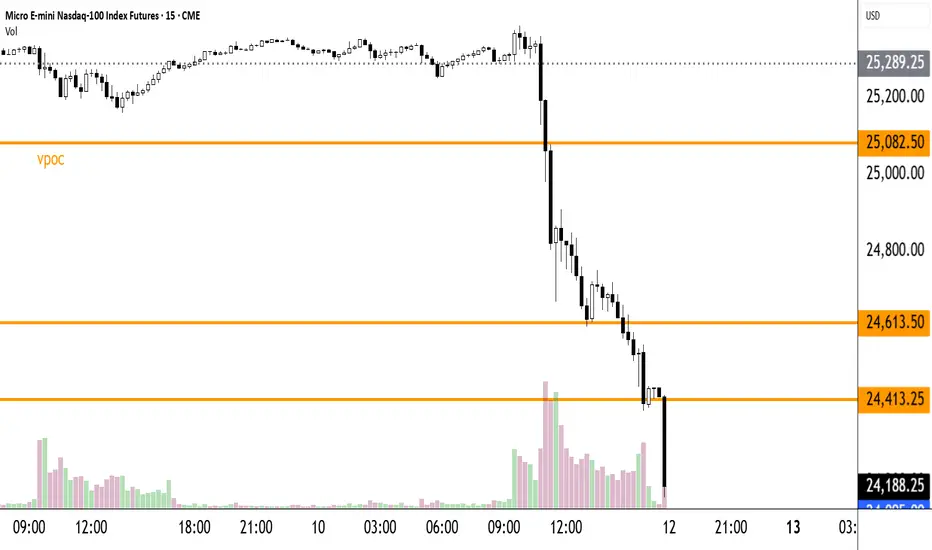
Emini Nasdaq 100. 10.10.2025, WalkthroughCME_MINI:MNQ1!
One-sided expansion after Trump announcement on China tariffs. A geopolitical event and major liquidation across the board.

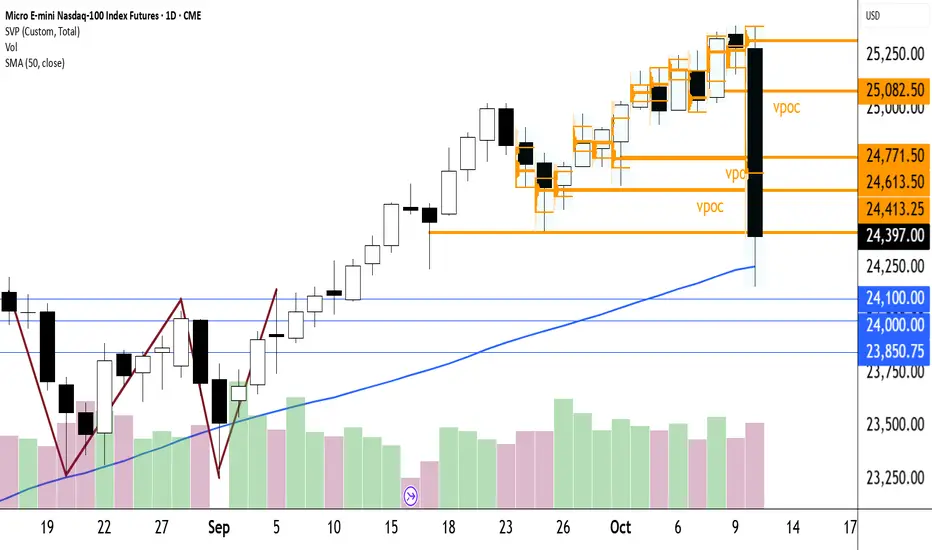
A Pawn for a King: Freefall - Extra Content I love charts. I know you can see the beauty and intricacies of this one and how it relates to our A Pawn for a King trading plan.
What a terrific money-making freefall. What a magnificent double bottom, bouncing on the 50- day sma. If you don't get excited observing this - you better check to see if you still have a pulse.
I am compelled to publish this chart as a sequel to my prior idea. They go together like peanut butter and jam.
I'm guessing there is a vpoc near the neck of that monumental W. I'm only able to get 21 or 22 days of svps on my chart. Does anyone know how to get more?
Isn't it a thing of beauty that the 50-day sma checked the 10.10. freefall? That's something to get excited about.
Let's see what happens. Whenever and wherever it bounces, we are ready to pounce with an arsenal of Breakout Trades, Buy the Dip Trades, Buy the Pivot Trades and A Pawn for a King Trades.
Some day. Some Golden Day...
A Pawn for a King: Freefall - Panic time? No way! This is where we stick the landing and win the gold!
Why is Paul Bunyan often depicted as a smiling, cheerful character? Why is he portrayed as a confident I can do this man? We all know why. It is because he is a man who is good at what he does, a man who can proudly say look at what I have accomplished, not in a braggadocios way but in a way of feeling delight in a job well done. It is his force multiplier - his great size and strength - that enable him to be so. We admire him for his character. We are drawn to him for his character. He realizes his full potential in life using his innate unique abilities and opportunities in a cheerful and humble attitude.
Let us now apply Bunyan's example to further illustrate the benefits of A Pawn for a King trading plan using the price action on Friday, 10.10.2025 as an example of its simplicity and its built-in force multiplier.
Let us pick up with our real-life example where we left off on my prior published idea. Everything is real. Only the names have been changed to protect the innocent.
Let us recall how the trade started. We waited for a good bounce on a strong support. Then we entered the trade by buying 2 MNQ contracts @ 24,994.5 and we sold 1 MNQ contract @ 24,994.
We then added 22 points to each of those entries - we bot 2 contracts @ 24,994.5 + 22 = 25016.5 and we sold 2 contracts @ 24,994 + 22 = 25016. Do NOT miss the subtlety. Our first trade we sold ONE contract. On this second and all subsequent trades, we will sell TWO contracts. This subtlety is the key to this plan. It is the force multiplier. When the pull back happens, and we all know it will, we have a secret weapon that enables us to do away with those awful things called stop losses, I meantersay, who's in this to lose? Instead of that losing proposition we have Paul Bunyan. We are Paul Bunyan!
We left off with $1,247.38 profit and we have just sold 2 contracts @ 25,390 and we bot 2 contracts @ 25,390.5. We are still 1L.
The px plummets. Do we plummet as well? NO WAY! We've got a force multiplier! That initial ONE contract we sold at the outset.
So, what do we do? That is a very simple question to answer. We wait for the next bounce at a strong support. This hasn't happened yet. We have a strong support in the area of 24,100 - 24,000. Whenever and wherever that bounce happens, we start the A Pawn for a King plan again. We sell 1 contract, and we buy 2 contracts $.50 above that. Remember how we were 1L when the px plummeted? Well now we are two long and no stop loss got in our way.
Now the force multiplier comes in. Let's say it bounces at 24,000 and we sell 1 contract @ 24,000 and we buy 2 @ 24,000.50. We add 22 points to each number, and we sell THREE contracts @ 24,000 +22 = 24,022 and we buy THREE contracts @ 24,000.50 + 22 = 24022.50.
The dark orange lines on my charts are vpocs. If you're not familiar with them learn about them and have them as a key part of your strategy. They are very powerful px magnets, places where buyers and sellers have met in the past and therefore very likely to meet again. Think strong support. Watch and wait for a good bounce on a strong support. Be patient. It will happen and you will be locked and loaded.
I hope you can see that rather than getting stopped out of a trade we turned our initial -1 contract into a force multiplier. In essence we just turned that px plummet into a gain of whatever that plummet was.
If we do get in again @ 24,000.5 this is what it will look like: 25,390.5 (our last entry) - 24,000.50 = 1,390 points x $2.00 per point - $1.82 (commission and fees) = $2,778.18. Did we lose that? No way. We made sure our account could handle the margin required for that. The intraday margin requirement for 1 contract is $100.00 with NinjaTrader and the Initial Margin requirement, although it varies, is usually about $3,400.00.
What if the px does not get back up to 25,390.5 before roll-over? That is when you will take a loss. But you will have made so much profit in the meantime, that won't matter much.
What if the px never bounces but just keeps falling? If that is the case, you'll have much greater problems than $$$. It will be time to put your head between your legs and kiss your sweet ass good-bye.
If you conclude that the best time to start this plan with real $$$ is right after roll-over time, you would be right. That is one of the wonders of demo trading. Also, some practice will be most necessary for you to master the subtleties of this plan.
As always, thank-you for your time in reading this. Forgive any typos or math errors. For some strange reason this fellow doesn't always catch them in time. Stay tuned for further notes. Or shall we call them afterthoughts?
Target areas - NQ price for Market open.10/10/25 - These are the target areas - NQ price for Market open depending if price moves up or down. Will look for trades into these areas.

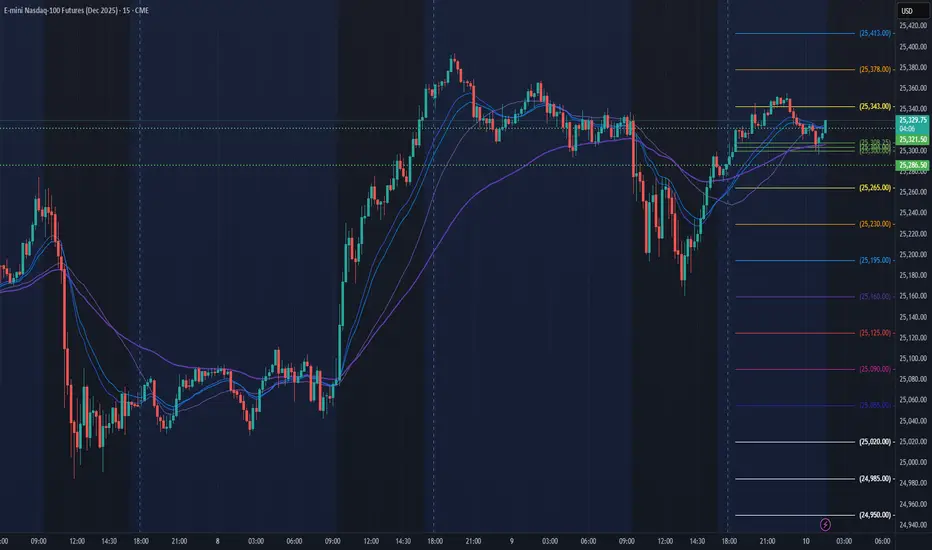
NASDAQ - LONG SETUPTechnical Context
The NASDAQ futures confirmed a breakout and acceptance above the previous H1 dealing range, maintaining strong bullish efficiency.
The breakout originated from the Aggressive Demand zone, aligned with the vPOC + VAL confluence (Deep Discount Demand), where strong positive delta initiated the impulse.
Price is now approaching the LVN (25,175–25,200) — an area that previously acted as imbalance and may now serve as support.
If the market retraces into this zone, it will test whether institutional buyers remain active within the prior demand structure.
Execution Plan
Bias: Long
Entry Zone 1: 25,175 – 25,200 (LVN retest)
Entry Zone 2: 25,000 – 25,030 (Deep Discount Demand – vPOC + VAL)
Take Profit 1: 25,365 (previous high)
Take Profit 2: 25,450 (extension target)
Trigger: Price compression and reaccumulation inside the demand zone
Technical Note
Entry should focus primarily on the LVN (25,175–25,200).
Compression analysis at this level must be handled carefully to confirm whether the movement represents true reaccumulation or passive absorption.
If price skips the LVN and retraces quickly toward the Deep Discount Demand (25,000–25,030), the setup becomes cleaner and easier to validate, as this zone holds the original impulse and stronger order flow.
At the moment, it remains uncertain whether the market will retrace or build a new value area above current levels, continuing the trend without a deeper pullback (>37.5%).
📅 Note: Friday’s NFP (Payroll) could trigger volatility and distort short-term efficiency.

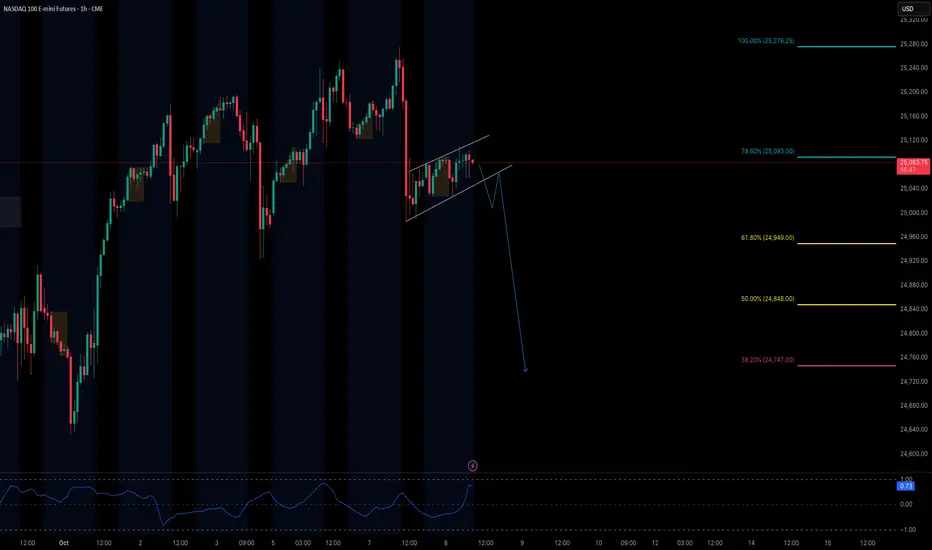
Could we potentially have another bearish day? We have no real market structure shift on the higher timeframe, and there are still plenty of PD arrays below that remain unvisited. Yesterday’s daily candle was also bearish!

NQ Power Range Report with FIB Ext - 10/10/2025 SessionCME_MINI:NQZ2025
- PR High: 25321.50
- PR Low: 25286.50
- NZ Spread: 78.5
Key scheduled economic events:
08:30 | Nonfarm Payrolls
- Average Hourly Earnings
- Unemployment Rate
Session Open Stats (As of 12:45 AM)
- Session Open ATR: 264.53
- Volume: 19K
- Open Int: 287K
- Trend Grade: Long
- From BA ATH: -0.2% (Rounded)
Key Levels (Rounded - Think of these as ranges)
- Long: 26020
- Mid: 23571
- Short: 21939
Keep in mind this is not speculation or a prediction. Only a report of the Power Range with Fib extensions for target hunting. Do your DD! You determine your risk tolerance. You are fully capable of making your own decisions.
BA: Back Adjusted
BuZ/BeZ: Bull Zone / Bear Zone
NZ: Neutral Zone
A Pawn for a KingFact or Fiction; Truth or Falsehood; 1+1 = 2 or 1+1 = ...-3, -2, -1, 0, 1, 2, 3...; Order or Chaos.
The chaos caused by an explosion is recreated using math, algebra and geometry, not the other way around.
We live in a mathematically designed universal. It only makes sense that a Trading Plan should use mathematical principles.
A Pawn for a King Trading Plan stands on such principles. I used it to trade this most recent run up.
I will use 2 contracts of MNQ to illustrate this plan, thereby making it accessible to more people.
The px bounced on a very strong Support - the pink line. I got in at 24,994.5. Again, using +2 contracts of MNQ as an example. Now here is where the plan (i.e. the math) gets interesting - I sold 1 contract @ 24,994. I used 21.5 points for each target. My first target was 25,016. I sold 2 contracts @ 25,015.5. I continued this mathematical pattern for the rest of the run up - that is I added 22 points to each entry of +2 contracts and to each entry of -2 contracts.
It will look like this:
24,994.5 +1; 24,994 -1
24,994.5 +1; 25,016 -1
25,016.5 +1; 25,016 -1
25,016.5 +1; 25,038 -1
25,038.5 +1; 25,038 -1
25,038.5 +1; 25,060 -1
25,060.5 +1; 25,060 -1
25,060.5 +1; 25,082 -1
And so on. The last 2 trades were -2 @ 25,390 and +2 @ 25,390.5. This left me 1L. Then the px pulled back. Using this example, you would have made $690.48 profit.
Now it gets very interesting. Compounding profits kick in. At 25,390 I sold 2 contracts. I always try to get about a 200-point pullback. It bounced at support 25,192.5 - a 197-point pullback. I bot back one of the -2 25,390 contracts. 197 points x 1 contract x $2.00 per point - Commission (.91 x 2) = $392.18 profit. Then I started the process all over again using the same pattern as listed above. It looks like this:
25,192.5 +1; 25,192 -1 this is the 1 contract I just made $392.18 profit on
25,192.5 +1; 25,192 -1
25,192.5 +1; 25,214 -1
25,214.5 +1; 25,214 -1
25,214.5 +1; 25,236 -1
25,214.5 +1; 25,236 -1
25,236.5 +1; 25,236 -1
25,236.5 +1;
25,236.5 +1;
This is where the trade stands right now. Profit so far on this leg: 21.5 points x 2 contracts x $2.00 per point - Commission (.91 x 4) = $82.36 x 2 = $164.72 profit
Total profit:
$690.48 + $392.18 + $164.72 = $1,247.38
I know this is a lot of detail and sounds confusing. Once you do this it will become very clear, and you will see the simplicity. I've given you enough detail so you can do it. Now I challenge you to demo trade it. It is very important that the first trade you enter is divisible by 2 and that the first sell order is .5 x that first entry quantity (i.e. .5 x 2) and slightly less. I make it $.50 less. If I made it $.25 less the chance of creating a wash trade would increase and I don't want to hear from the trade desk for doing so.
You will soon see that this plan grows profits exponentially.

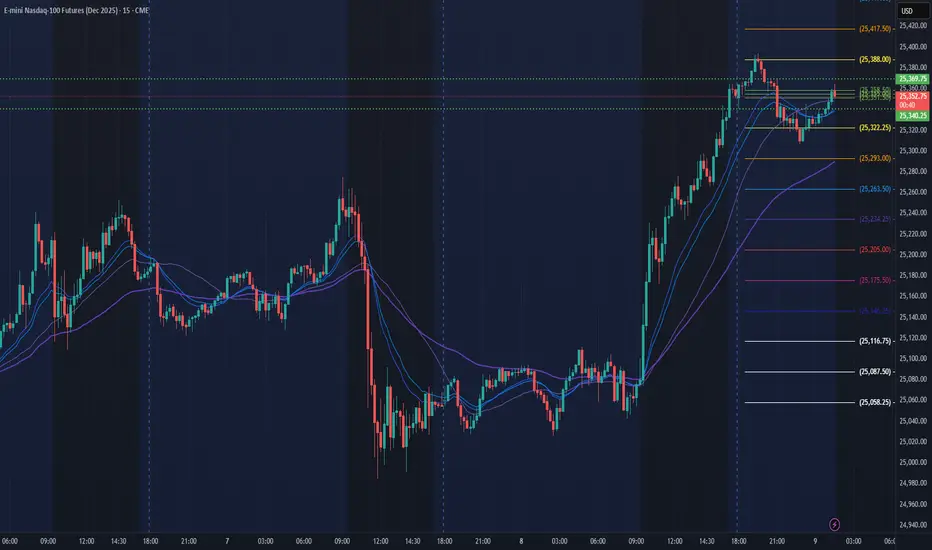
NQ Levels on this Thursday!As we begin the trading day on the Nasdaq 100 futures, I’m closely watching key structural levels that could set the tone for early momentum and intraday sentiment. The first area of interest is the overnight high, which often acts as an initial resistance zone where early buyers may hesitate or take profits. Above that, I’m monitoring the previous day’s high and any unfilled gap levels, as a clean break and hold above these could trigger a short-covering rally toward higher liquidity pools. On the downside, the overnight low and prior day’s value area low serve as immediate support, with a sustained break below opening the door for a deeper pullback toward the next volume node or demand zone. I’ll also pay attention to pre-market structure—whether we’re building acceptance within a range or showing directional imbalance—to gauge if the session is likely to develop into a trend day or rotational chop. Volume and order flow confirmation around these levels will ultimately dictate whether the Nasdaq 100 continues higher or retraces to test lower supports.

NQ Power Range Report with FIB Ext - 10/9/2025 SessionCME_MINI:NQZ2025
- PR High: 25369.50
- PR Low: 25340.50
- NZ Spread: 65.0
Key scheduled economic events:
08:30 | Initial Jobless Claims
- Fed Chair Powell Speaks
13:00 | 30-Year Bond Auction
Session Open Stats (As of 12:45 AM)
- Session Open ATR: 269.14
- Volume: 26K
- Open Int: 291K
- Trend Grade: Long
- From BA ATH: -0.2% (Rounded)
Key Levels (Rounded - Think of these as ranges)
- Long: 26020
- Mid: 23571
- Short: 21939
Keep in mind this is not speculation or a prediction. Only a report of the Power Range with Fib extensions for target hunting. Do your DD! You determine your risk tolerance. You are fully capable of making your own decisions.
BA: Back Adjusted
BuZ/BeZ: Bull Zone / Bear Zone
NZ: Neutral Zone
Location 15m NY Session 2 Oct 2025There are 3 setups based on a 15 minute structure on 2nd October 2025.
Location 1 :
- Structure breakout sell
Location 2 :
- Origin of structure breakout buy
Location 3 :
- Structure breakout buy

Location 15m NY Session 1 Oct 2025There is 1 setup based on a 15 minute structure on 15st October 2025.
Location 1 :
- Trend buy
- Structure breakout buy

Location 30m NY Session 1 Oct 2025There is 1 setup based on a 30 minute structure on 1st October 2025.
Location 1 :
- Trend buy
- Structure breakout buy

NQ 10/7Distribution is looking for support while shorts are planning their next move.
Will supporters in their long pants be influential enough to change the trend?
The daily (red) support under price is currently holding it up and price needs a 4hr BS or FS candle to continue to ladder up from.
If price falls to a 4hr (orange) trend, then price will need to create a 1hr support candle to ladder from, then can price break our of the 1hr distribution trend.
Will price deep dive the trend to the nearest support level though and then regain the trend? Some call that a liquidity trap. I would be concerned for that scenario since the chart suggests its possibility.
The shorts at top marked with the Inv BS and Inv FS levels look fairly clear but they are hourly levels (yellow) against a daily (red) or 4hr (orange) level which are stronger in timeframe/strength.

8 oct pushing uplooking for a long
entry in blue
target in green
stop in red.
all details are explained in the video.
Have fun
Elektra

Target areas - NQ price for Market open.10/8/25 - These are the target areas - NQ price for Market open depending if price moves up or down. Will look for trades into these areas.
idea on a chartWe have a great set up here a flag pattern.US stock futures marched higher on Wednesday as Wall Street waited for the latest Federal Reserve minutes to provide hints to future policy amid a shutdown-driven dearth of data.
Trading Secrets of the Global Market1. The Power of Liquidity: The Secret Pulse of Global Markets
Liquidity is the heartbeat of global trading. It determines how easily assets can be bought or sold without affecting prices dramatically. But here’s the secret — liquidity is often manufactured and manipulated by major institutions to create traps for smaller traders.
Large institutional players — like central banks, sovereign funds, and hedge funds — know that market liquidity hides in plain sight. They place massive orders in specific price zones to lure retail traders into believing that demand or supply is surging. Once small traders jump in, these giants reverse their positions, triggering stop losses and creating price whipsaws.
In forex and commodity markets, liquidity pockets are created intentionally to hunt for stop orders. The secret for smart traders? Follow liquidity, not emotions. Watch where volumes cluster, study order books, and track institutional footprints — not just price movements.
2. Volume Profile Analysis: Reading the Market’s Hidden Story
Volume Profile is one of the most underrated tools used by professional traders. It reveals where the most trading activity occurs — the zones where institutional traders are accumulating or distributing assets quietly.
Here’s the trick: price shows you what happened; volume shows you why it happened.
For instance, when price spikes on low volume, it’s often a false breakout. But when price consolidates on high volume, it signals smart money building positions.
Global trading desks use this insight to detect accumulation zones, identify breakout points, and plan trades with precision.
The secret? Retail traders often chase the breakout. Professionals wait for the retest of high-volume nodes — entering the market when the crowd has already been trapped.
3. The Currency Web: How Forex Controls Everything
The foreign exchange market (Forex) is the largest and most liquid market on the planet, with over $7.5 trillion traded daily. What few realize is that forex dictates the rhythm of global finance — from stock valuations to commodity prices and even real estate trends.
Major currencies like the USD, EUR, JPY, and GBP are influenced by interest rate differentials, trade balances, and geopolitical shifts. But beneath these fundamentals lies a secret: currency correlations.
For example:
When USD strengthens, commodities like gold and oil often decline.
When JPY rises, equity markets tend to fall due to its “safe haven” status.
Emerging market currencies often move opposite to U.S. Treasury yields.
Top traders exploit these interconnections — using one market’s movement to predict another’s. It’s a sophisticated form of global arbitrage, where understanding cross-asset relationships can generate enormous profits.
4. The Shadow of Algorithms: Trading in the Age of AI
In the 21st century, the real battle in trading is fought by machines. Over 70% of trades in developed markets are now executed by algorithms — automated systems that analyze data, detect inefficiencies, and act in microseconds.
The secret advantage of AI-driven trading lies in its ability to read market sentiment, news, and liquidity simultaneously — far faster than any human. But the flip side? These algorithms often trigger flash crashes or liquidity vacuums, catching human traders off guard.
Institutional players use high-frequency trading (HFT) to manipulate spreads, trigger retail orders, and profit from market micro-movements invisible to the naked eye.
For the smart trader, the lesson is simple: don’t fight the machines — learn from them. Use algorithm-friendly tools like volume heatmaps, tick charts, and market depth indicators to spot where these automated systems are most active.
5. Global Macro Secrets: The Big Money Mindset
While retail traders obsess over short-term charts, the world’s top hedge funds — like Bridgewater Associates or Renaissance Technologies — think macroeconomically.
They study:
Interest rate policies by central banks.
Commodity cycles tied to inflation.
Debt-to-GDP ratios of major economies.
Trade wars and sanctions impacting global supply chains.
The secret? Macro traders understand that markets don’t move in isolation. Every central bank announcement, oil price fluctuation, or political conflict creates ripple effects across all asset classes.
For instance:
Rising U.S. interest rates strengthen the dollar but hurt emerging market equities.
A spike in oil prices benefits energy exporters like Saudi Arabia but hurts importers like India or Japan.
Inflation data can move gold, bonds, and currency pairs simultaneously.
To trade globally, you must connect the dots across economies — not just across charts.
6. The Emotional Game: Psychology Behind Market Moves
Here’s one of the most guarded truths of trading — markets move on emotion, not logic.
Fear, greed, hope, and panic drive more trades than any technical pattern. The world’s top traders exploit this by understanding crowd psychology. When the masses panic, they buy; when the masses get euphoric, they sell.
Global trading floors call this the contrarian principle — “Be fearful when others are greedy and greedy when others are fearful.”
This secret plays out in every crisis: the 2008 crash, the COVID-19 dip, or the 2023 inflation scare. Those who maintained emotional discipline and followed data instead of sentiment often walked away with life-changing profits.
7. Central Banks: The Hidden Market Makers
No entity influences global markets more than central banks. Institutions like the U.S. Federal Reserve, the European Central Bank (ECB), and the Bank of Japan control liquidity flows, interest rates, and currency valuations.
The secret to understanding global trends is to track central bank actions — not their words.
When the Fed cuts rates, it fuels equity rallies worldwide. When it tightens liquidity, global capital retreats into safer assets like bonds or gold.
Professional traders follow these clues using the bond yield curve, repo market trends, and Federal Reserve balance sheet data.
In short: central bank policies shape the trading environment. The secret isn’t reacting to announcements — it’s anticipating them through macro signals.
8. Dark Pools: Where the Real Deals Happen
While most retail traders operate on public exchanges, big institutions trade in dark pools — private markets where large transactions occur anonymously to avoid price shocks.
These dark pools allow hedge funds to buy or sell billions worth of shares without alerting the public. It’s where real price discovery happens, long before retail traders see the effects on charts.
The secret? Volume anomalies on public exchanges often reflect dark pool activity. When prices move strongly without clear news or retail volume, it’s usually institutional repositioning behind the scenes.
9. Global Intermarket Relationships: The Secret of Smart Correlations
Global markets are deeply interconnected. A secret weapon for top traders is intermarket analysis — understanding how different asset classes influence each other.
Here’s how professionals decode these links:
Bonds vs. Equities: Rising bond yields usually mean falling stock prices.
Commodities vs. Currencies: Gold and oil tend to move opposite to the U.S. dollar.
Equities vs. VIX Index: When the volatility index (VIX) rises, stocks often drop.
By reading these relationships, global traders anticipate shifts before they appear on individual charts.
It’s not about predicting one market — it’s about seeing the ecosystem of money flow between them.
10. Risk Management: The Ultimate Secret of Longevity
Every successful trader — from George Soros to Ray Dalio — agrees on one truth: risk management is the foundation of all trading success.
You can have the best analysis, perfect timing, and deep market insight, but without proper risk control, one wrong move can wipe you out.
Global trading pros follow strict rules:
Never risk more than 1-2% of total capital per trade.
Use stop-loss orders religiously.
Diversify across asset classes and regions.
Measure correlation exposure — don’t be overexposed to one trend.
The secret to surviving in global markets isn’t making the biggest profits — it’s avoiding catastrophic losses.
11. Geopolitical Trading: When Politics Becomes Profit
War, elections, sanctions, and trade deals — these political moves shape global capital flows.
Savvy traders watch geopolitical triggers like hawks.
Examples:
Russia-Ukraine conflict: Sent energy prices soaring.
U.S.-China trade tensions: Moved technology and semiconductor stocks.
Middle East instability: Affects crude oil, defense stocks, and gold.
The secret is not reacting emotionally to political news — but identifying who benefits and who loses economically from these events.
12. The Long Game: How Patience Creates Power
The biggest myth in global trading is that success comes from fast trades. In reality, the most profitable traders think in years, not minutes.
They build strategies based on cycles — economic, credit, and liquidity cycles that repeat every few years. Understanding these patterns allows traders to buy undervalued assets early and sell near euphoric peaks.
Global wealth is built through strategic accumulation, not impulsive speculation.
Conclusion: Cracking the Code of the Global Market
The global market is a living organism — complex, unpredictable, and endlessly fascinating.
The secrets of successful trading aren’t mystical formulas or insider tips — they are disciplined habits, macro understanding, and emotional control.
To thrive, you must:
Follow liquidity and volume, not just price.
Think globally, not locally.
Manage risk like a professional.
Learn how economies, currencies, and emotions intertwine.
In a world where data moves faster than thought and algorithms trade faster than humans blink, the real edge lies in wisdom — understanding the forces beneath the surface.
Master these secrets, and you won’t just trade in the global market — you’ll understand its rhythm, predict its mood, and profit from its every pulse.
NQ Power Range Report with FIB Ext - 10/8/2025 SessionCME_MINI:NQZ2025
- PR High: 25083.25
- PR Low: 25054.50
- NZ Spread: 64.25
Key scheduled economic events:
13:00 | 10-Year Note Auction
15:00 | FOMC Meeting Minutes
Session Open Stats (As of 12:45 AM)
- Session Open ATR: 263.72
- Volume: 21K
- Open Int: 287K
- Trend Grade: Long
- From BA ATH: -0.9% (Rounded)
Key Levels (Rounded - Think of these as ranges)
- Long: 26020
- Mid: 23571
- Short: 21939
Keep in mind this is not speculation or a prediction. Only a report of the Power Range with Fib extensions for target hunting. Do your DD! You determine your risk tolerance. You are fully capable of making your own decisions.
BA: Back Adjusted
BuZ/BeZ: Bull Zone / Bear Zone
NZ: Neutral Zone
Another update NQUpdating this trade to replace MNQ trade as well. Same trade but on NQ instead> Updated the other trade
