Giving Back Profits - The Trap of 'Just One More'NOTE : This is a post on Mindset and emotion. It is NOT a Trade idea or strategy designed to make you money. If anything, I’m posting this to help you preserve your capital, energy and will so you can execute your own trading system with calm, patience and confidence.
The trouble doesn’t start wi
Related futures

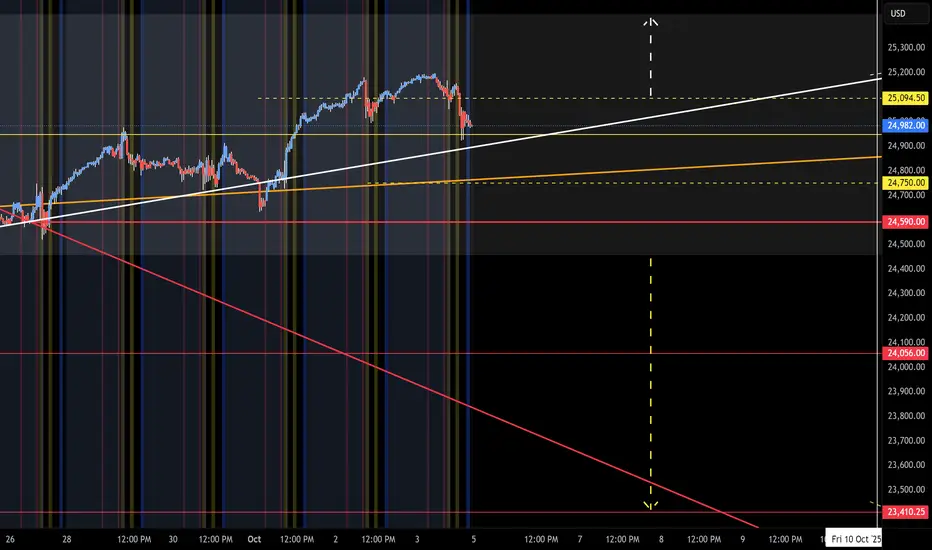
NQ Range (10-06-25, Week 2)Churning in the Churn Zone, back at Mid Level (ML) of range. Watch the 2 yellow dash levels, break to upper/lower churn range is redirect or counter move. Example, White arrow range play stall at 425 should reject to start or lower yellow arrow. Reverse that should NAZ drop to the start or yellow ar
NQ Range (10-13-25, Week 3)Week 2 of 7 week forecast did have a 4.85% /1,200 point drop, when? During the Reg Session. When did it lift back up or retrace 70% of the drop? The next Overnight Session. Friday the 10th had double the normal volume, broke of of the Churn Zone (top to bottom, move). We are now sitting at ML (mid l

NASDAQ 100 (NQ1!): Still Bullish! Wait For Valid Buys!Welcome back to the Weekly Forex Forecast for the week of Oct. 13 - 17th.
In this video, we will analyze the following FX market: NASDAQ (NQ1!) NAS100
The NASDAQ dumped last Friday with the Trump tariffs on China announcement. His latest tweet seems to have lowered the temperature on the tension

NQZ, FIBONNACCI STRATEGY ON HEIKEN-ASHI CANDLES (1 MIN)Once price retraced, I used fib and seen the retest off the levels. I wanted to enter right after the doji candle, but I got in this trade late and was okay with the SL i had. It definitely retested the 4H trendline after the big drop last week. I seen the indecision candlestick and knew it was more

Final sell off ahead of FOMC | Head n ShouldersI believe price will stage one final sell-off before resuming its push toward higher highs. On the 4H chart, a potential Head & Shoulders pattern is forming, suggesting price may fill the hourly gap at 24,856 before or during the FOMC release.
The 15-minute chart offers a more precise entry compa

LONG 1HOUR CHART - SL LOCAL LOWEntry long for 100 pips ... lets see.
SL LOCAL LOW
TP LOCAL TOP
SLM TRAILING

NQ UpdateI guess it doesn't matter that the gap below didn't fill all the way. Remaining gap is really small anyways.
MFI indicators seem to be working again, went overbought before market opened so the algos sold it off. Amazing how resilient this market is, they sold off everything (commodities, crypto

NQ Bias | October 15, 2025NQ perpective after mass liquidity sweep again. Correlation w/ other indices as well.

Back to ATHs? Inverse Head & Shoulders Imminent!I’m starting to get a strong sense that price won’t fill the new week opening imbalance at 24,336. The Inverse Head & Shoulders pattern I’ve been anticipating all week looks ready to form — and if it does, I believe it’ll propel us right back toward all-time highs.
If price rips through 24,724, thi

See all ideas
A representation of what an asset is worth today and what the market thinks it will be worth in the future.
Displays a symbol's price movements over previous years to identify recurring trends.
Frequently Asked Questions
The nearest expiration date for E-mini Nasdaq-100 Futures (Dec 2017) is Dec 15, 2017.
Traders prefer to sell futures contracts when they've already made money on the investment, but still have plenty of time left before the expiration date. Thus, many consider it a good option to sell E-mini Nasdaq-100 Futures (Dec 2017) before Dec 15, 2017.