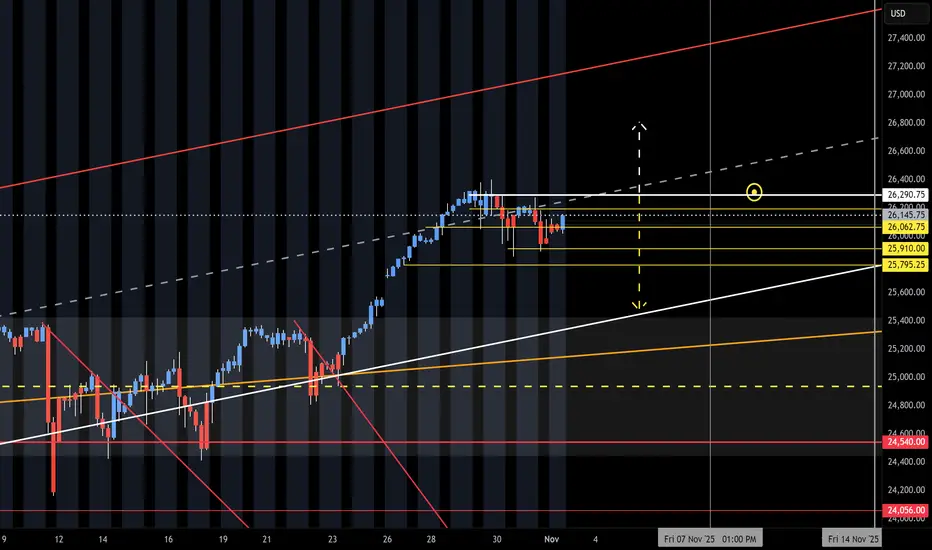
NQ Range (11-03-25, Week 6)The F-M Long move is on with new month and O/N Gap Open UP. Curveball form Friday Close and late head fake. Again, the NAZ will have to use the O/N to lift it back up. Need to see how the Open Drive and Reg Session reacts to the low volume O/N lift. Run up to upper target above KL 26,290 and Short
Related futures
Will History Repeat Itself? NASDAQ 2025 vs 2020The NASDAQ 100 is currently showing a striking structural symmetry to the 2020 pre-crash formation.
Both phases formed a 5-wave impulsive rally, followed by tight consolidation near highs — a typical distribution top pattern.
The 20-day EMA is starting to flatten, signaling a possible loss of mome

The Empty Feeling After A WinA trader messaged me recently after closing a big win.
He said, “I should’ve felt great but I just felt… flat.”
That sudden emptiness after the high it’s more common than you think.
Follow along. I hope this helps.
BUT FIRST
NOTE – This is a post on mindset and emotion. It’s not a trade idea

NQ Weekly Recap | November 2–7, 2025Hey everyone, this is the 1-hour chart. It shows the big picture of where price is going. We also use the 5-minute and 1-minute charts to find the exact spot to get in and put our stop loss nice and tight.This week NQ started around 26,400 and just kept falling, falling, falling… all the way down to

Nasdaq reversa 6-11-25Sellers were absorbed in that area, and the Nasdaq will likely reverse from this point in the coming days.
If it breaks through the supply zone, the trend could turn bullish in the next few days.

HOW TO TRADE THE LONG TERM TREND BY DRAWING TRENDLINES!Hey Traders so today wanted to make a quick video that explains how to trade the long term trend early. Also when to move your trendline to stay with the market for as long as possible in long term trends.
Hope This Helps Your Trading 😃
Clifford

NQ Range (11-10-25, Week 7)The 7 week Forecast is in the final week and we are up about 300 points after getting rejected at upper Target. NAZ back in the Churn Zone and did U Turn off Friday lows just under the Mid Level CZ. KL 483 is TZ to 25,333. Key fact is the NAZ and NDX are at long tern TL. Under the TL is Danger Zone

NQ UpdateI told everyone to stay bearish until the NQ gap fills. We're almost there, just a small gap left.
The big question is, does the TACO gap need to fill? 2 previous TACO gaps were left unfilled in the spring so I'm not sure. There is also a small gap above from yesterday afternoon.
If NQ breaks b

NASDAQ LongsLook for longs in Nasdaq once price either takes Sell side marked during 9:30 open and target Midnight open.
Price can also leave to the upside directly from here.

NQ = NAS100Elite Strategy
NASDAQ (MNQ/NQ) – Multi-Timeframe Analysis
Price tapped into the 45-minute imbalance inside a 4H premium zone. The overall structure remains bearish, and the reaction confirms sellers defending this level.
Expecting continuation toward 25,300 and possibly 25,000 as the next liquidity

See all ideas
Summarizing what the indicators are suggesting.
Neutral
SellBuy
Strong sellStrong buy
Strong sellSellNeutralBuyStrong buy
Neutral
SellBuy
Strong sellStrong buy
Strong sellSellNeutralBuyStrong buy
Neutral
SellBuy
Strong sellStrong buy
Strong sellSellNeutralBuyStrong buy
A representation of what an asset is worth today and what the market thinks it will be worth in the future.
Frequently Asked Questions
The current price of E-mini Nasdaq-100 Futures (Dec 2030) is 30,240.00 USD — it has risen 1.85% in the past 24 hours. Watch E-mini Nasdaq-100 Futures (Dec 2030) price in more detail on the chart.
Track more important stats on the E-mini Nasdaq-100 Futures (Dec 2030) chart.
The nearest expiration date for E-mini Nasdaq-100 Futures (Dec 2030) is Dec 20, 2030.
Traders prefer to sell futures contracts when they've already made money on the investment, but still have plenty of time left before the expiration date. Thus, many consider it a good option to sell E-mini Nasdaq-100 Futures (Dec 2030) before Dec 20, 2030.
Buying or selling futures contracts depends on many factors: season, underlying commodity, your own trading strategy. So mostly it's up to you, but if you look for some certain calculations to take into account, you can study technical analysis for E-mini Nasdaq-100 Futures (Dec 2030). Today its technical rating is buy, but remember that market conditions change all the time, so it's always crucial to do your own research. See more of E-mini Nasdaq-100 Futures (Dec 2030) technicals for a more comprehensive analysis.