NQ Targets (09-29-25 Week 1)Add on to Published "7 week Post". This week's Churn Zone. Will update daily with any calls, as usual. Other Post is just bigger picture of forecast.
GoFED, BTD/FOMO with captain Tweety.
NQH2020 trade ideas

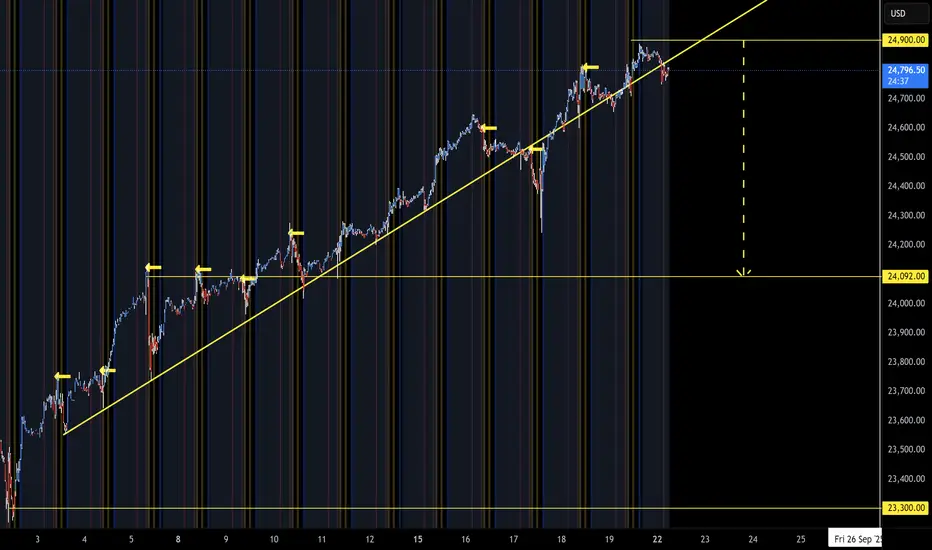
NQ Targets (09-22-25)NAZ with Friday-Monday O/N breakdown into Monday Open Drive (looking for Open Dive today). 24,900 is KL, Long above Short Scalp below to drop target test below.
4HR below with Blue YTD open level.
A Bullish Friday for NasdaqNow that support has been reached, I’m anticipating Nasdaq to resume its bull run. During the AM session, I’ll be watching for either a double bottom or an inverse head-and-shoulders pattern to form.
On the daily chart, I’m anticipating a rejection from the 24,600 Daily FVG.
It may be too early to confirm, so I’ll revisit and update this idea in the morning.
Lets go Long⚡

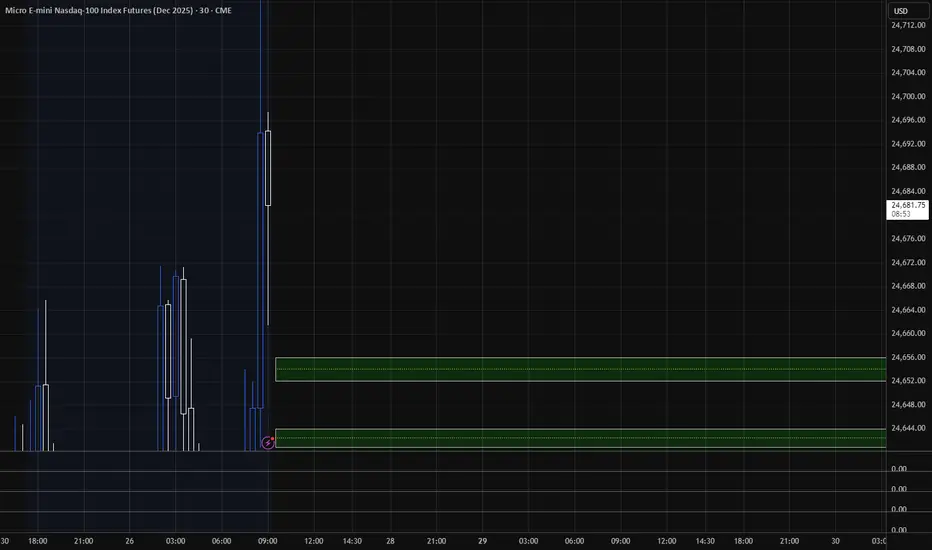
Target areas - NQ price for Market open.9/26/25 These are the target areas - NQ price for Market open depending if price moves up or down. Will look for trades into these areas.
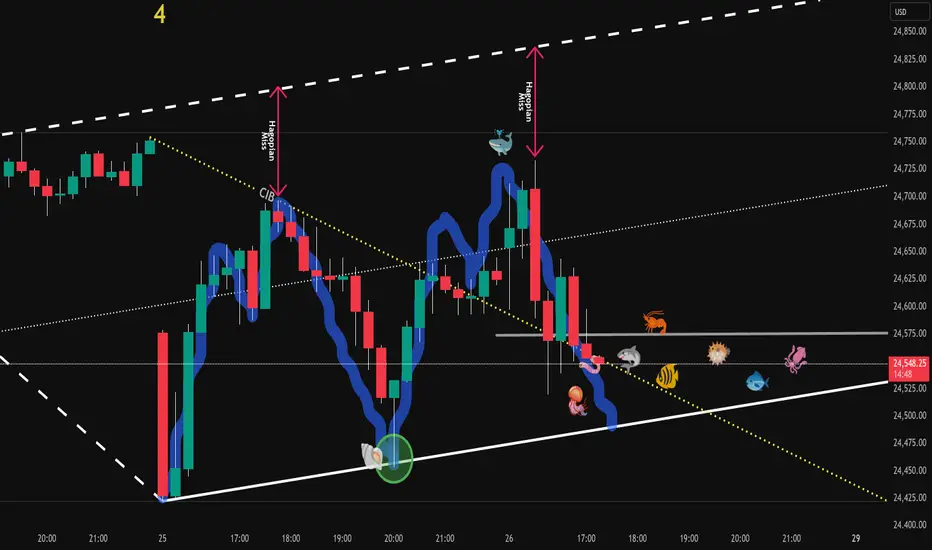
NQ is twitching the worm - Don't take the bait🎣 Don’t take the bait! 🎣
Just sitting here, watching my pre-market setup.
Now I can see them twitching the worm, trying to lure me in.
NOPE!
This price action’s way too twitchy for me. §8-)
This Chart is a RTH with "Gap-Attached" and gives a perfect catch of the first drop.
So, just casually watching...maybe I can learn even more...
🐟🐠🐡🐟🐠🐡🐟🐠🐡🐟🐠🐡🐟🐠🐡🐟🐠🐡🐟🐠🐡
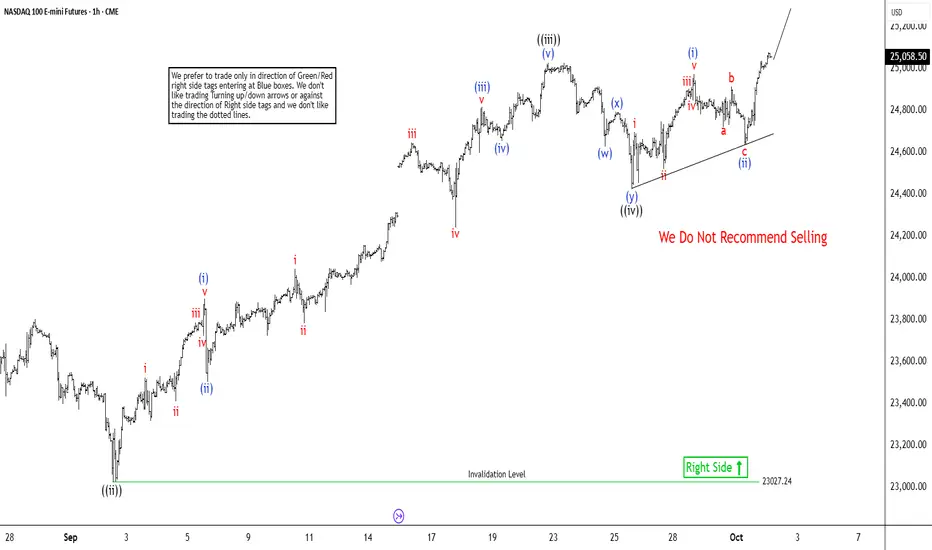
Nasdaq (NQ) on Track for Higher Wave 5 FinishThe short-term Elliott Wave analysis for the Nasdaq (NQ) reveals a bullish cycle initiated from the August 2, 2025, low, progressing as a five-wave impulse structure. Wave ((i)) surged to 24,068.5. The corrective wave ((ii)) concluded at 23,025.25, as depicted in the one-hour chart. The Index then advanced in wave ((iii)) to 25,027.25. This wave developed as an impulse in a lesser degree, showcasing robust bullish momentum in the market.
From the wave ((ii)) low, wave (i) climbed to 23,902. A brief dip in wave (ii) stabilized at 23,505. Wave (iii) rallied to 24,816. A minor pullback in wave (iv) ended at 24,655. The final leg, wave (v), reached 25,027.25, completing wave ((iii)) in the higher degree. The subsequent wave ((iv)) correction unfolded as a double-three Elliott Wave structure, a common pattern in such cycles. From wave ((iii)), wave (w) declined to 24,627. Wave (x) recovered to 24,793.50. Wave (y) then dropped to 24,422.5, finalizing wave ((iv)).
As long as the pivotal low at 23,027.2 remains intact, the Index is expected to extend higher in wave ((v)). This outlook supports continued upside in the near term, consistent with the impulsive structure’s progression and market dynamics.
NQ Targets (09-29-25)Moving into October, 7 week range forecast. Basically, 23,050 is 50% retracement of YTD lift. Looking for a retest of that, no hold and keep going to the YTD Open or circle below (yellow arrow path). White arrow path has two targets, these are potential drop/rejection zones (to yellow arrow path). KL 24,950 is ML of TZ, we have played in lower half and may see some play in upper half. Sideways to lower during this 7 week period is the idea.

Target areas - NQ price for Market open.10/1/25 - These are the target areas - NQ price for Market open depending if price moves up or down. Will look for trades into these areas.
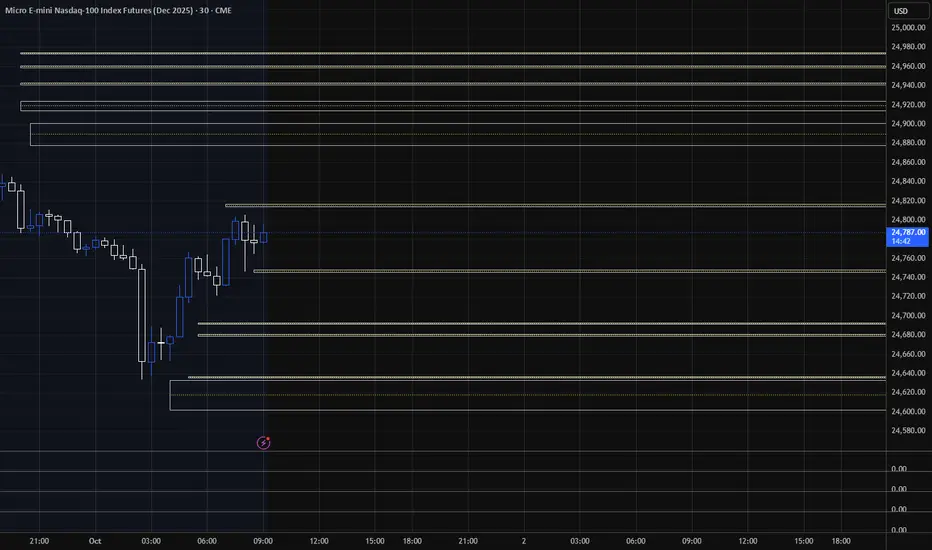

Short Trade Idea for 9/30 | NQI’m anticipating price to either push into the 1H bearish imbalance at 24,894 or reject from the NWOG around the 24,856 range before turning lower toward the 24,640.00 range. My bias is firmly short for now — but I’ll reassess as we approach the open.

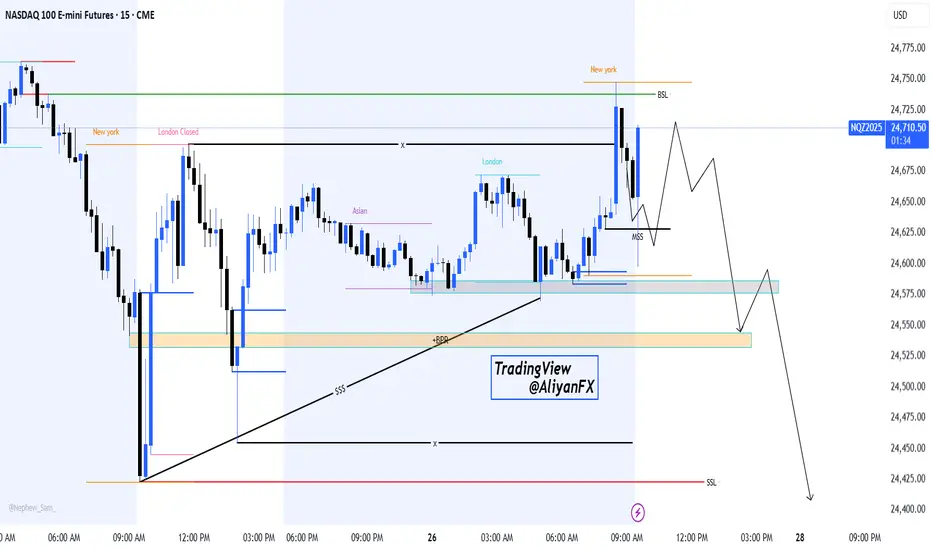
NASDAQ 100 – Potential Liquidity Grab & Bearish Continuation SetHello Billionaires!!
We All know that the Price has swept the New York session high (BSL) and is now showing signs of a potential market structure shift (MSS). If the short-term pullback holds, we may see a deeper retracement toward the demand zone (BPR + Asian range) before another leg down.
🔹Key Levels to Watch:
24,725 – 24,750: Liquidity grab zone (recent NY high)
24,575 – 24,550: Re-test area for possible continuation
24,500 – 24,450: Next downside target if bearish momentum continues
Bias: Short-term retracement followed by potential bearish continuation toward lower liquidity pools (SSL).
📌 This is an educational projection, not financial advice. Trade safe and always manage your risk!
Nasdaq Buy idea Based on previous data Nasdaq should expect a push upwards. I’ve marked charts with reasoning and added SL and TP levels. Good luck

Nasdaq to 25,300? | Long Idea 10/3I believe Nasdaq still has room to climb, with the 25,300 range in sight to finish off the week. The price action closely mirrors the pattern from September 5th–9th, 2025, and I wouldn’t be surprised to see history repeat itself here.
I’m planning to go long from the 25,105 imbalance, holding through all-time highs and into the void through 25,300. Once ATHs are broken, I’ll trail my stop closely to lock in profits.

Long trade
Trade Journal Entry
Pair: MNQ1! (Micro E-mini Nasdaq-100 Futures)
Trade Type: Buy-side trade
Date: Wed, 1st Oct 2025
Time: 6:00 am
Session: London Session AM
Trade Details
Entry: 24,765.00
Profit Level (TP): 25,408.50 (+2.59%)
Stop Level (SL): 24,631.50 (-0.54%)
Risk-to-Reward (RR): 3.62
Market Structure & Context
Trend: Strong bullish continuation with higher highs and higher lows.
Fib Levels: Entry aligns closely with 0.618 retracement of the prior impulse (24,765).
Support Zone: EMA + structure overlap provided strong confluence for bullish continuation.
Imbalances: Fair Value Gaps (FVGs) below have been partially filled, and the market shifted back to bullish order flow. Volume: Consistent increase on bullish expansions, supporting continuation narrative.
1Hr TF overview
Narrative (Wyckoff / SMC)
Accumulation: Market held demand zone between 23,800–24,000 before breaking structure upward. Markup Phase: The SA series of higher swing highs confirmed bullish order flow.
Entry Justification: Entry at 24,765 aligned with retracement into support/FVG.
Liquidity Draw: Overhead liquidity resting near 25,250–25,400, aligning with Fibonacci 1.618 extension (25,248). Stop Placement: Below retracement low at 24,631 to protect against false breakdown.
Key Levels
Entry Zone: 24,760–24,770
Stop: 24,631
Intermediate Targets: 25,100 / 25,250
Final Target: 25,408
Action Plan
Secure partials at 25,100 (previous high).
Let the remaining position run toward the 25,408 liquidity pool.
If momentum accelerates, trail stop into break-even + profit lock once 25,100 clears.

Target areas - NQ price for Market open.9/29/25 These are the target areas - NQ price for Market open depending if price moves up or down. Will look for trades into these areas.

ES1 & NQ1 Daily Trade Setups 2/10/25IN this update we review th erecent price action in Sp500 & Nasdaq futures contracts and identify the next high probability trade setups and price opbjectives to tatrget. To review today's video analysis click below!

Global Financial Markets and Their Structure1. Overview of Global Financial Markets
Financial markets can be broadly defined as platforms where financial instruments are traded between buyers and sellers. They can be categorized based on:
Type of instruments traded – equities, bonds, currencies, derivatives, commodities, and digital assets.
Maturity of instruments – money markets (short-term) and capital markets (long-term).
Trading mechanism – exchange-traded markets and over-the-counter (OTC) markets.
Geographical scope – domestic markets and international markets.
Globally, financial markets operate continuously, interconnected through electronic trading platforms and international financial institutions. The growth of globalization, financial liberalization, and technological innovation has significantly expanded the depth, liquidity, and efficiency of these markets.
2. Types of Global Financial Markets
2.1 Capital Markets
Capital markets are platforms for long-term funding where securities with maturities of more than one year are traded. They include:
Equity Markets: Where shares of publicly listed companies are issued and traded. Examples include the New York Stock Exchange (NYSE), London Stock Exchange (LSE), and Tokyo Stock Exchange (TSE). Equity markets facilitate capital raising for companies and provide investors an opportunity to participate in corporate growth.
Debt Markets (Bond Markets): Where government, corporate, and municipal bonds are issued and traded. Bond markets are crucial for governments to finance infrastructure projects and for corporations to raise long-term funds. Major debt markets include the U.S. Treasury market, Eurobond market, and corporate bond markets in Europe and Asia.
2.2 Money Markets
Money markets deal in short-term debt instruments, usually with maturities of less than one year. They provide liquidity and fund management solutions for governments, financial institutions, and corporations. Instruments include:
Treasury bills
Commercial paper
Certificates of deposit
Repurchase agreements
The money market is critical for maintaining liquidity and controlling short-term interest rates in the global economy.
2.3 Foreign Exchange (Forex) Markets
Forex markets are the largest financial markets globally, with an average daily turnover exceeding $7 trillion. They enable the trading of currencies for international trade, investment, speculation, and hedging. Forex markets operate 24 hours due to time zone differences across London, New York, Tokyo, and Sydney.
Major participants include central banks, commercial banks, hedge funds, multinational corporations, and retail traders. The forex market significantly influences global trade balances, monetary policy, and capital flows.
2.4 Derivatives Markets
Derivatives markets facilitate trading of contracts whose value is derived from an underlying asset. Common derivatives include:
Futures
Options
Swaps
Forwards
Derivatives are used for hedging, speculation, and arbitrage. Key markets include the Chicago Mercantile Exchange (CME), Eurex in Europe, and the Dubai Mercantile Exchange. Derivatives markets play a crucial role in risk management but also introduce systemic risks if leveraged excessively.
2.5 Commodity Markets
Commodity markets deal with the trading of raw materials like oil, gold, metals, agricultural products, and energy resources. They are classified as:
Physical Markets: For actual delivery of commodities.
Futures Markets: For trading standardized contracts with future delivery dates.
Major commodity exchanges include the London Metal Exchange (LME), Chicago Board of Trade (CBOT), and Multi Commodity Exchange of India (MCX). Commodity markets are vital for price discovery, risk management, and hedging against inflation.
2.6 Digital and Crypto-Asset Markets
The rise of blockchain technology has given birth to digital asset markets, including cryptocurrencies, stablecoins, and central bank digital currencies (CBDCs). These markets offer decentralized financial solutions, new investment opportunities, and cross-border payment efficiencies. Exchanges like Coinbase, Binance, and Kraken operate globally, while central banks experiment with digital currencies to improve payment systems and monetary policy implementation.
3. Key Participants in Global Financial Markets
3.1 Institutional Investors
Institutional investors include mutual funds, hedge funds, insurance companies, pension funds, and sovereign wealth funds. They are major drivers of capital flows and market liquidity. Their strategies often involve asset allocation, risk management, and long-term investment horizon.
3.2 Retail Investors
Retail investors are individual participants who invest in stocks, bonds, mutual funds, and other securities. They represent a significant portion of market activity, especially in developed economies with well-established broker networks and electronic trading platforms.
3.3 Corporations
Corporations participate as issuers of equity and debt instruments, seeking funding for expansion, research, and capital projects. They also engage in currency hedging, commodity contracts, and derivative trading to manage operational and financial risks.
3.4 Governments and Central Banks
Governments issue sovereign bonds to fund fiscal deficits and infrastructure projects. Central banks control monetary policy, manage interest rates, stabilize currency values, and intervene in foreign exchange markets to influence capital flows and inflation.
3.5 Intermediaries
Banks, brokers, dealers, and market makers facilitate transactions, provide liquidity, and offer advisory services. Investment banks play a critical role in underwriting, mergers and acquisitions, and structuring complex financial instruments.
4. Structure of Global Financial Markets
The structure of global financial markets can be examined through market segmentation, interconnectedness, and regulatory frameworks.
4.1 Primary and Secondary Markets
Primary Market: Where new securities are issued for the first time, such as IPOs and bond issuances. Capital raised in primary markets finances business expansion and government projects.
Secondary Market: Where existing securities are traded between investors. Secondary markets provide liquidity, facilitate price discovery, and help determine the cost of capital.
4.2 Exchange-Traded vs Over-the-Counter Markets
Exchange-Traded Markets: Transactions occur on regulated exchanges with standardized contracts and transparency (e.g., NYSE, CME).
OTC Markets: Trades are bilateral agreements between parties, often customized and less transparent (e.g., forex forwards, swaps).
4.3 Segmentation by Geography and Time Zone
Global financial markets are interconnected across regions:
Asia-Pacific Markets: Tokyo, Shanghai, Hong Kong, Singapore, and Sydney.
European Markets: London, Frankfurt, Paris, and Zurich.
Americas Markets: New York, Toronto, and Chicago.
Time zone differences create continuous trading opportunities, but also pose risks of volatility spillovers and information asymmetry.
4.4 Market Integration
Integration occurs through capital mobility, cross-border investment, and harmonized regulations. Fully integrated markets enable diversification, lower cost of capital, and efficient resource allocation. Partial integration often results in fragmented liquidity and regional discrepancies in pricing.
5. Instruments Traded in Global Financial Markets
5.1 Equity Instruments
Equities provide ownership in companies and the right to dividends. They are traded on stock exchanges or OTC platforms. Variants include:
Common stock
Preferred stock
Depository receipts (e.g., ADRs, GDRs)
5.2 Debt Instruments
Debt instruments provide fixed or floating returns to investors. They include:
Government securities (treasuries, gilts)
Corporate bonds
Municipal bonds
Floating rate notes
5.3 Derivatives Instruments
Derivatives derive value from underlying assets and are used for hedging or speculation. Types include:
Futures contracts
Options contracts
Swaps (interest rate, currency, credit)
Forwards
5.4 Hybrid Instruments
Hybrid instruments combine features of debt and equity, such as convertible bonds, preferred shares, and structured notes. They offer flexibility in risk and return profiles for investors.
5.5 Alternative Instruments
Alternative instruments include commodities, real estate investment trusts (REITs), private equity, venture capital, and digital assets. These instruments enhance portfolio diversification and risk management.
6. Functions of Global Financial Markets
Financial markets perform several critical functions:
Capital Allocation: Efficiently channel funds from savers to borrowers for productive investment.
Price Discovery: Determine fair prices of financial instruments through supply and demand dynamics.
Liquidity Provision: Allow participants to buy or sell assets quickly without significantly impacting prices.
Risk Management: Provide tools like derivatives to hedge against market, credit, and currency risks.
Information Dissemination: Reflect economic, corporate, and geopolitical information in prices.
Economic Growth Support: Facilitate investment in infrastructure, innovation, and industry expansion.
7. Regulation of Global Financial Markets
Regulation ensures stability, transparency, and investor protection. Key regulatory frameworks include:
United States: Securities and Exchange Commission (SEC), Commodity Futures Trading Commission (CFTC), Federal Reserve.
Europe: European Securities and Markets Authority (ESMA), national regulators like FCA (UK), BaFin (Germany).
Asia-Pacific: Securities and Exchange Board of India (SEBI), China Securities Regulatory Commission (CSRC), Monetary Authority of Singapore (MAS).
Regulation covers market conduct, disclosure requirements, capital adequacy, trading limits, anti-money laundering, and risk management. Cross-border coordination is vital due to globalization of financial markets.
8. Trends and Innovations
8.1 Technological Advancements
Algorithmic and High-Frequency Trading (HFT): Use of automated systems to execute trades at microsecond speeds.
Blockchain and Distributed Ledger Technology: Facilitate transparent, secure, and decentralized transactions.
Robo-Advisors: Automated investment advisory platforms improving accessibility for retail investors.
8.2 Globalization and Integration
Capital flows across borders, with emerging markets increasingly participating in global investment. Financial integration allows diversification but increases vulnerability to external shocks.
8.3 Sustainable and ESG Investing
Environmental, Social, and Governance (ESG) factors are increasingly incorporated in investment strategies, impacting capital allocation and corporate behavior.
8.4 Digital Currencies
CBDCs and cryptocurrencies are transforming cross-border payments, monetary policy transmission, and investment opportunities.
9. Challenges in Global Financial Markets
Volatility and Systemic Risk: Interconnectedness can transmit shocks rapidly across borders.
Regulatory Arbitrage: Firms may exploit differences in national regulations.
Cybersecurity Threats: Digitalization exposes markets to hacking and fraud.
Liquidity Mismatches: Especially in emerging markets or during crises.
Currency and Interest Rate Risks: Global flows are affected by exchange rate fluctuations and monetary policy divergence.
10. Importance for Investors, Traders, and Policymakers
10.1 Investors
Understanding market structure helps in portfolio diversification, risk management, and strategic allocation of capital across geographies and asset classes.
10.2 Traders
Market structure knowledge is critical for developing trading strategies, exploiting arbitrage opportunities, and managing intraday and long-term market risks.
10.3 Policymakers
Insights into market behavior, liquidity conditions, and capital flows assist in macroeconomic policy, regulation, and crisis management.
Conclusion
Global financial markets are the lifeblood of the modern economy. Their structure is vast and multi-layered, encompassing diverse instruments, participants, and functions. Efficient, transparent, and integrated markets enhance economic growth, facilitate investment, and support risk management. At the same time, challenges such as systemic risk, regulatory complexity, and technological disruption demand vigilance from all participants.
For investors, traders, and policymakers, understanding the structure and functioning of these markets is essential to navigate global capital flows, identify opportunities, and mitigate risks. As markets evolve with technology, sustainability concerns, and financial innovation, continuous learning and adaptation are key to thriving in this dynamic global financial ecosystem.
NQ Long I know it may sound a bit unusual to long with too much blood on the streets, but given the current conditions, as long as we are not trading below 24K, taking a long position remains the most logical option for me.
This long setup becomes invalid if price fails to follow the exact path I outlined in the green drawing. If price does not break above the yellow trendline, then a continuation to the downside remains the more likely scenario.


NQ 9/30Weekly timeframe high low and median range boxed in grey
the daily high, low and median range from yesterday is boxed in red
orange levels are 4hr timeframe
yellow are 1hr timeframe
blue are 15min timeframe levels

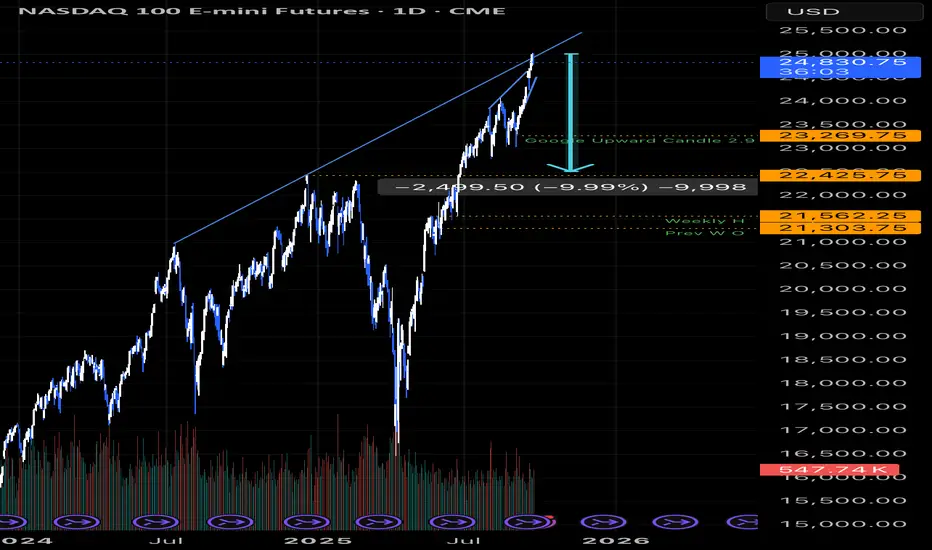
It‘s about Time… SHORT till NovemberTime to switch lanes
- upper trendline rejection
- sell pressure is building (build your shorts)
NQ - 9/26Alright, I think there is value to keeping the same T.A. as yesterday then updating the T.A. as each day goes so that I'll be more motivated to write out the MarketMeta better.
These are journals but I understand others want to understand the candle science of ranges and the 4 candles and 6 levels they create. It took me a long time to comprehend it as I studied the courses from C0TT0NC4NDYTA.
StudyGuideTA is the simplified version - AKA my personal notes and understanding using his definitions or "Science" of trading.
Yesterday's levels were tested and changed to dotted lines. Thick 2x yellow level Inv.BS evolved its role to a "bridge" - This is like the polarity point where levels is acting as resistance but then will act as support as price crosses and closes above it.

NQ - Week 39Should have posted this yesterday.
oh well
Color coded from the top down
grey - week
orange 4hr
yellow = 1 hr
blue - 15min
