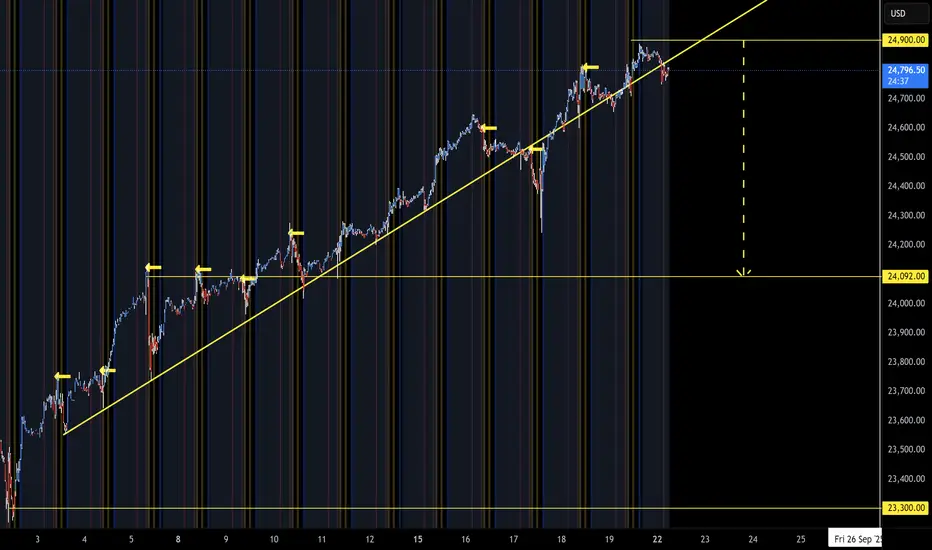
NQ Targets (09-22-25)NAZ with Friday-Monday O/N breakdown into Monday Open Drive (looking for Open Dive today). 24,900 is KL, Long above Short Scalp below to drop target test below.
4HR below with Blue YTD open level.
NQM2022 trade ideas
A Bullish Friday for NasdaqNow that support has been reached, I’m anticipating Nasdaq to resume its bull run. During the AM session, I’ll be watching for either a double bottom or an inverse head-and-shoulders pattern to form.
On the daily chart, I’m anticipating a rejection from the 24,600 Daily FVG.
It may be too early to confirm, so I’ll revisit and update this idea in the morning.
Lets go Long⚡

NASDAQ 100 (NQ1!): Bullish! Wait For The Pullback, Then Buy ItWelcome back to the Weekly Forex Forecast for the week of Sept 22 - 26th.
In this video, we will analyze the following FX market: NASDAQ (NQ1!) NAS100
The NASDAQ is bullish. Let the market pullback to the +FVG (Internal Range Liquidity) a +FVG, and look for valid long setups on the lower timeframes.
Should the -FVG fail, then wait until it moves to a lower +FVG that will act as support. I do not recommend shorting this market until there is a clear bearish BOS.
Enjoy!
May profits be upon you.
Leave any questions or comments in the comment section.
I appreciate any feedback from my viewers!
Like and/or subscribe if you want more accurate analysis.
Thank you so much!
Disclaimer:
I do not provide personal investment advice and I am not a qualified licensed investment advisor.
All information found here, including any ideas, opinions, views, predictions, forecasts, commentaries, suggestions, expressed or implied herein, are for informational, entertainment or educational purposes only and should not be construed as personal investment advice. While the information provided is believed to be accurate, it may include errors or inaccuracies.
I will not and cannot be held liable for any actions you take as a result of anything you read here.
Conduct your own due diligence, or consult a licensed financial advisor or broker before making any and all investment decisions. Any investments, trades, speculations, or decisions made on the basis of any information found on this channel, expressed or implied herein, are committed at your own risk, financial or otherwise.

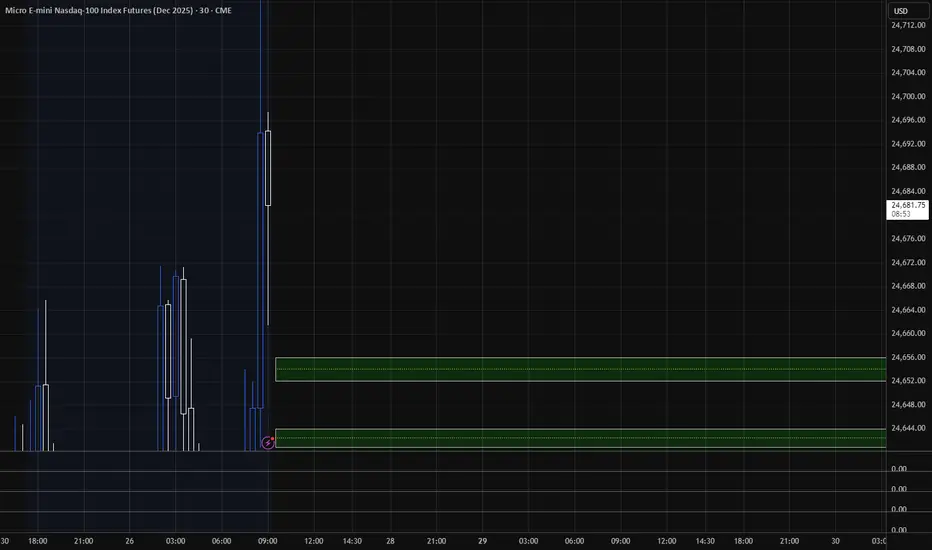
Target areas - NQ price for Market open.9/26/25 These are the target areas - NQ price for Market open depending if price moves up or down. Will look for trades into these areas.
NQ - Nasdaq Is Coming For Your Stop!OK, there's not much to say.
That guy looks bad. I mean, really bad §8-)
Let's see if we can use the bad mood for a nice short down to the bottom.
Ohhhh Myyyy.....

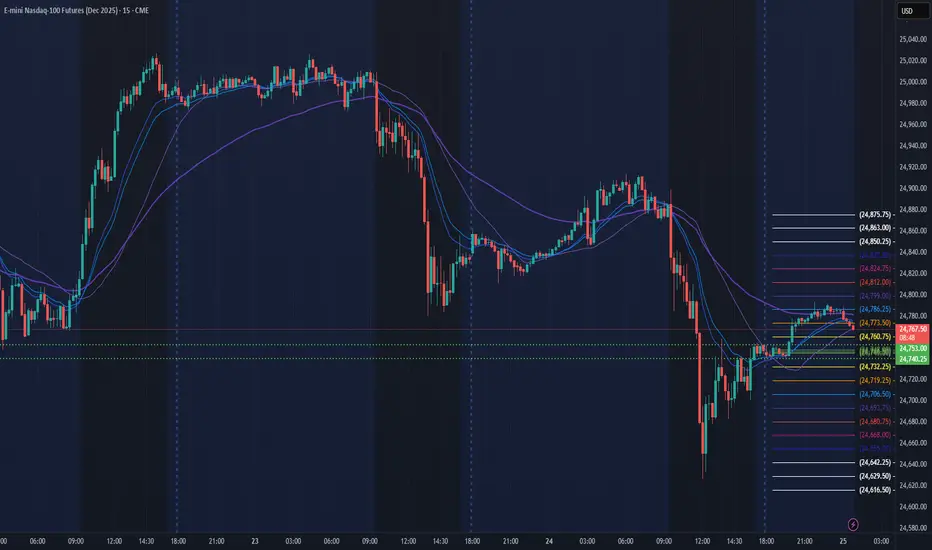
SELLBearish Order Block (Supply Zone):
Price rejected strongly from the supply zone marked between ~$24,770–$24,820.
Large wicks and volume spike indicate heavy selling pressure from this zone.
Break and Retest:
Price previously broke below a support level (~$24,780), then retested that zone before selling off again.
This confirms the zone has flipped from support → resistance.
Volume Confirmation:
High sell volume bars on rejection confirm institutional selling.
Follow-through candle closed below the support-retest level.
Market Structure:
Lower highs and lower lows forming, indicating short-term bearish trend continuation.

NQ is twitching the worm - Don't take the bait🎣 Don’t take the bait! 🎣
Just sitting here, watching my pre-market setup.
Now I can see them twitching the worm, trying to lure me in.
NOPE!
This price action’s way too twitchy for me. §8-)
This Chart is a RTH with "Gap-Attached" and gives a perfect catch of the first drop.
So, just casually watching...maybe I can learn even more...
🐟🐠🐡🐟🐠🐡🐟🐠🐡🐟🐠🐡🐟🐠🐡🐟🐠🐡🐟🐠🐡
Buy the Dip in all its GloryWait for the Bounce.
The GDP just came in. 2nd qtr. growth 3.8%. A fabulous number. The Fed keeps saying 1.8% is normal. To hell with normal! To hell with the Fed's model!
Trump's growth policies are working.
Why are the markets down?
Earnings are the Mother's Milk of growth. Earnings have been soaring.
Inflation concerns are rising.
Are we waiting for tomorrow's PCE inflation report?
This thing will bounce to new highs.
Bond rates creeped up this morning - bad for the markets. To hell with handwringers! Barring Armageddon, this market is going up.

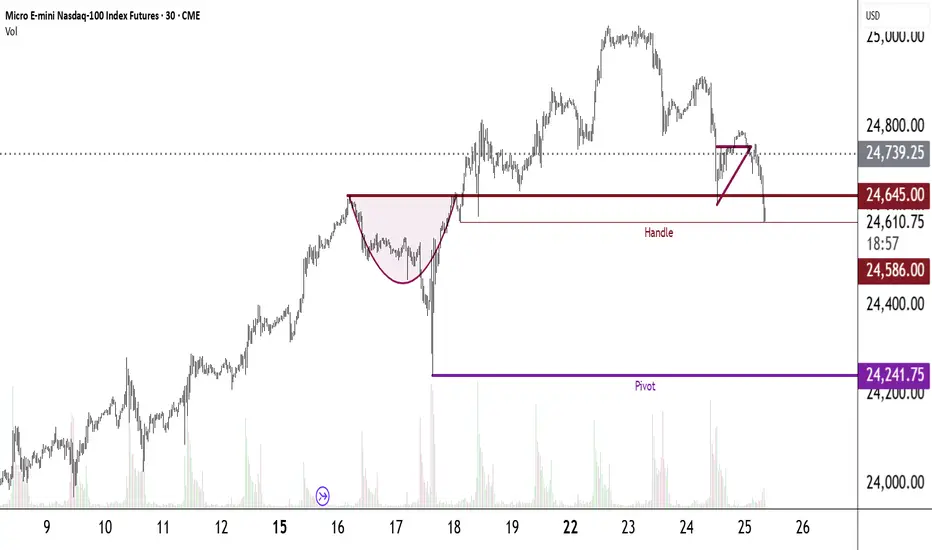
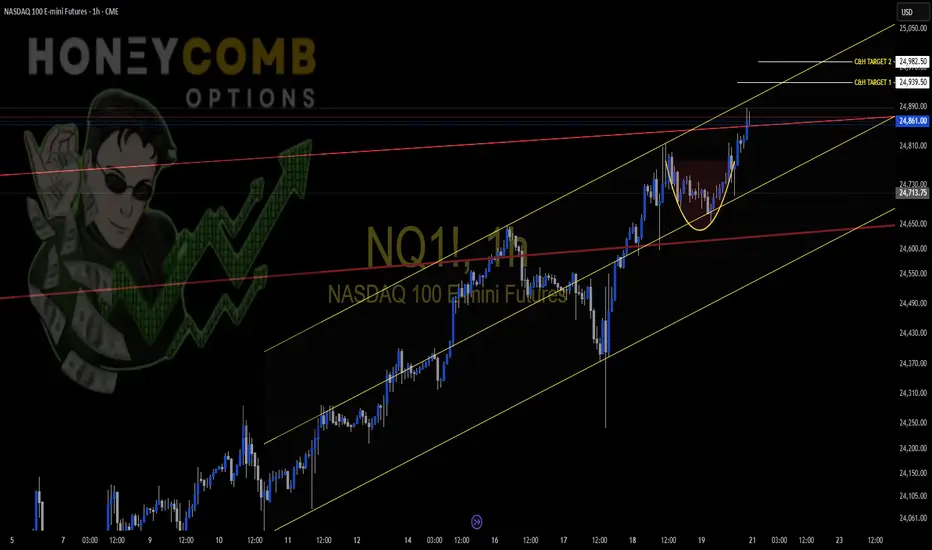
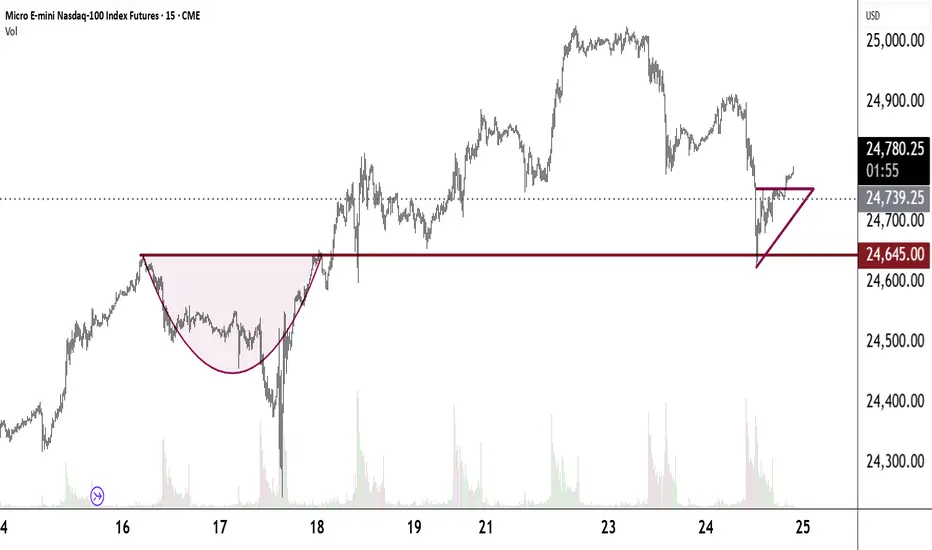
Inflation Data & SupportWe are at the low of the handle on this magnificent cup and handle pattern. The Big Question will it hold?
GDP estimate and other important news out Thursday, 9/25 08:30:00 NY time.
PCE out Friday, 9/26 08:30:00 NY time.
Both will be market movers. We will retrace to new highs. Are you ready to ride the waves?
NQ Power Range Report with FIB Ext - 9/25/2025 SessionCME_MINI:NQZ2025
- PR High: 24753.00
- PR Low: 24740.00
- NZ Spread: 29.0
Key scheduled economic events:
08:30 | Initial Jobless Claims
- Durable Goods Orders
- GDP
10:00 | Existing Home Sales
Session Open Stats (As of 12:15 AM 9/25)
- Session Open ATR: 267.80
- Volume: 16K
- Open Int: 274K
- Trend Grade: Long
- From BA ATH: -0.9% (Rounded)
Key Levels (Rounded - Think of these as ranges)
- Long: 25204
- Mid: 23571
- Short: 21939
Keep in mind this is not speculation or a prediction. Only a report of the Power Range with Fib extensions for target hunting. Do your DD! You determine your risk tolerance. You are fully capable of making your own decisions.
BA: Back Adjusted
BuZ/BeZ: Bull Zone / Bear Zone
NZ: Neutral Zone
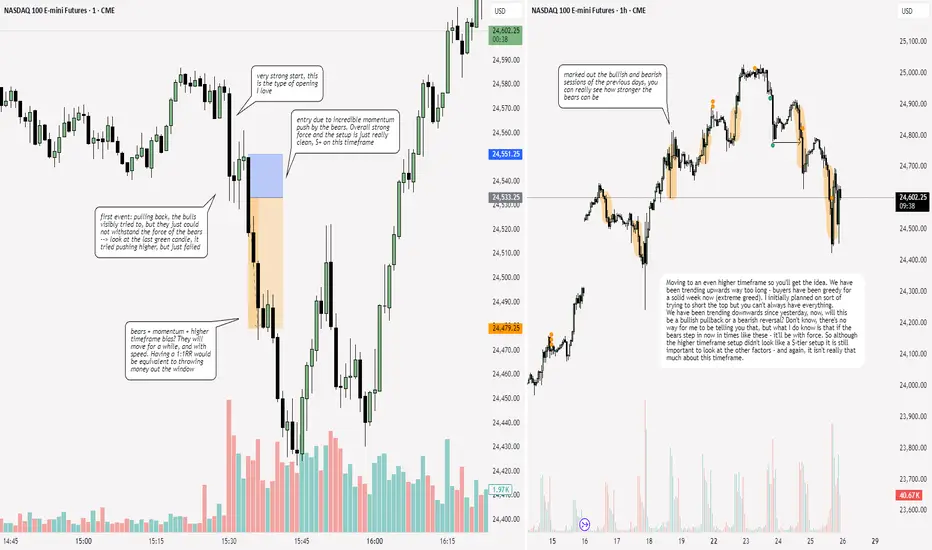
NQ: 260th trading session - recapPatience pays off - and again: I knew it was a great trade. I felt it, I always need to remind myself that if I'm not sure like today then it won't be a great trade. Easier said than done tho
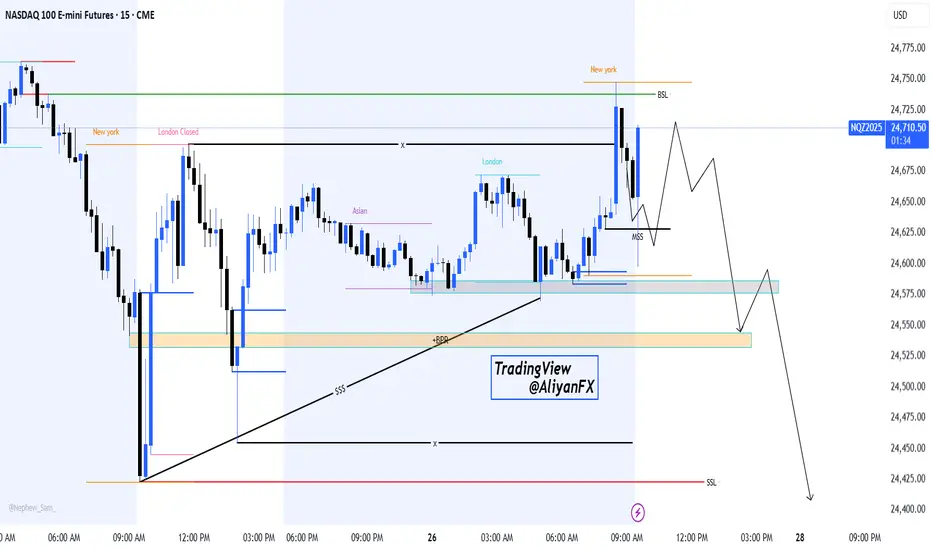
NASDAQ 100 – Potential Liquidity Grab & Bearish Continuation SetHello Billionaires!!
We All know that the Price has swept the New York session high (BSL) and is now showing signs of a potential market structure shift (MSS). If the short-term pullback holds, we may see a deeper retracement toward the demand zone (BPR + Asian range) before another leg down.
🔹Key Levels to Watch:
24,725 – 24,750: Liquidity grab zone (recent NY high)
24,575 – 24,550: Re-test area for possible continuation
24,500 – 24,450: Next downside target if bearish momentum continues
Bias: Short-term retracement followed by potential bearish continuation toward lower liquidity pools (SSL).
📌 This is an educational projection, not financial advice. Trade safe and always manage your risk!
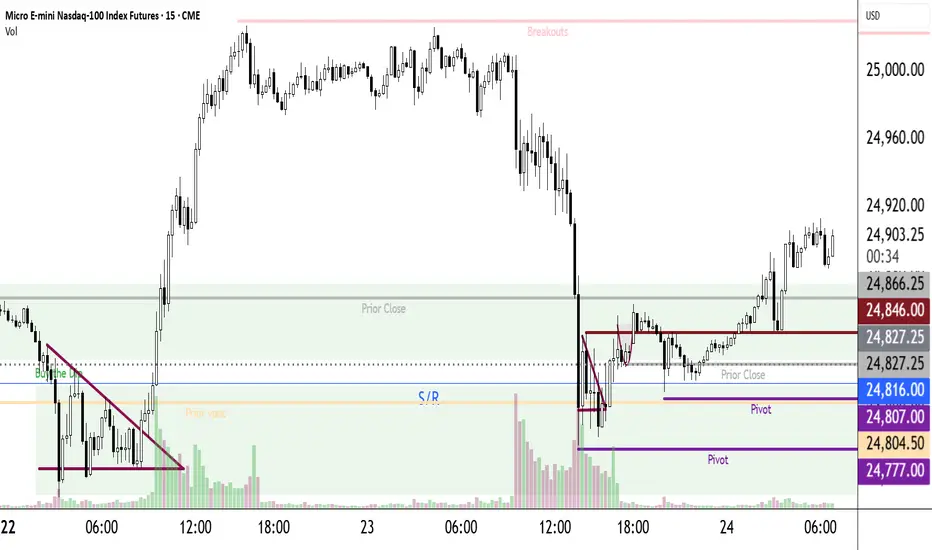
Precise Plan & ContextBeautiful chart. How to interpret it? How to trade it? How to manage risk?
One must have a precise plan, contextually interpret the charts and manage risk.
Precise Plan
1.Buy the Breakouts
2.Buy the Dips
3.Buy the Pivots
Buy the Breakouts
1.Wait for a bounce
2.Set a buy to open (bto) stop market order above the bounce
3.Enter a sell to close (stc) limit order
Buy the Dips
1.Wait for a bounce
2.Set a bto limit order less than the close of the bounce
3.When it fills set a stc limit order
Buy the Pivots
1.Find a strong Support
2.Set a bto limit order
3.When it fxs set a stc limit order
More Details
My Breakouts
1.I always stack them to the ceiling.
2.Most of the time I place a bto stop mkt order every 5 points.
3.For each entry I set a 19-point target.
NOTE: You must tailor this to your risk tolerance and to your account size.
NOTE: I do not place a stop loss. I manage risk by always keeping a close eye on Intraday Margin and Initial Margin. These are all-important. This cannot be over emphasized.
NOTE: Another way I manage risk is by not overlapping my trades. For example, if my margin requirements need some breathing room, I will not enter another trade until the prior trade has fxed its target.
My Buy the Dips
1.I usually wait for a bounce.
2.I buy them in descending 5-point intervals
3.19-point target for each trade
NOTE: Often, even a good bounce fails and the px goes lower. Always plan for this. Always.
NOTE: I always have accumulation/distribution areas clearly visible on my charts. This is where buyers and sellers have met in the past. Maybe they will meet here again.
NOTE: My goal is to have 5 a day. Here is the math with my broker: 5 trades x 5 days x 36.18 P x 50 weeks = $45,225.00. I am way ahead of that goal.
NOTE: Past performance is not indicative of future performance.
My Pivots
1.Look for a strong pivot.
2.I always aim to get a 101-point target.
Context is extremely important.
1.Learn how to interpret a chart. I assume most of you have learned the basics. If you haven't Jerremy Alexander Newsome has many great videos on YouTube. He also has much info on his website, reallifetrading.com. Investopedia is another great resource.
2.News is vital. News moves markets. Look at Liberation Day, 4/2/25. Look at June 13th, the day Israel bombed Iran. The jobs report comes out every first Friday of the month. Earnings reports matter. FOMC day, PCE, inflation data etc. etc. etc... I always look at MarketWatch's U.S. economic calendar. It's free and an invaluable resource. Find a reliable economic news source. I always have Fox Business on. They have great hosts and great guests. You will get a great economics education. Maria Bartiromo comes on at 06:00:00 NY time and she sets the day for any important events you should know.
3.We are in an historical bull market marking the early days of The Fourth Industrial Revolution - that of AI & Robotics.
I'm probably forgetting somethings right now. I will add them as I think of them. Here is one now - most of the time I am looking at a 5-minute chart. Here's another - I use Session Volume Profile charts daily. Each session (trading day) will have a point of control (poc). Buyers and sellers meet here. Sometimes a poc will not be touched by the next session's candles. It then becomes a virgin point of control (vpoc) and its significance becomes greater.
Until now, I have included many entries, many results and much math. I wanted you to get a feel for these things. They are the essence of trading. Perhaps going forward I won't post these, at least not so often.
I fear that I have been ham-handed in my posts - like a machine gun laying down rapid, unaimed firepower. I think this post best describes my trading plan and my thoughts on how important context is to trading. Context is far more comprehensive than just a chart, not to minimize the importance of charts. A chart, I suppose, could be pictured as a ship and context is the sea upon which that ship sails.
I hope this helps you have a Precise Trading Plan suitable to your singular needs, and that you see how vital and comprehensive Context is.
Bias NQMy bias on NQ for the rest of the week is bearish. We just inverted a 4H FVG, and there’s a high probability that price will target the lows.
Ideally, I’d like to see price reach at least the SSL I marked up.

long NQYep, i hope i didnt miss that trade at the first touch of the black box.
Anyways, dont chase that long, it does looks very solid setup, just wait for the price to touch this black box again (only if it happened), check the RSI if its oversold on 5 min tf, if so enter and stick to the SL regardless of the outcome.
Just hopefully the announced news by trump would not affect this setup.

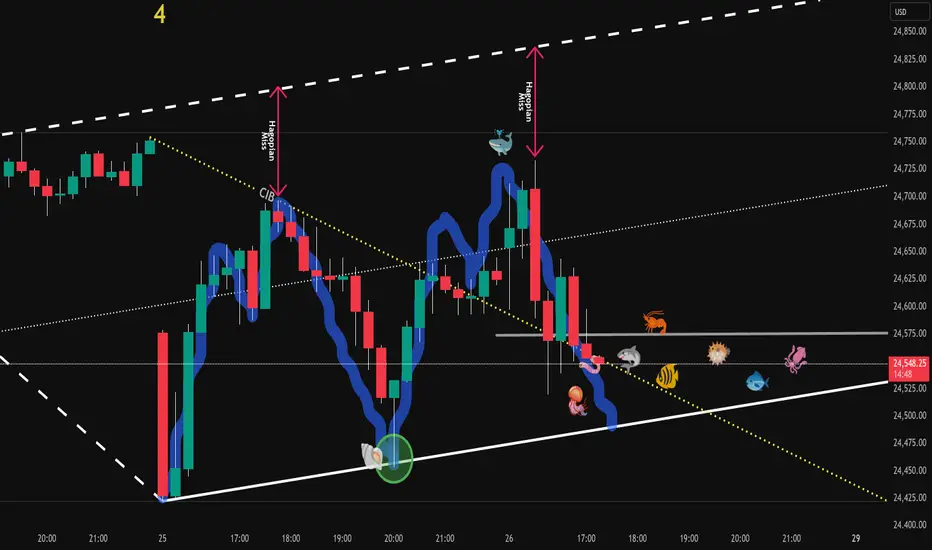
Nasdaq Pre-Market Long CIB Trade🔱 Here comes the CIB Trade 🔱
Price came down in 5 waves.
The CIB line gives us a heads-up if price breaks through it, and it did!
Now everyone and it's Grandma is long on the breakout.
"...let's scare them out, let's hit their Stop!"
Then we take off upon a test of the CIB-Line, which in essence is the same as a test fo a U-MLH or L-MLH after a break.
We have a nice target with a chance to hit of about 80% at the Centerline, and a fantastic tiny stop below the test at the CIB line.
Let's watch how this unfolds.

Day Trading a 50k AccountThree Trade Plans
1.Breakouts
2.Dips
3.Pivots
Context
1.historical bull market - the early days of The Fourth Industrial Revolution, that of AI and Robotics. Many millionaires and billionaires will be newly minted.
2.a great deal of news happened yesterday that the markets are still digesting.
3.new home sales come out @ 10:00
4.much possible market moving news comes out tomorrow (see MarketWatch U.S. Economic Calendar)
5.PCE is out 9/26 08:30. It is possible the markets will hang out waiting for that news. Watch that one carefully.
Action
1.Breakout orders are in place, stacked to the ceiling
2.Dips will be placed if we get a good bounce
3.Pivots: I have three in place, 24807, 24777, 24597.I won't place the 24807 order until our Pivot from 9/23 hits its target.

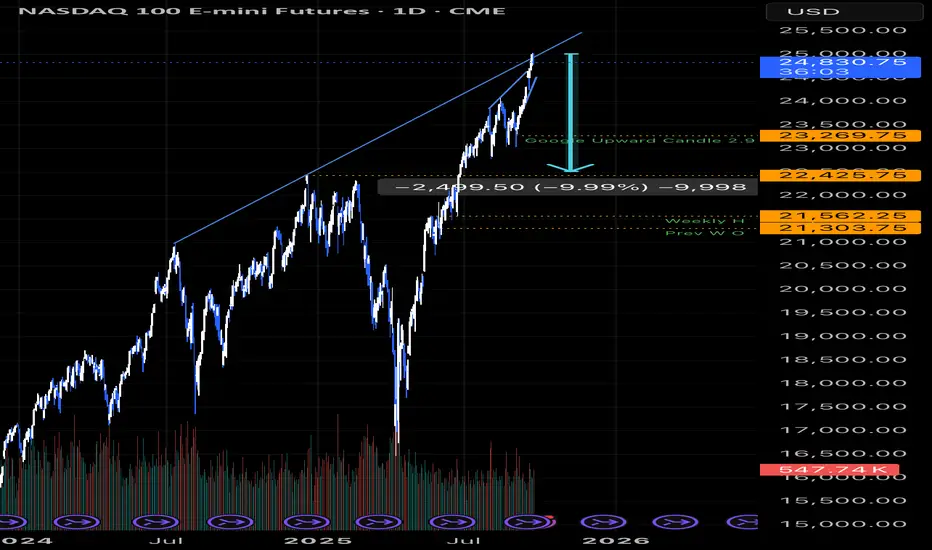
It‘s about Time… SHORT till NovemberTime to switch lanes
- upper trendline rejection
- sell pressure is building (build your shorts)
NASDAQ – Short// [H1-M5]After the recent Change of Character (ChoCH) and breakdown into a lower low, the market has established a new dealing range and change of bias. When price action trades inside the premium retracement zone (62.5%–75%), where we identified two heavy negative delta clusters, suggesting aggressive sell-side interest, we have just to wait a trigger.
Internal Supply (H1): aligned with the 62.5%-75% retracement and negative delta.
External Supply (H1): positioned at the extreme premium retracement, acting as a structural resistance wall for the bearish bias.
Unless price achieves a clear breakout and acceptance above these zones, the bias remains bearish, with continuation favored in line with the newly established structure.

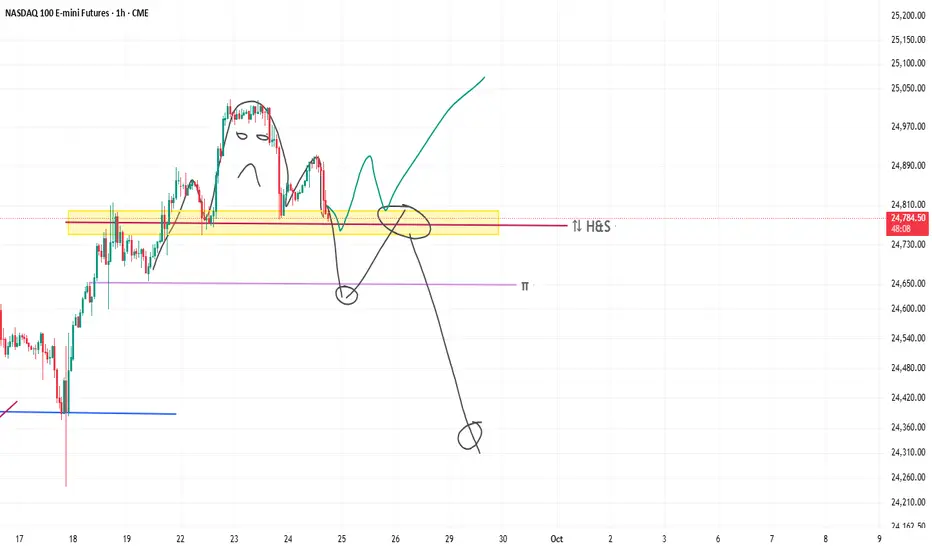
NQ. Decision point Yep, thats a classic H&S.
Soon enough one of two things will happen.
Either bulls defend this yellow area, especially if they are in with size at the top. or bears will take over.
So far iam not biased to short, but waiting for confirmation.
Also watch out, because sometimes whales just push the price down to convince everyone that they are selling, then push the price upwards.
NQ Long I know it may sound a bit unusual to long with too much blood on the streets, but given the current conditions, as long as we are not trading below 24K, taking a long position remains the most logical option for me.
This long setup becomes invalid if price fails to follow the exact path I outlined in the green drawing. If price does not break above the yellow trendline, then a continuation to the downside remains the more likely scenario.
