NQ Targets (09-22-25)NAZ with Friday-Monday O/N breakdown into Monday Open Drive (looking for Open Dive today). 24,900 is KL, Long above Short Scalp below to drop target test below.
4HR below with Blue YTD open level.
NQZ2021 trade ideas
NQ Targets (09-29-25 Week 1)Add on to Published "7 week Post". This week's Churn Zone. Will update daily with any calls, as usual. Other Post is just bigger picture of forecast.
GoFED, BTD/FOMO with captain Tweety.

A Bullish Friday for NasdaqNow that support has been reached, I’m anticipating Nasdaq to resume its bull run. During the AM session, I’ll be watching for either a double bottom or an inverse head-and-shoulders pattern to form.
On the daily chart, I’m anticipating a rejection from the 24,600 Daily FVG.
It may be too early to confirm, so I’ll revisit and update this idea in the morning.
Lets go Long⚡

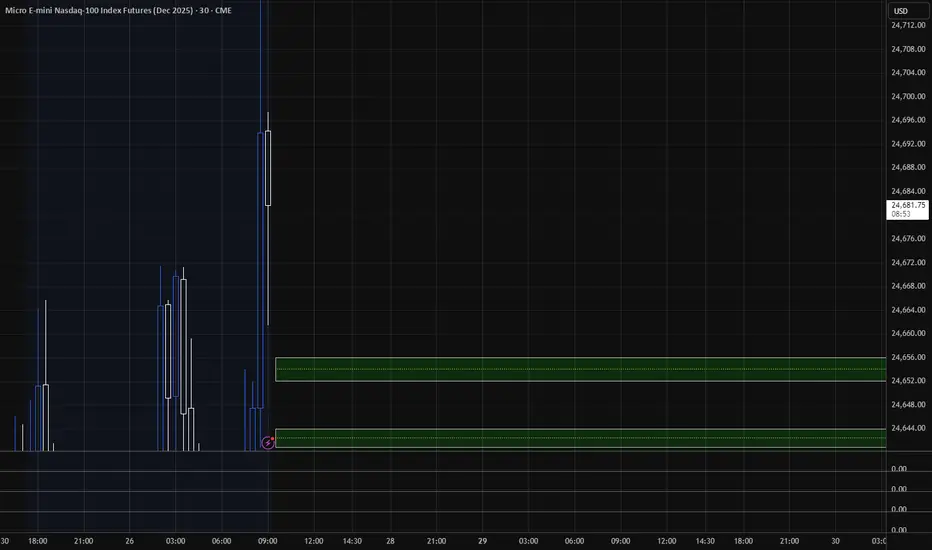
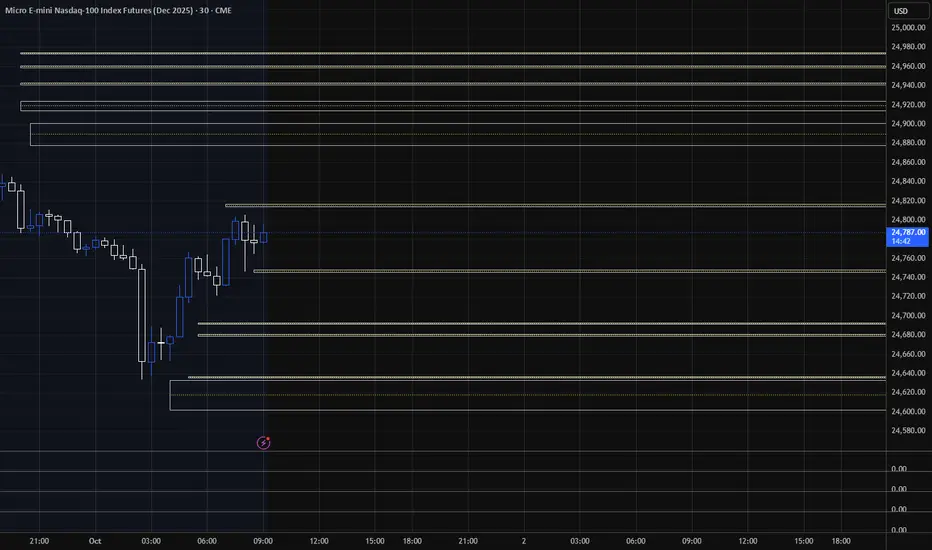
Target areas - NQ price for Market open.9/26/25 These are the target areas - NQ price for Market open depending if price moves up or down. Will look for trades into these areas.
NQ is twitching the worm - Don't take the bait🎣 Don’t take the bait! 🎣
Just sitting here, watching my pre-market setup.
Now I can see them twitching the worm, trying to lure me in.
NOPE!
This price action’s way too twitchy for me. §8-)
This Chart is a RTH with "Gap-Attached" and gives a perfect catch of the first drop.
So, just casually watching...maybe I can learn even more...
🐟🐠🐡🐟🐠🐡🐟🐠🐡🐟🐠🐡🐟🐠🐡🐟🐠🐡🐟🐠🐡
NQ Targets (09-29-25)Moving into October, 7 week range forecast. Basically, 23,050 is 50% retracement of YTD lift. Looking for a retest of that, no hold and keep going to the YTD Open or circle below (yellow arrow path). White arrow path has two targets, these are potential drop/rejection zones (to yellow arrow path). KL 24,950 is ML of TZ, we have played in lower half and may see some play in upper half. Sideways to lower during this 7 week period is the idea.

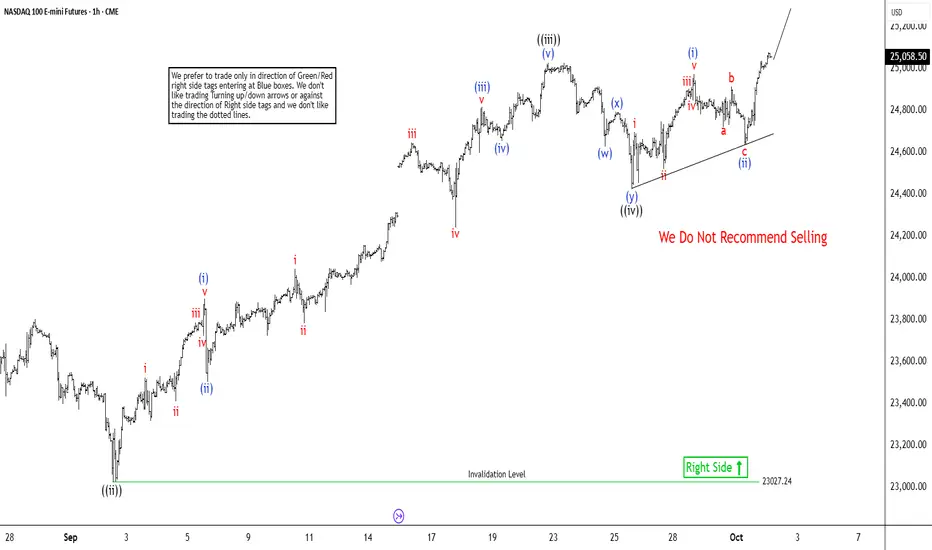
Nasdaq (NQ) on Track for Higher Wave 5 FinishThe short-term Elliott Wave analysis for the Nasdaq (NQ) reveals a bullish cycle initiated from the August 2, 2025, low, progressing as a five-wave impulse structure. Wave ((i)) surged to 24,068.5. The corrective wave ((ii)) concluded at 23,025.25, as depicted in the one-hour chart. The Index then advanced in wave ((iii)) to 25,027.25. This wave developed as an impulse in a lesser degree, showcasing robust bullish momentum in the market.
From the wave ((ii)) low, wave (i) climbed to 23,902. A brief dip in wave (ii) stabilized at 23,505. Wave (iii) rallied to 24,816. A minor pullback in wave (iv) ended at 24,655. The final leg, wave (v), reached 25,027.25, completing wave ((iii)) in the higher degree. The subsequent wave ((iv)) correction unfolded as a double-three Elliott Wave structure, a common pattern in such cycles. From wave ((iii)), wave (w) declined to 24,627. Wave (x) recovered to 24,793.50. Wave (y) then dropped to 24,422.5, finalizing wave ((iv)).
As long as the pivotal low at 23,027.2 remains intact, the Index is expected to extend higher in wave ((v)). This outlook supports continued upside in the near term, consistent with the impulsive structure’s progression and market dynamics.
Target areas - NQ price for Market open.10/1/25 - These are the target areas - NQ price for Market open depending if price moves up or down. Will look for trades into these areas.

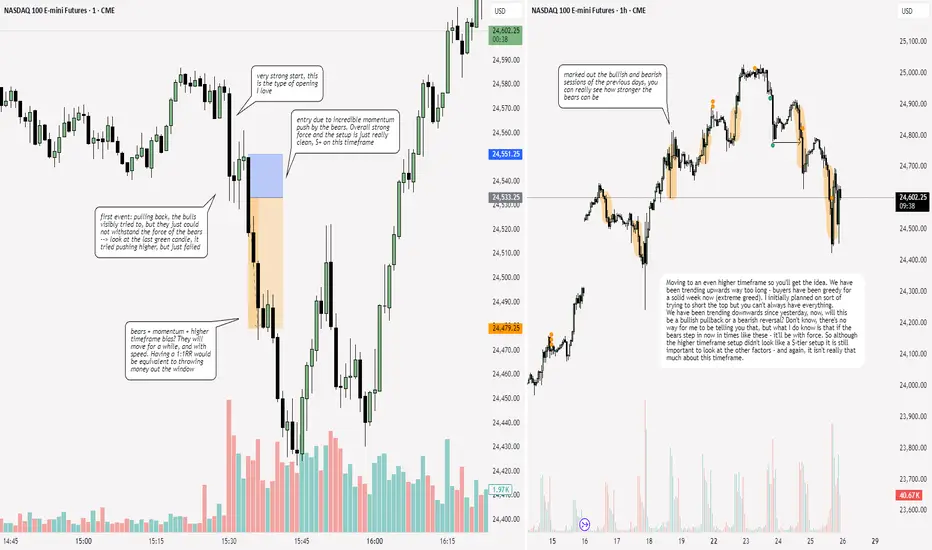
NQ: 260th trading session - recapPatience pays off - and again: I knew it was a great trade. I felt it, I always need to remind myself that if I'm not sure like today then it won't be a great trade. Easier said than done tho
Short Trade Idea for 9/30 | NQI’m anticipating price to either push into the 1H bearish imbalance at 24,894 or reject from the NWOG around the 24,856 range before turning lower toward the 24,640.00 range. My bias is firmly short for now — but I’ll reassess as we approach the open.

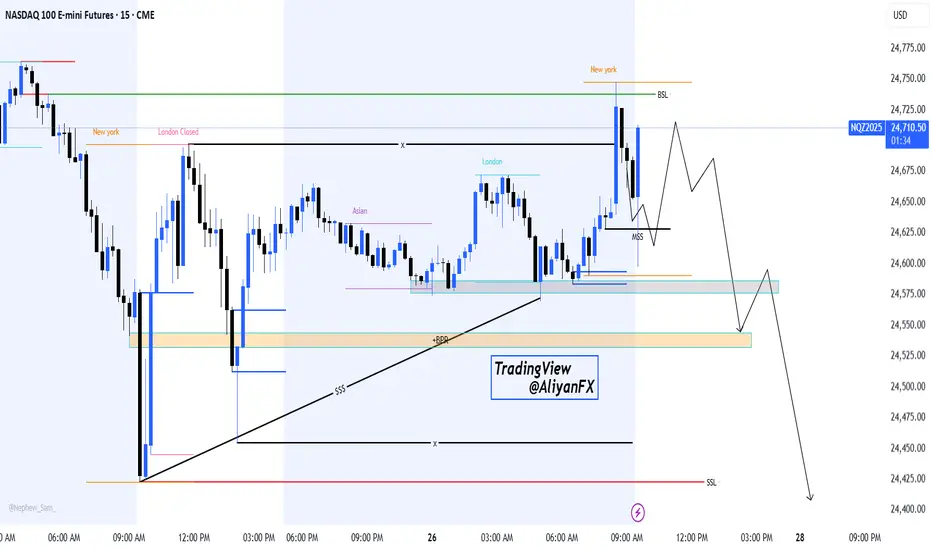
NASDAQ 100 – Potential Liquidity Grab & Bearish Continuation SetHello Billionaires!!
We All know that the Price has swept the New York session high (BSL) and is now showing signs of a potential market structure shift (MSS). If the short-term pullback holds, we may see a deeper retracement toward the demand zone (BPR + Asian range) before another leg down.
🔹Key Levels to Watch:
24,725 – 24,750: Liquidity grab zone (recent NY high)
24,575 – 24,550: Re-test area for possible continuation
24,500 – 24,450: Next downside target if bearish momentum continues
Bias: Short-term retracement followed by potential bearish continuation toward lower liquidity pools (SSL).
📌 This is an educational projection, not financial advice. Trade safe and always manage your risk!
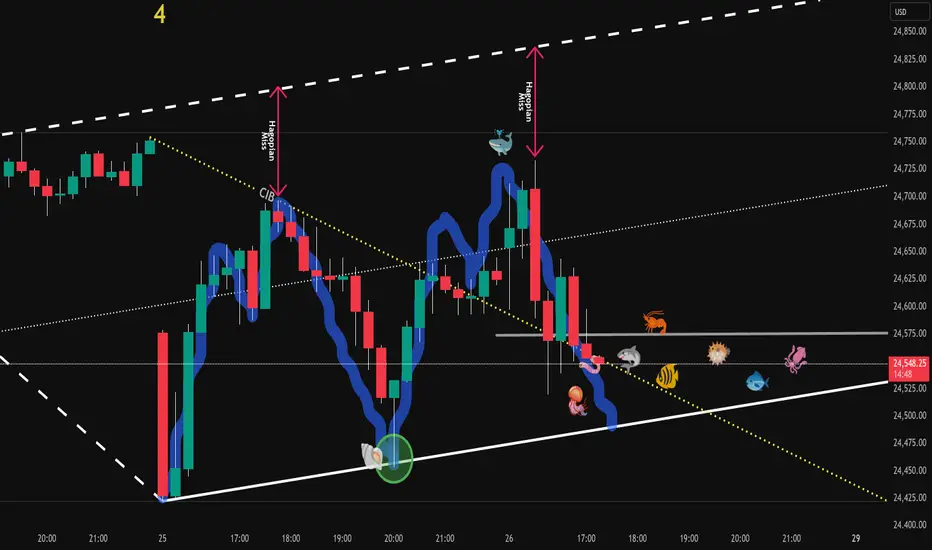
Nasdaq Pre-Market Long CIB Trade🔱 Here comes the CIB Trade 🔱
Price came down in 5 waves.
The CIB line gives us a heads-up if price breaks through it, and it did!
Now everyone and it's Grandma is long on the breakout.
"...let's scare them out, let's hit their Stop!"
Then we take off upon a test of the CIB-Line, which in essence is the same as a test fo a U-MLH or L-MLH after a break.
We have a nice target with a chance to hit of about 80% at the Centerline, and a fantastic tiny stop below the test at the CIB line.
Let's watch how this unfolds.

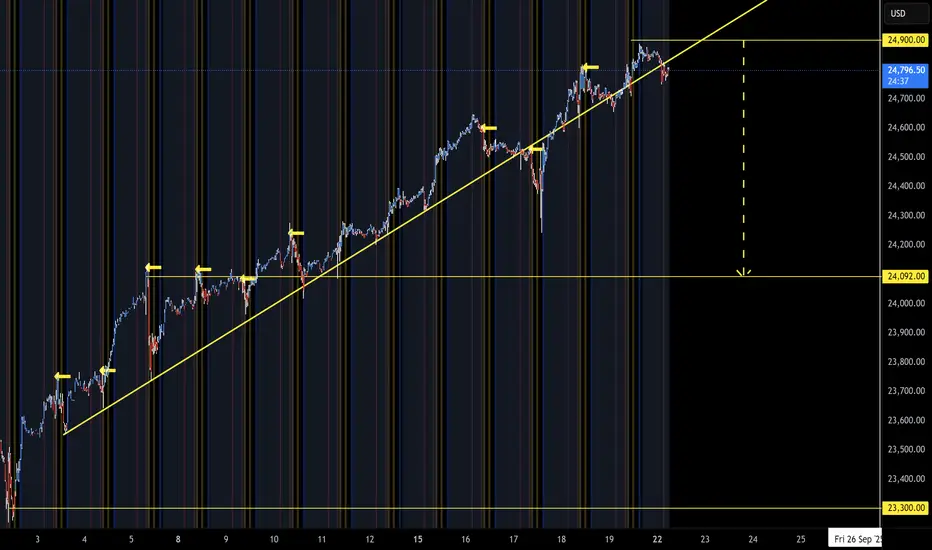
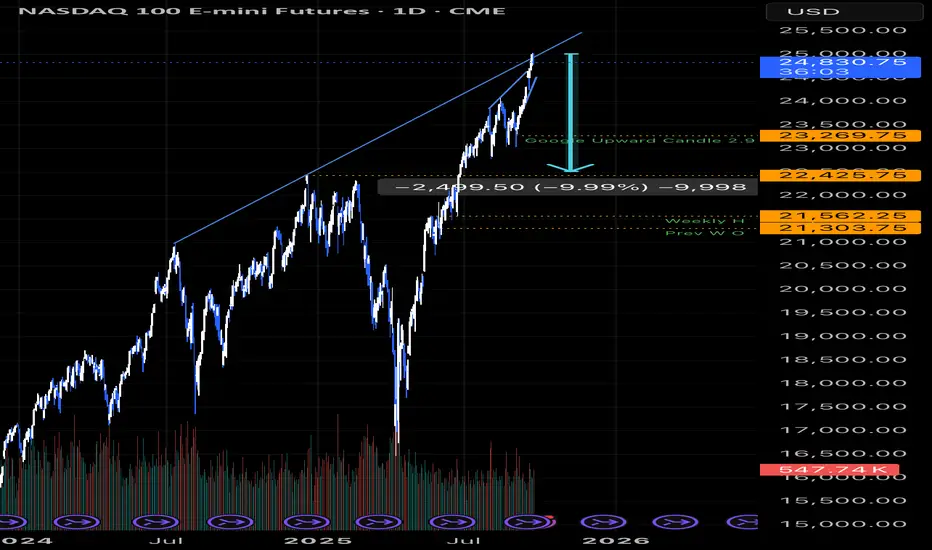
It‘s about Time… SHORT till NovemberTime to switch lanes
- upper trendline rejection
- sell pressure is building (build your shorts)
Target areas - NQ price for Market open.9/29/25 These are the target areas - NQ price for Market open depending if price moves up or down. Will look for trades into these areas.

ES1 & NQ1 Daily Trade Setups 2/10/25IN this update we review th erecent price action in Sp500 & Nasdaq futures contracts and identify the next high probability trade setups and price opbjectives to tatrget. To review today's video analysis click below!

Nasdaq Buy idea Based on previous data Nasdaq should expect a push upwards. I’ve marked charts with reasoning and added SL and TP levels. Good luck

NQ Long I know it may sound a bit unusual to long with too much blood on the streets, but given the current conditions, as long as we are not trading below 24K, taking a long position remains the most logical option for me.
This long setup becomes invalid if price fails to follow the exact path I outlined in the green drawing. If price does not break above the yellow trendline, then a continuation to the downside remains the more likely scenario.

Double Bottom on VPOC vs Monster Head & ShouldersWho will win this epic battle? A close above the neckline and then a bounce off it...No matter - I have Breakout Orders every 10 points beneath it and every 5 points above it. Every entry has a 19-point target.
Pros:
1.Historical bull run - The Fourth Indusrial Revolution
2.2nd QTR GDP 3.8%
3.Growth-oriented administration
4.Peace-minded administration
5.Deregulations being slashed
6.Industries are onshoring
7.Terrific tax incentives to buy, build and grow
8.Earnings strong: S&P 500 up 7.7% YOY; 9 consecutive QTRs of gains
Watch carefully PCE report Friday, 08:30 NY time.
If the markets like it, we may easily dance on top of old man's head and then go higher. If they don't - we'll be ready to Buy the Dips and Pivots.
Stay tuned.

NQ - 9/26Alright, I think there is value to keeping the same T.A. as yesterday then updating the T.A. as each day goes so that I'll be more motivated to write out the MarketMeta better.
These are journals but I understand others want to understand the candle science of ranges and the 4 candles and 6 levels they create. It took me a long time to comprehend it as I studied the courses from C0TT0NC4NDYTA.
StudyGuideTA is the simplified version - AKA my personal notes and understanding using his definitions or "Science" of trading.
Yesterday's levels were tested and changed to dotted lines. Thick 2x yellow level Inv.BS evolved its role to a "bridge" - This is like the polarity point where levels is acting as resistance but then will act as support as price crosses and closes above it.


NQ 9/30Weekly timeframe high low and median range boxed in grey
the daily high, low and median range from yesterday is boxed in red
orange levels are 4hr timeframe
yellow are 1hr timeframe
blue are 15min timeframe levels

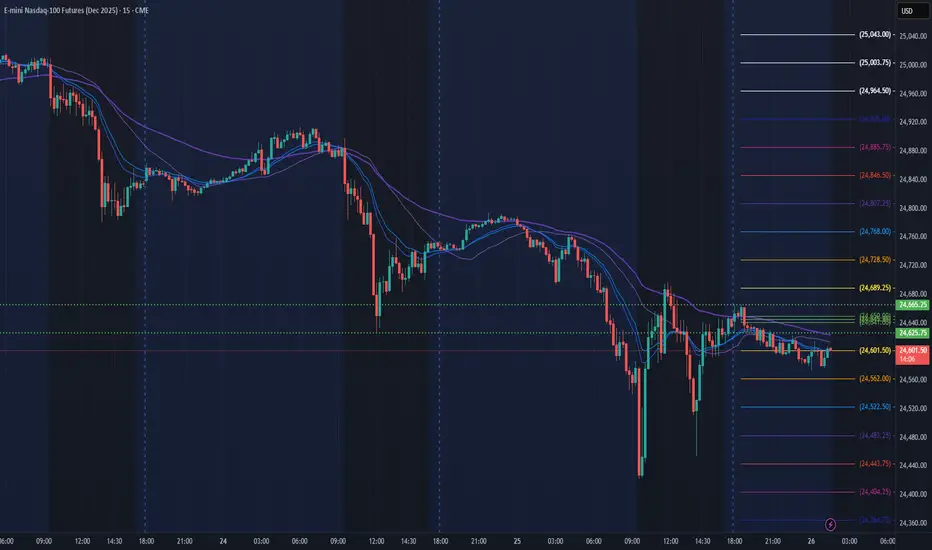
NQ Power Range Report with FIB Ext - 9/26/2025 SessionCME_MINI:NQZ2025
- PR High: 24665.25
- PR Low: 24625.75
- NZ Spread: 88.5
Key scheduled economic events:
08:30 | Core PCE Price Index (MoM|YoY)
Session Open Stats (As of 1:15 AM 9/26)
- Session Open ATR: 276.26
- Volume: 29K
- Open Int: 277K
- Trend Grade: Long
- From BA ATH: -1.7% (Rounded)
Key Levels (Rounded - Think of these as ranges)
- Long: 25204
- Mid: 23571
- Short: 21939
Keep in mind this is not speculation or a prediction. Only a report of the Power Range with Fib extensions for target hunting. Do your DD! You determine your risk tolerance. You are fully capable of making your own decisions.
BA: Back Adjusted
BuZ/BeZ: Bull Zone / Bear Zone
NZ: Neutral Zone